11email: smieske@eso.org 22institutetext: Astronomical Institute, Ruhr-University Bochum, Universitätsstr. 150, 44780 Bochum, Germany 33institutetext: Department of Astronomy and Space Science, Chungnam National University, Daejeon 305-764, Korea 44institutetext: Department of Astronomy & Center for Space Astrophysics, Yonsei University, Korea
Compact stellar systems in the Fornax cluster: a UV perspective††thanks: Based on observations made with the NASA Galaxy Evolution Explorer GALEX. GALEX is operated for NASA by the Califonia Institute of Technology under NASA contract NAS5-98034.
Abstract
Context. In recent years, increasing evidence for chemical complexity and multiple stellar populations in massive globular clusters (GCs) has emerged, including extreme horizontal branches (EHBs) and UV excess.
Aims. Our goal is to improve our understanding of UV excess in compact stellar systems, covering the regime of both ultra-compact dwarf galaxies (UCDs) and massive GCs.
Methods. We use deep archival GALEX data of the central Fornax cluster to measure NUV and FUV magnitudes of UCDs and massive GCs.
Results. We obtain NUV photometry for a sample of 35 compact objects that cover a range mag. Of those, 21 objects also have FUV photometry. Roughly half of the sources fall into the UCD luminosity regime (11 mag). We find that seven out of 17 massive Fornax GCs exhibit a NUV excess with respect to expectations from stellar population models, both for models with canonical and with enhanced Helium abundance. This suggests that not only He-enrichment has contributed to forming the EHB population of these GCs. The GCs extend to stronger UV excess than GCs in M31 and massive GCs in M87, at the 97% confidence level. Most of the UCDs with FUV photometry also show evidence for UV excess, but their UV colours can be matched by isochrones with enhanced Helium abundances and old ages 12-14 Gyrs. We find that Fornax compact objects with X-ray emission detected from Chandra images are almost disjunct in colour from compact objects with GALEX UV detection, with only one X-ray source among the 35 compact objects. However, since this source is one of the three most UV bright GCs, we cannot exclude that the physical processes causing X-ray emission also contribute to some of the observed UV excess.
Key Words.:
galaxies: clusters: individual: Fornax – galaxies: dwarf – Stars: horizontal branch – Stars: evolution – galaxies: star clusters1 Introduction
In recent years, increasing evidence for chemical complexity and multiple stellar populations in several massive Galactic globular clusters (GCs) has emerged (e.g. Gratton et al. 2004, Bedin et al. 2004, Piotto et al. 2007, Milone et al. 2008). For some globular clusters (e.g. Centauri and NGC 2808) there is evidence that these multiple populations may be due to an enhancement in Helium content (up to ), as deduced from the presence of extremely blue horizontal branches (EHBs) and multiple main sequences (D’Antona et al. 2005, Lee et al. 2005). The link between occurence of EHBs and He-enhancement is, however, under debate. EHB stars may also originate directly from fast rotating stars with an enhanced mass loss during the red giant branch (RGB) evolution. Those stars leave the RGB before the He flash towards the (He-core) white dwarf cooling curve where they ignite Helium and end up on the EHB (Castellani & Castellani 1993, D’Cruz et al. 1996, Brown et al. 2001). This is sometimes called the ’hot-flasher’ scenario. A significant fraction of the EHB stars in Centauri seem to have followed this evolutionary path (Moehler et al. 2007).
It has been shown that EHB stars contribute most of the light in the UV bands (e.g. NGC 2808: Dieball et al. 2005). The presence of an EHB in extragalactic - unresolved - GCs reveals itself in the integrated light by a UV-excess compared to GCs with a ‘normal’ horizontal branch (HB). For example, Rey et al. (2007) find three metal-rich ([Fe/H]1) GC candidates in M31 with significant FUV flux which are thought to be analogs of two peculiar Galactic GCs, NGC 6388 and NGC 6441 (Yoon et al. 2008). Sohn et al. (2006) and Kaviraj et al. (2007) analysed the UV properties of massive globular clusters associated with M87 in the Virgo cluster, and found that many of them show a UV-excess with respect to canonical stellar population models. These findings support the idea that EHBs may be a common feature to the most massive compact stellar systems.
In this Research Note we focus on the UV properties of compact stellar systems in the Fornax cluster. In contrast to the studies of Sohn et al. and Kaviraj et al. on Virgo GCs, we extend our analysis to compact stellar systems beyond the mass range of GCs ( M☉), including the so-called ultra-compact dwarf galaxies (UCDs, Drinkwater et al. 2003), which cover the mass range up to M☉, having mag. We analyse how the UV properties of UCDs compare to those of both massive and normal GCs, in order to improve our knowledge of EHB occurence in compact stellar systems. Throughout this study we adopt (m-M)=31.4 mag (Freedman et al. 2001) as distance modulus to the Fornax cluster.
2 The data
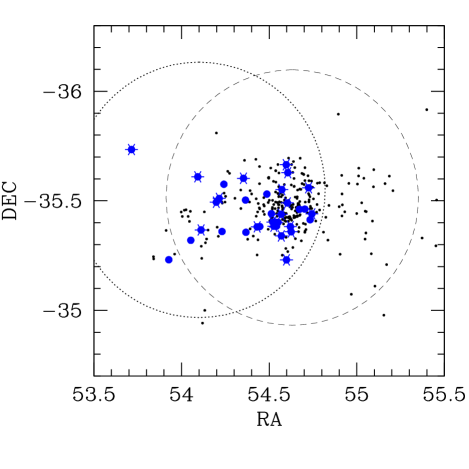
In order to investigate the UV properties of massive compact stellar systems in Fornax, we retrieved archival FUV and NUV GALEX images from two pointings in the Fornax cluster111http://galex.stsci.edu/GR2/. One pointing was offset from NGC 1399 by about 0.4 to the west, and had been taken within the Deep Imaging Survey (DIS) with integration time 18000 seconds. The other pointing was centered on NGC 1399, taken within the Near Galaxy Survey (NGS), with integration time 1700 seconds in FUV and NUV. See Fig. 1.
We subtracted the two giant elliptical galaxies NGC 1399 and NGC 1404 from the archival GALEX images, using the modelling routines ellipse and bmodel within IRAF. Then we run SExtractor on the images to create a source catalog of detections in NUV and FUV. For this we required a minimum of 5 adjacent pixels with at least 2 above the sky noise. We adopted MAG_BEST as source magnitude, and used the GALEX photometric zero-points given in the image headers. From artificial star experiments using the same detection parameters we derived 50% completeness limits for unresolved sources in the DIS images of NUV mag, and FUV mag. The region within 2′ of the center of NGC 1399 showed a considerably brighter completeness limit by 1-2 mag. The GALEX detections in the output catalogs were then matched with the position of compact Fornax cluster members known from an up-to-date compilation of literature spectroscopic surveys in Fornax, which extends to about V22.2 mag (Kissler-Patig et al. 1999; Mieske et al. 2002 & 2004; Dirsch et al. 2004; Bergond et al. 2007; Firth et al. 2007; Richtler et al. 2008; Karick et al. 2008, private communications; see also Tables 1 and 2). There are no compact Fornax cluster members known within 2′ of NGC 1399 (Fig. 1), such that the completeness drop in this region is irrelevant in the context of this study. The allowed matching radius was 3′′, which is about 2 GALEX pixels, or 2/3 of the GALEX PSF FHWM.
All matches on the GALEX images were visually classified in an independent manner by the authors SM and SCR into clear and marginal detections. We kept matches if they were classified as clear detection by both authors. In addition we also kept matches in a given filter band for which at least one of the authors gave a clear classification, if the source was classified by both authors as a clear detection in the other filter band. We excluded sources from the match list which from higher resolution optical imaging (Mieske et al. 2007) had neighbouring sources within a radius of 4′′ that were not fainter than mag. This was to make sure that the detected UV flux indeed originates from the compact object and not a close neighbour. About 20% of the UV matches were affected by this rejection.
The final sample of visually confirmed NUV matches contains 35 objects with mag ( mag), while the catalog of FUV matches contains 21 objects with mag ( mag). All of the FUV matches are also NUV matches. In Tables 1 and 2 the photometric properties of the objects are listed. Fig. 1 shows a map of the investigated area and a V,I colour-magnitude diagram, indicating the FUV and NUV matches together with the full literature sample of Fornax compact objects. The photometry was corrected for foreground extinction using the reddening maps of Schlegel et al. (1998). Mainly optically blue GCs are detected in the GALEX images. We attribute this to the fact that the completeness limits of this data set favour the detection of UV bright sources in the GC magnitude regime (see next Section). In Fig.1 (right panel) we also indicate data points for GCs in M31 and M87 with UV coverage.
| ID | RA [2000] | DEC [2000] | V0 [mag] | (V-I)0 | (NUV-V)0 | (FUV-V)0 | (FUV-NUV)0 |
|---|---|---|---|---|---|---|---|
| UCD3 | 3:38:54.0 | -35:33:33.8 | 18.03 (0.16) | 1.23 (0.12) | 3.93 (0.16) | 4.42 (0.17) | 0.49 (0.06) |
| UCD6 | 3:38:05.0 | -35:24:09.7 | 18.89 (0.14) | 1.11 (0.11) | 3.96 (0.16) | 4.61 (0.17) | 0.65 (0.12) |
| UCD27 | 3:38:10.3 | -35:24:06.1 | 19.66 (0.11) | 1.08 (0.06) | 3.51 (0.15) | 3.21 (0.14) | 0.31 (0.13) |
| UCD12 | 3:36:26.7 | -35:22:01.6 | 19.72 (0.03) | 1.05 (0.05) | 2.89 (0.07) | 4.28 (0.14) | 1.39 (0.15) |
| UCD25 | 3:37:43.6 | -35:22:52.0 | 19.75 (0.06) | 0.97 (0.05) | 3.26 (0.12) | 3.37 (0.11) | 0.10 (0.14) |
| UCDk | 3:38:23.7 | -35:13:49.4 | 19.79 (0.06) | 0.92 (0.05) | 3.46 (0.11) | 4.07 (0.12) | 0.60 (0.14) |
| K1011 | 3:37:24.8 | -35:36:10.1 | 19.88 (0.06) | 1.02 (0.05) | 4.15 (0.15) | 3.72 (0.14) | 0.43 (0.19) |
| UCD41 | 3:38:29.0 | -35:22:56.6 | 19.94 (0.07) | 1.14 (0.04) | 3.58 (0.19) | 3.82 (0.13) | 0.24 (0.21) |
| UCDm | 3:38:06.5 | -35:23:03.8 | 19.97 (0.06) | 0.98 (0.04) | 3.77 (0.12) | 3.65 (0.12) | 0.13 (0.15) |
| K1002 | 3:36:22.2 | -35:36:34.6 | 19.98 (0.06) | 0.95 (0.05) | 3.20 (0.10) | 4.71 (0.17) | 1.51 (0.18) |
| UCD32 | 3:38:16.7 | -35:20:23.3 | 20.05 (0.06) | 0.97 (0.03) | 3.60 (0.11) | 4.25 (0.24) | 0.64 (0.26) |
| UCD39 | 3:38:25.5 | -35:37:42.6 | 20.08 (0.07) | 1.10 (0.04) | 4.57 (0.21) | 4.70 (0.18) | 0.13 (0.25) |
| uc218.7 | 3:38:23.4 | -35:39:53.3 | 20.21 (0.09) | 1.43 (0.07) | 3.14 (0.15) | 3.66 (0.17) | 0.52 (0.19) |
| UCD31 | 3:38:16.5 | -35:26:19.3 | 20.30 (0.08) | 0.93 (0.05) | 3.72 (0.16) | 4.05 (0.18) | 0.33 (0.21) |
| UCD33 | 3:38:17.5 | -35:33:04.0 | 20.36 (0.06) | 0.97 (0.05) | 3.80 (0.15) | 4.29 (0.26) | 0.48 (0.29) |
| Y99025 | 3:38:58.6 | -35:26:26.2 | 20.42 (0.10) | 0.94 (0.04) | 2.93 (0.15) | 3.85 (0.17) | 0.92 (0.18) |
| K1007 | 3:36:47.6 | -35:29:37.3 | 20.43 (0.07) | 0.94 (0.04) | 2.95 (0.14) | 4.30 (0.21) | 1.35 (0.23) |
| K1000 | 3:34:51.4 | -35:44:02.8 | 20.44 (0.06) | 0.94 (0.05) | 3.22 (0.12) | 3.89 (0.18) | 0.67 (0.20) |
| UCD38 | 3:38:25.1 | -35:29:25.1 | 20.49 (0.14) | 0.96 (0.12) | 3.61 (0.21) | 2.93 (0.18) | 0.68 (0.19) |
| UCD17 | 3:36:51.7 | -35:30:38.9 | 20.53 (0.08) | 1.01 (0.04) | 2.40 (0.20) | 3.05 (0.16) | 0.65 (0.23) |
| FCOS 0_2032 | 3:38:30.2 | -35:21:31.0 | 20.82 (0.08) | 1.02 (0.08) | 3.32 (0.22) | 3.23 (0.22) | 0.09 (0.29) |
| ID | RA [2000] | DEC [2000] | V0 [mag] | (V-I)0 | (NUV-V)0 |
|---|---|---|---|---|---|
| NTT414 | 3:38:09.7 | -35:23:01.3 | 19.57 (0.17) | 0.97 (0.11) | 4.12 (0.23) |
| NTT410 | 3:38:12.2 | -35:24:06.5 | 19.71 (0.12) | 1.18 (0.08) | 2.86 (0.25) |
| UCD20 | 3:37:27.6 | -35:30:12.6 | 20.04 (0.07) | 1.02 (0.04) | 3.72 (0.18) |
| UCD18 | 3:36:55.5 | -35:21:36.0 | 20.29 (0.04) | 0.71 (0.04) | 1.29 (0.05) |
| FCOS 1_0630 | 3:38:56.1 | -35:24:49.0 | 20.31 (0.08) | 1.00 (0.07) | 3.19 (0.16) |
| FCOS 2_2165 | 3:37:28.2 | -35:21:23.0 | 20.60 (0.08) | 0.95 (0.07) | 3.44 (0.19) |
| gc235.7 | 3:36:12.7 | -35:19:11.6 | 20.64 (0.07) | 0.89 (0.03) | 2.69 (0.11) |
| Y7225 | 3:37:47.2 | -35:22:57.4 | 20.71 (0.10) | 0.92 (0.08) | 2.82 (0.18) |
| gc290.6 | 3:35:42.5 | -35:13:52.0 | 20.92 (0.04) | 0.94 (0.02) | 1.70 (0.07) |
| FCOS 1_2089 | 3:38:48.9 | -35:27:43.9 | 20.97 (0.09) | 0.99 (0.08) | 3.33 (0.22) |
| 91.041 | 3:37:56.9 | -35:31:50.9 | 21.12 (0.08) | 0.90 (0.05) | 2.93 (0.22) |
| 86.112 | 3:38:41.4 | -35:27:41.0 | 21.29 (0.07) | 0.99 (0.05) | 2.57 (0.24) |
| Y1149 | 3:36:58.0 | -35:34:32.2 | 21.29 (0.06) | 0.82 (0.05) | 2.17 (0.10) |
| 81.008 | 3:38:03.0 | -35:26:28.3 | 21.41 (0.09) | 0.96 (0.05) | 2.55 (0.19) |
3 Results
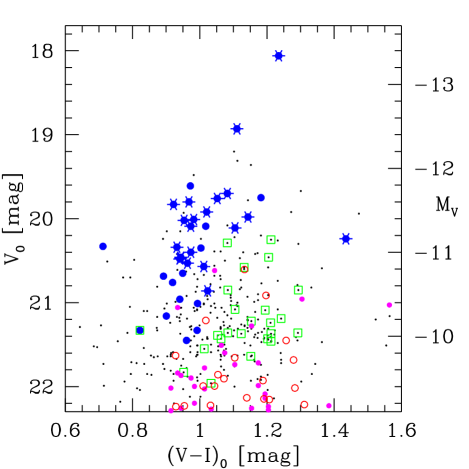
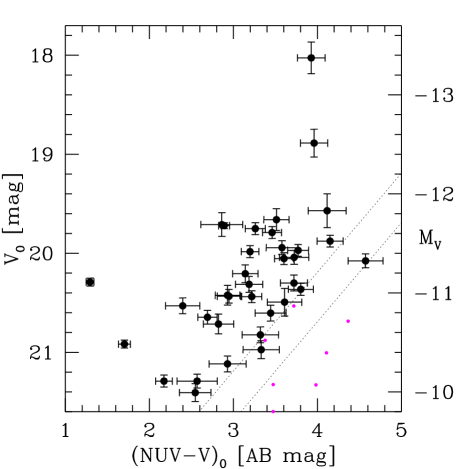
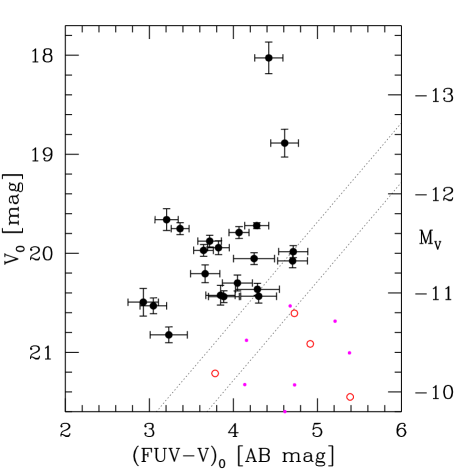
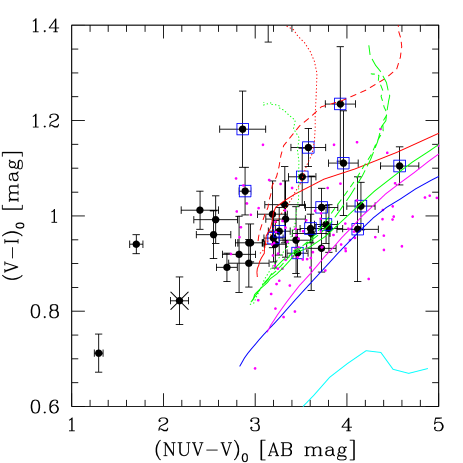
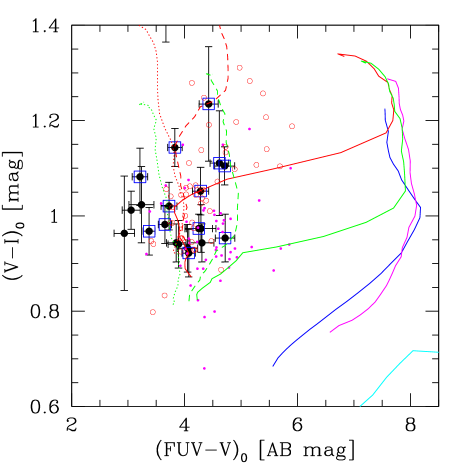
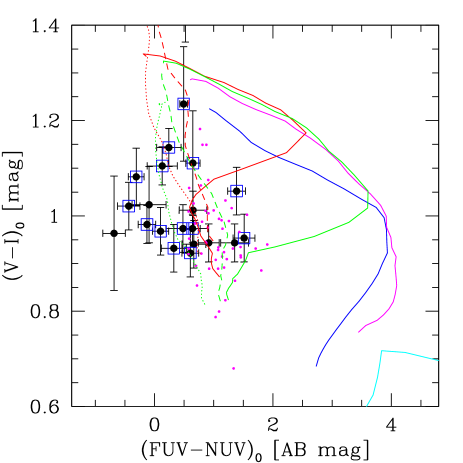
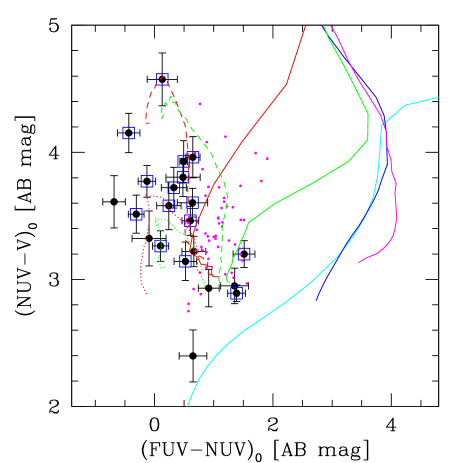
In Fig. 2 we plot two colour-magnitude diagrams (CMDs) of the NUV matches, one of (NUV-V) vs. V, and one of (FUV-V) vs. V. As stated before, all the FUV matches are also NUV matches. We indicate the magnitude dependent colour limits of the data, which biases us towards detecting UV bright objects at fainter optical luminosities (see also Sect. 2). In Fig. 3, we plot colour-diagrams of (V-I) vs. (NUV-V), (V-I) vs. (FUV-V), (V-I) vs. (FUV-NUV), and (NUV-V) vs. (FUV-NUV). In all four plots we also indicate the GALEX data for GCs in M31, taken from the compilation of Rey et al. (2007). Furthermore, we show FUV data points for the M87 GCs from the compilation of Sohn et al. (2006). Note that due to the sensitivity limit of our used GALEX data, we would at the distance of Fornax be able to detect only two of the M31 GCs, and none of the M87 GCs (see Fig. 2).
In the colour-magnitude diagram of (NUV-V) vs. V (Fig. 2, left panel), we find that sources brighter than 11.1 mag exhibit exclusively “red” colours mag. Fainter than this, several sources extend to bluer colours , indicating a UV excess relative to the brighter objects. Note that 11 mag corresponds to the approximate separation between ordinary GCs and UCDs (Haşegan et al. 2005; Mieske et al. 2006). We can therefore state that seven out of 17 massive Fornax GCs detected in the GALEX images exhibit a UV excess relative to UCDs. Massive Fornax GCs ( mag) have a mean colour of (NUV-V)= 2.92 0.13 mag, Fornax UCDs ( mag) have (NUV-V)=3.49 0.17 mag, while the full sample of M31 GCs has a mean colour of (NUV-V)=3.73 0.07 mag (see Fig. 3).
Is this relative UV-excess indicative of more extreme horizontal branches in those Fornax GCs? Or is the UV-excess simply due to a much younger age? To address this question, we make use of a grid of simple stellar population (SSP) models which are constructed using the Yonsei Evolutionary Population Synthesis (YEPS) code (Park & Lee 1997; Lee, Yoon & Lee 2000; Lee et al. 2005; Yoon et al. 2006, 2008). We note that the models in the present study are the latest version of the YEPS model. The version has adopted a new set of HB evolutionary tracks that were built using the identical input physics and equations of state as the Yonsei-Yale () MS-RGB evolutionary tracks (Kim et al. 2002) and taking into account the -element enhancement effect. In Rey et al. (2005, 2007) and Kaviraj et al. (2007), the YEPS models were used to investigate the integrated light of GCs in M31 based on the GALEX UV data, and in the Virgo cluster (M87) based on HST/STIS UV data, respectively. In Lee et al. (2005) the properties of resolved stellar populations in Cen and NGC 2808 were analysed using the YEPS models (see also Rey et al. 2001, 2004; and Yoon & Lee 2002 for an application to resolved stellar populations in “normal” GCs).
Fig. 3 shows that massive Fornax GCs with mag indeed exhibit a UV-excess with respect to the SSP model predictions. There is no combination of age and metallicity which can reproduce these very blue NUV colours at the given (V-I). Not even isochrones with an enhanced He abundance (Y=0.34 instead of the canonical value Y=0.23) can account for them. The UCD data points are more consistent with the model tracks for old ages around 12-14 Gyrs. There is a slight UV excess for the optically red UCDs, which can be explained by He enhanced isochrones of old ages.
We now assess whether detecting some massive Fornax GCs with UV excess indicates that Fornax GCs as a sample have a higher probability for a UV excess than our comparison sample, the M31 GCs. The two samples are almost disjunct in luminosity (see Fig. 2). We focus on (NUV-V)2.7 mag, which is the blue limit of the sample of 87 M31 GCs with NUV detection (Fig. 3), and also corresponds to the blue limit of the UCD colours. Out of a total of 173 massive GCs with mag in the GALEX FoV, only 7 (41.5%) have (NUV-V)2.7 mag. A Poisson test shows that drawing 0 out of 87 at an underlying assumed probability of occurs in 3% of random samplings. We can therefore state that massive Fornax GCs extend to higher NUV fluxes than M31 GCs at the 97% confidence level. Note that also none of the 29 UCDs in the GALEX FoV has (NUV-V)2.7 mag. However, this non-detection is not statistically significant when assuming an underlying probability of for a NUV excess as deduced from the massive GCs.
In the (FUV-V) vs. (V-I) colour-colour diagram of Fig. 3, a much better age resolution is achieved, but the number of GALEX detections drops to 21, as does the number of M31 GCs (49 instead of 87 for NUV). In this diagram, a UV excess for the 2-3 most metal-rich Fornax UCDs is confirmed, similar to the metal-rich M87 GCs. Those UCDs show colours best matched with He-enhanced isochrones of old ages 12-14 Gyrs. Due to the brighter sensitivity limit of the FUV data, only seven massive GCs enter the sample, of which three have UV excess marginally incompatible with He-enhanced isochrones. Given the bias towards detecting UV bright sources, and the brighter sensitivity limit in the FUV than in the NUV, we do not find statistically significant evidence for a different (FUV-V) distribution between Fornax UCDs and massive GCs or M31 GCs.
The (FUV-NUV) colour-colour diagrams in Fig. 3, especially the diagram (FUV-NUV) vs. (NUV-V), allow the best discrimination into objects consistent and inconsistent with standard He abundance isochrones. Here, Fornax UCDs with 0.5 mag show UV colours consistent with enhanced He abundance that cannot be explained by standard He isochrones of 14 Gyrs. They also show that at a given colour (V-I) or (NUV-V), UCDs are bluer in (FUV-NUV) than our comparison sample of M31 GCs. This is the strongest evidence in our data for UCDs as a class harbouring stellar populations with UV excess. Again, we cannot judge on a difference between UCDs and massive Fornax GCs due to the brighter sensitivity limit in the FUV, which excludes most of the GCs detected in the NUV.
4 Discussion and conclusion
A UV excess in an old stellar population is likely due to EHB stars. As pointed out in Sect. 1, an EHB may be linked to helium-enriched stars (e.g. Ventura et al. 2001, D’Antona et al. 2002). The strong UV excess of the seven massive Fornax GCs beyond the He-enhanced isochrones, especially the NUV excess of the three most extreme GCs with (NUV-V)2.4 mag (see Fig. 3), suggests that in these objects, EHB formation is also driven by other processes. In this context, a plausible explanation may be enhanced mass loss of evolved stars, triggered by high stellar densities (Decressin et al. 2007; Huang & Gies 2006) and/or large binary fractions.
Excess radiation at short wavelengths can in principle also arise from accretion onto a black hole (King et al. 1993), which can be traced by low-mass X-ray binaries (Jordán et al. 2004). We have cross-checked the positions of all GALEX UV detections with X-ray source detections in the Chandra Fornax Survey data (Scharf et al. 2005 and private communication), the deepest available wide-field X-ray survey of Fornax (50ks integration with ACIS). The sensitivity of these images is a few erg/sec, allowing to detect the most luminous LMXBs (Jordán et al. 2004). In Fig. 1 (right panel) we indicate the (V-I) optical colours of those compact objects with X-ray matches. At a given magnitude, the X-ray matches in GCs are biased towards red optical colours (see also Jordán et al. 2004), while GALEX UV detections are biased towards blue optical colours. This suggests that generally, the UV- and X-ray-emission of the compact stellar systems are not caused by the same physical processes. However, there is one GALEX UV detection with an X-ray counterpart (Fig. 1 and 3), which happens to be one of the three GCs with largest UV excess. We can therefore not exclude that the UV excess in some of the GCs is linked to accretion processes.
We finally note that comparing the probability of UV excess between UCDs and GCs allows to test whether EHBs are more likely associated with present-day deep potential wells (i.e. UCDs) or high stellar densities (i.e. GCs; Dabringhausen et al. 2008, Mieske et al. 2008). One would expect deep potential wells to favour self-enrichment (e.g. Ventura et al. 2001, D’Antona et al. 2002), and high stellar densities to favour mass-loss scenarios (Decressin et al. 2007; Huang & Gies 2006). Such a comparison may therefore help to constrain the efficiency of EHB formation channels, provided that the present-day density and mass of the systems investigated have not experienced significant changes during the past, which could have been the case due to core collapse (Noyola & Gebhardt 2006, de Marchi et al. 2007) or tidal stripping (e.g. Lee et al. 2007). To properly perform this comparison, deeper UV imaging data will be required that allow detection of UV intermediate-bright to faint GCs down to 10 mag ( mag at the Fornax distance). In this respect, the outcomes of the HST observations in Cycle 15 (GO10901, PI O’Connell) of GCs belonging to NGC 1399 are highly anticipated.
Acknowledgements.
We are grateful to Caleb Scharf for providing us with the source catalog of the Chandra Fornax survey. The work of S.-C. R. was supported in part by KOSEF through the Astrophysical Research Center for the Structure and Evolution of the Cosmos (ARCSEC). S.-J. Y. acknowledges support from the Basic Research Program (grant No. R01-2006-000-10716-0) and from the Korea Research Foundation Grant funded by the Korean Government (grant No. KRF-2006-331-C00134).References
- (1) Bedin, L. R., Piotto, G., Anderson, J., Cassisi, S., King, I. R., Momany, Y. & Carraro, G. 2004, ApJ, 605, 125L
- (2) Bergond, G. et al. 2007, A&A, 464, 21L
- (3) Brown, T. M., Sweigart, A. V., Lanz, T., Landsman, W. B., Hubeny, I. 2001, ApJ, 562, 368
- (4) Castellani, M. & Castellani, V. 1993, ApJ, 407, 649
- (5) Dabringhausen, J., Hilker, M. & Kroupa, P. 2008, MNRAS, 386, 864
- (6) D’Antona, F., Caloi, V., Montalban, J., Ventura, P., & Gratton, R. 2002, A&A, 395, 69
- (7) D’Antona, F., Bellazzini, M., Caloi, V., Pecci, F. Fusi, Galleti, S., & Rood, R. T. 2005, ApJ, 631, 868
- (8) Decressin, T., Meynet, G., Charbonnel, C., Prantzos, N., & Ekstrom, S 2007, A&A, 464, 1029
- (9) D’Cruz, N. L., Dorman, B., Rood, R. T., O’Connell, R. W. 1996, ApJ, 466, 359
- (10) Dieball, A., Knigge, C., Zurek, D. R., Shara, M. M., Long, K. S., Charles, P. A., & Hannikainen, D. 2007, ApJ, 670, 379
- (11) Dieball, A., Knigge, C., Zurek, D. R., Shara, M. M., Long, K. S., Charles, P. A., Hannikainen, D. & van Zyl, L. 2005, ApJ, 634, 105
- (12) Dirsch, B. et al. 2004, AJ, 127, 2114
- (13) Drinkwater, M. J. et al. 2003, Nature, 423, 519
- (14) Evstigneeva, E. A. et al. 2008, AJ in press, arXiv:0804.4353
- (15) Firth, P., Drinkwater, M. J., Evstigneeva, E. A., Gregg, M. D., Karick, A. M., Jones, J. B., & Phillipps, S. 2007, MNRAS, 382, 1342
- (16) Freedman, W. L., Madore, B. F., Gibson, B. K., et al. 2001, ApJ, 553, 47
- (17) Gratton, R., Sneden, C., & Carretta, E. 2004, ARA&A, 42, 385
- (18) Haşegan, M., Jordán, A., Côté, P. et al. 2005, ApJ, 627, 203
- (19) Huang, W., & Gies, D. R. 2006, ApJ, 648, 591
- (20) Jordán, A. et al. 2004, ApJ, 613, 279
- (21) Kim, Y.-C., Demarque, P., Yi, S. K., & Alexander, D. R. 2002, ApJS, 143, 499
- (22) King, I.R. et al. 1993, ApJ, 413L, 117
- (23) Kissler-Patig, M, Grillmair, C. J., Meylan, G., Brodie, J. P., Minniti, D. & Goudfrooij, P. 1999, AJ, 117, 1206
- (24) Kaviraj, S., Sohn, S. T., O’Connell, R. W., Yoon, S.-J., Lee, Y. W., & Yi, S. K. 2007, MNRAS, 377, 987
- (25) Lee, H.-C., Yoon, S.-J., & Lee, Y.-W. 2000, AJ, 120, 998
- (26) Lee, Y.-W. et al. 2005, ApJ, 621, 57L
- (27) Lee, Y.-W., Gim, H. B. & Casetti-Dinescu, D.I. 2007, ApJ, 661, L49
- (28) de Marchi, G., Paresce, F., & Pulone, L. 2007, ApJ, 656L, 65
- (29) Mieske, S., Hilker, M., Infante, L., 2002, A&A, 383, 832
- (30) Mieske, S., Hilker, M., Infante, L. 2004, A&A, 418, 445
- (31) Mieske, S., Hilker, M., Infante, L., & Jordán, A. 2006, AJ, 131, 2442
- (32) Mieske, S., Hilker, M., Infante, L., & Mendes de Oliveira, C. 2007, A&A, 463, 503
- (33) Mieske, S., et al. 2008, A&A accepted, arXiv:0806.0374
- (34) Milone, A.P. et al. 2008, ApJ, 673, 241
- (35) Moehler, S. et al. 2007, A&A, 475, 5L
- (36) Noyola, E. & Gebhardt, K. 2006, AJ, 132, 447
- (37) Park, J.-H, & Lee, Y.-W. 1997, ApJ, 476, 28
- (38) Piotto, G. et al. 2007, ApJ, 661, 53L
- (39) Rey, S.-C., Yoon, S.-J. Lee, Y.-W., Chaboyer, B., & Sarajedini, A. 2001, AJ, 122, 3219
- (40) Rey, S.-C., Lee, Y.-W., Ree, C.H. Joo, J.-M., Sohn, Y.-J., & Walker, A. R. 2004, AJ, 127, 958
- (41) Rey et al. 2005, ApJ, 619, L119
- (42) Rey, S.-C. et al. 2007, ApJS, 173, 643
- (43) Richtler, T., Schubert, Y., Hilker, M., Dirsch, B., Bassino, L. & Romanowsky, A. J. 2008, A&A, 478, 23L
- (44) Scharf, C.A., Zurek, D.R., & Bureau, M. 2005, ApJ, 633, 154
- (45) Sohn, S. T. et al. 2006, AJ, 131, 866
- (46) Ventura, P., D’Antona, F., Mazzitelli, I., & Gratton, R. 2001, ApJ, 550, 65L
- (47) Yoon, S.-J., Yi, S. K., & Lee, Y.-W. 2006, Science, 311, 1129
- (48) Yoon, S.-J, et al. 2008, ApJ, 677, 1080