The Local Environment of the FUor-like Objects AR 6A and 6B
Abstract
We present new 12CO J=3-2 and HCN J=3-2 molecular line maps of the region surrounding the young star AR 6 using the 15 metre James Clerk Maxwell Telescope. AR 6 was previously found to be a double source with both components exhibiting several characteristics of FU Orionis (FUor) eruptive variable stars. The aims of this investigation were to determine if the AR 6 sources are associated with molecular outflows and if a significant reservoir of natal molecular gas and dust exists around the stars. These observations form part of a large-scale study of the outflow and circumstellar environment characteristics of FUors and FUor-like objects to place constrains on the age and evolutionary state of sources exhibiting FUor-like tendencies. Our data indicates that AR 6, like FU Orionis itself, does not possess a CO outflow and likewise, does not show evidence for large amounts of molecular gas in its circumstellar environment. In fact, AR 6 seems to lie in a local minimum of HCN emission. This is also found in 850 m dust emission seen in JCMT archival data. We conclude that from the near-IR to the sub-mm, AR 6 is similar to FU Orionis in several respects. We interpret the lack of significant dust and molecular gas in the circumstellar environment of AR 6, together with the large near-IR thermal excess, as evidence that the sources have exhausted their natal envelopes, that they have at least small hot circumstellar disks, and that they are more evolved than Class I protostars. This, in itself, suggests that, since FUor eruptions have also been observed in stars with large dust mass envelopes (e.g. V346 Nor) and with CO outflows (e.g. L1551 IRS5), FUor events probably occur at many different stages in the early, formative phase of a star’s life, and lends support to the idea that FUor outbursts are repetitive like their shorter-lived relatives occurring in EXor eruptive variables.
Finally, we study the stellar environment around AR 6 using 2MASS, Spitzer IRAC, and Chandra ACIS images and show that, being part of the ‘Spokes’ young stellar cluster, AR 6 is unlike many FUors which typically are located in more sparsely populated regions.
1 INTRODUCTION
FUors, named after their prototype FU Orionis, are young, low-mass protostars undergoing massive (up to 100 fold), temporary (over periods of decades to centuries) increases in accretion producing rates as large as M⊙ yr-1 (Hartmann & Kenyon 1985). During these outbursts, FUors experience a brightening of up to 6 magnitudes over a few months, followed by a much slower fading back to their original luminosity. For example, V1057 Cygni returned to its pre-outburst state some 35 years after its eruption, while FU Orionis itself has barely declined in brightness in the 70+ years since its discovery. Herbig (1966, 1977) was the first researcher to recognized FUors as young low-mass eruptive variable stars.
Very few FUors have been observed through their outburst phase. The few that have are termed ‘classical’ FUors and only about ten such objects are currently known. In addition to the dramatic rise in optical brightness, typical characteristics of FUors include an optical spectrum resembling F- or G-type supergiant stars (Herbig 1977), near-infrared (henceforth NIR) spectra similar to cooler K- or M-type giant stars (Mould et al. 1978), and an association with bright, often curving reflection nebulae (Goodrich 1987). Many, but not all, possess thermal infrared excess emission and strong sub-mm continuum flux indicative of the presence of massive circumstellar disks and dense, dusty envelopes (Sandell & Weintraub 2001). Some FUors, for example L1551-IRS5, possess significant wide-angle molecular outflows and collimated Herbig-Haro (HH) jets. Such properties would suggest that FUor events occur during the very early formative stages of a protostar. However, other FUors, for example FU Orionis itself, possess no detectable CO outflow, no obvious HH flow, and little thermal excess and sub-mm continuum emission. This perhaps suggests that such FUors are older and that FUor events are repetitive in nature occurring throughout the first few million years of a star’s life. Some FUors have been found to be close multiple stars. FU Orionis has a faint, close companion 05 to the south (Wang et al. 2004; Reipurth & Aspin 2004). Another example is is RNO 1 where the components 1B and 1C are separated by 6′′ and both show FUor characteristics (Staude & Neckel 1991; Kenyon et al. 1993). This has led some authors to suggest that FUor eruptions are somehow related to the presence of a close companion star, a scenario first proposed by Bonnell & Bastien (1992) and Clarke & Syer (1996).
It is clear, from the numbers of ‘classical’ FUors found so far, that they are quite rare events, making the discovery of new candidate FUors clearly paramount in the study of these early stages of star formation. New candidate FUors, termed FUor-like objects (Reipurth & Aspin 1997), have been recently found, such as PP 13S (Sandell & Aspin 1998; Aspin & Sandell 2001), V733 Cep (Persson’s Star; Reipurth et al. 2007), and the Braid Nebula Star (Movsessian et al. 2006). The term FUor-like objects is used to describe young stars that exhibit many of the unique characteristics of ‘classical’ FUors but which were not observed during their eruptive (and definitive) stage. For brevity we henceforth refer to both bona fide classical FUors and FUor-like objects using the generic term FUor. Recently, Aspin & Reipurth (2003, henceforth AR2003) discovered a close double star system (separation 28) in which both components exhibited several FUor characteristics. The two stars were designated AR 6A and 6B, and they are located near the Cone Nebula in Monoceros, within a cluster of optical and infrared stars (Herbig 1954; AR2003). (For convenience, we will refer in this paper to the binary as AR 6.) The NGC 2264 complex, of which the Cone Nebula is a part, is an extremely active region of star formation (e.g., Lada, Young, & Greene 1993; Reipurth et al. 2004) and is located at a distance of about 800 pc (Walker 1956).
The goal of this investigation is to estimate the approximate evolutionary stage of the AR 6 FUor candidates. A very young protostar should still possess a large dusty envelope (Sandell & Weintraub 2001) and/or a molecular outflow. We therefore used the JCMT to map the region surrounding AR 6 in 12CO J=3-2 emission, to look for outflow activity, and in HCN J=3-2 emission, to search for dense gas from a circumstellar core/envelope. In addition, we utilize a JCMT archival SCUBA 850 m map of the region, first published by Wolf-Chase et al. (2003) to trace dust emission structure near AR 6.
2 OBSERVATIONS AND DATA REDUCTION
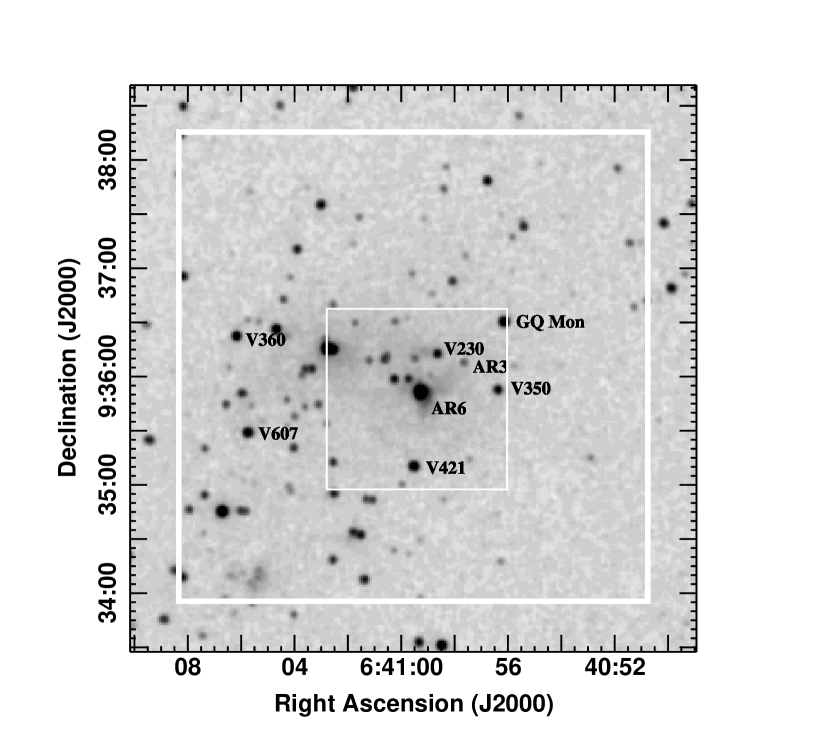
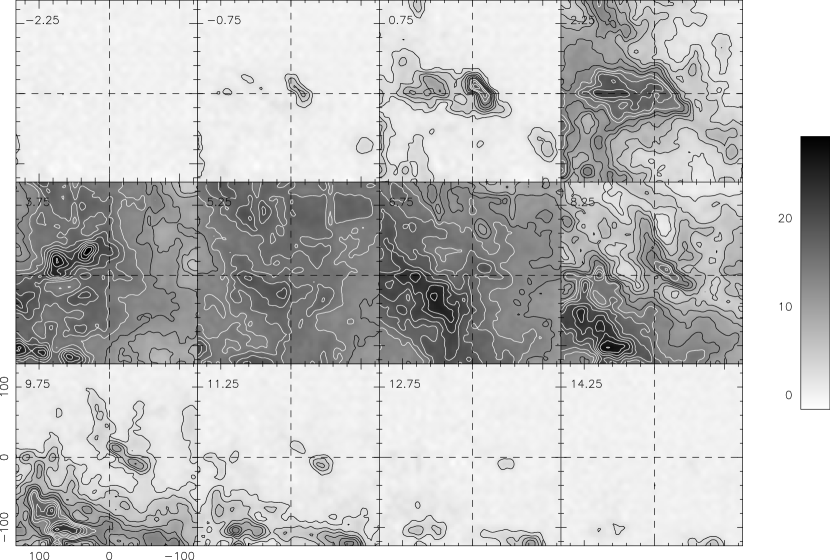
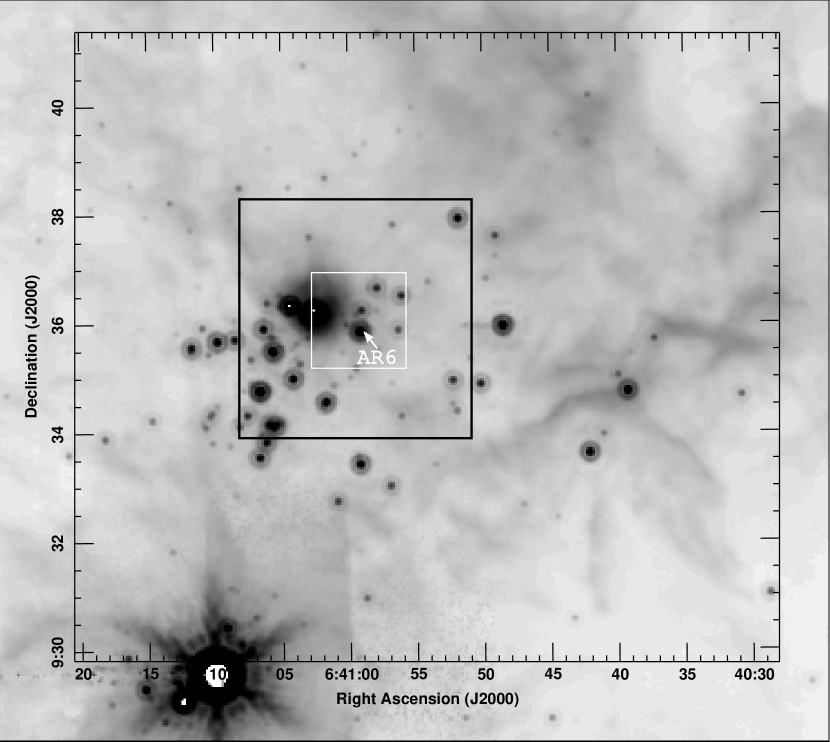
All data were obtained using the James Clerk Maxwell Telescope (JCMT) on Mauna Kea, Hawaii. 12CO J=3-2 (345 GHz) data were obtained using RxB3, a dual polarization, single “pixel”, single sideband heterodyne SIS receiver operating between 315–373 GHz, during the nights of UT 16 November, 5 December 2003, 19–20 August 2004, and 22 December 2004. An approximately 4.5’4.5’ region was observed by raster mapping with a 7”7” cell size, integrating for 13 seconds per point. (See Fig. 1 for the 2MASS111The Two Micron All Sky Survey (2MASS) is a joint project of the University of Massachusetts and the Infrared Processing and Analysis Center/California Institute of Technology, funded by the National Aeronautics and Space Administration and the National Science Foundation. K-band image of the region showing the extents of the maps.) Pointing was checked approximately every two hours, and was found to vary by less than 2”. The focus was checked once or twice per night. An RMS of 0.4 K per channel was achieved after smoothing to 1 km s-1. The CO 3-2 channel map is presented in Fig. 2 and AR 6 is located at its origin.
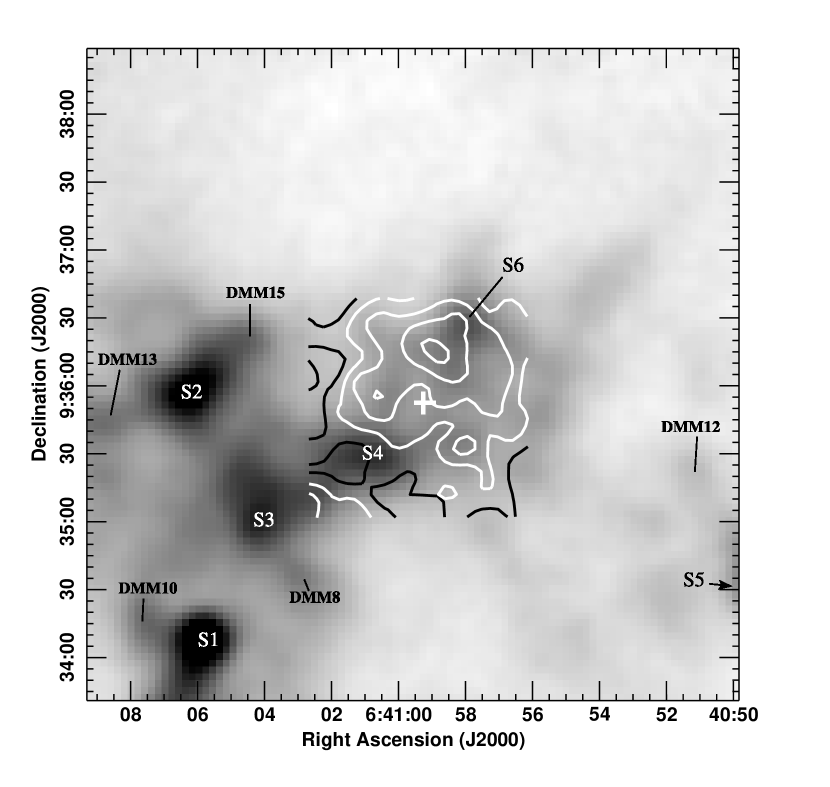
The HCN J=3-2 (266 GHz) data were obtained UT 7 March 2007 using RxA3, a single pixel, single polarization, dual sideband SIS receiver. A 1.5’1.5’ region was grid-mapped with 10”10” cells. We integrated 2 minutes per point (frequency-switching), achieving an RMS of 0.18 K per 0.26 km s-1 channel. Fig. 3 shows a contour map of the integrated intensity of HCN emission over the velocity interval 4–6 km s-1. The greyscale image shows the 850 m dust emission in the vicinity of AR 6, mapped using the SCUBA bolometer array (Holland et al. 1999) in UT August and November 1999, and October 2000. These data were first published by Wolf-Chase et al. (2003). Data reduction and analysis are described in that paper.
3 RESULTS
3.1 The Local Environment Around AR 6
In Fig. 1 we show the K-band 2MASS image of the region containing AR 6. All young variable stars and AR 6 are labeled. As can be seen, AR 6 seems to be associated with a small cluster of stars, some optically visible (e.g. V230 Mon, GQ Mon, see Fig. 2 of AR2003) and others bright only in the infrared. It is not possible to determine the full extent of this cluster from the 2MASS images but it probably has many members. We return to the matter of the extent of this cluster in Section 3.2 below.
Fig. 3 shows the 850 m continuum map of Wolf-Chase et al. (2003) overlaid with contours showing the HCN line emission in the 1.5’1.5’ survey region centered on AR 6. In their paper, Wolf-Chase et al. (2003) labeled several sub-mm clumps S1–S6. Recently, Peretto, André & Belloche (2006) presented a map of 1.2mm continuum emission from the same region obtained using the IRAM 30m telescope, which has a similar angular resolution to the JCMT at those wavelengths. Their map shows a very similar morphology to the Wolf-Chase et al. image. In addition, Peretto, André & Belloche (2006) used a wavelet analysis to extract several new compact sources, which are indicated on Fig. 3 as sources DMM8 - DMM15.
We note that 850 m and 1.2mm continuum trace optically thin dust emission (and hence measure the column density of material through the cloud) while HCN J=3-2 observations are most sensitive to molecular gas at densities cm-3. From Fig, 3 we see that the HCN emission traces the S6 continuum peak reasonable well, although the S4 clump is not detected in HCN. In the direction of AR 6 (white cross), both the HCN and 850 m/1.2mm emission are at a local minimum, and none of Peretto, André & Belloche’s (2006) compact sources lies closer to AR 6 than 38”. At this local minimum, the intensity of 850 m emission is approximately 440 mJy beam-1 while the HCN flux is slightly less than 2 K km s-1. The HCN flux appears to peak at three locations surrounding AR 6 with a maximum flux of 3 K km s-1. Our conclusion therefore, is that the circumstellar dust/gas envelope mass around AR 6 is relatively small.
Although the dust emission exhibits a local minimum toward AR 6, there is some line-of-sight 850 m emission toward AR 6 as noted above. Assuming the emission is optically thin, we can estimate the gas mass in this line-of-sight direction from
| (1) |
where is the flux, is the distance, is the dust temperature, and is the mass absorption coefficient. The value of the absorption coefficient at was taken to be cm2 g-1, and we assume a gas-to-dust mass ratio of 100. The value of depends sensitively on the properties of the dust grains (see Henning, Michel, & Stognienko 1995 for a review). Taking the distance to AR 6 to be 800pc, the flux within a radius of a few arcseconds of AR 6, , measured in Janskys, is converted to mass assuming a dust temperature , via
| (2) |
Derived masses are very sensitive to the dust temperature. Wolf-Chase et al. (2003), using data from 12 m through 850 m, derived a dust temperature of 23K for source S1 (Fig. 3), which Teixeira, Zapata & Lada (2007) identified as a dense cluster of Class 0 protostars. Ward-Thompson et al. (2000) used 1300 through 350 m data to derive dust temperatures of 15K for nearby sub-millimetre sources. A dust temperature of 23K yeilds , while 15K yields . Although this is a significant amount of material, the local minimum in both dust and gas implies that it is likely not associated with the envelopes/disks around the AR 6 sources and not available as an accretion reservoir. Higher resolution interferometric observations will be required to determine the extend and dust/gas content of their envelopes and circumstellar (binary) disks.
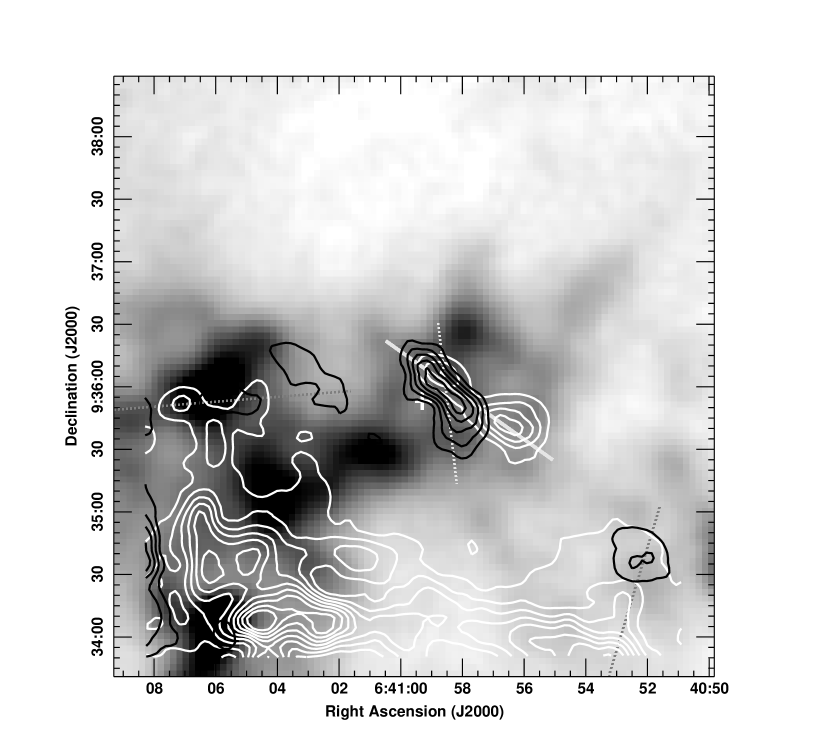
A plot of the 850 m dust emission, with contours of high-velocity red-shifted (white) and blue-shifted (black) CO emission superposed, is shown in Fig. 4. As with the HCN/850 m map, although high-velocity CO emission is found adjacent to AR 6 (Figs. 2 and 4), in the line-of-sight toward AR 6, the high-velocity CO emission appears to be at a local minimum.
The most prominent high-velocity features in the vicinity of AR 6 are a red-shifted lobe centered about 45” WSW of AR 6, and centered at 9h40m56.5s and +9∘35’42”. This lobe has a velocity range 6 km s-1 from the ambient cloud velocity (Fig. 2), and is 45” in extent. It appears to be associated with an extended blue-shifted lobe, 1’ in extent, centered approximately at 9h40m58.6s and +9∘35’58”, with velocity range 6 km s-1 from the ambient cloud velocity. This morphology suggests a somewhat linear outflow, oriented through the primary red lobe and the extended blue lobe, with a position angle of about +65∘ (Fig. 4 solid grey line). The origin of this outflow most likely lies in the overlap region of the main red- and blue-shifted lobes, i.e. within about a 10-15” radius of 6h40m57.7s +9∘35’52”. No compact 1.2mm or 850m are found within this radius (Peretto, André & Belloche 2006; Wolf-Chase et al. 2003; see Fig. 3). The closest 2MASS source is 16” north of the putative site of the outflow origin. AR 6 is 24” east of this position. Neither of these sources is likely to be the origin of this outflow.
The red-shifted clump centered at 6h40m58.7s +9∘36’07” is coincident with the blue lobe discussed above, and could be part of the same outflow, if that outflow is oriented close to the plane of the sky. Alternatively it may be part of another outflow, given the many young stars in this neighbourhood, whose blue-shifted emission is either very weak, or is blended with the outflow discussed above. The axis of this outflow would be nearly north-south (Fig. 4 dashed grey line). In this case, AR 6 lies much closer to the axis of this putative outflow, i.e. within about 10”. However, neither red- nor blue-shifted emission is seen toward AR 6, and so again AR 6 is unlikly to be the origin of this emission.
Two other apparent sources of high-velocity CO emission indicate potential outflows in this region (Figs. 2 and 4). Near the south edge of the mapped region is an apparent blue-shifted lobe, peaking at 6h40m52s +09∘34′49′′ (J2000). Red-shifted emission in this region is confused (Fig. 4), but in Fig. 2 some emission at velocities 12.5 km s-1is visible, peaking at the edge of the map, and implying an outflow position angle -19∘ (Fig. 4 dashed grey line). This emission may be associated with the 850 m “clump” (Fig. 4, unnamed in Wolf-Chase et al. (2003)) and has a peak intensity 250mJy beam-1. There are no nearby 2MASS sources (Fig. 1).
Much more confused is a mix of red- and blue-shifted emission (Figs. 2 and 4), with position angle 90∘ (Fig. 4 dashed grey line) and seemingly centered on the bright 850 m clump S2 (Wolf-Chase et al. 2003) or DMM13 (Peretto, André & Belloche 2006). Several infrared stars are found in this vicinity, the closest being V360 Mon.
Finally, we note that there was little to no high-velocity CO emission detected in the upper half of the map.
3.2 The Stellar Cluster
Fig. 5 shows the Spitzer MIPS 24 m image of the region containing AR 6. The extent of our CO and HCN maps are indicated by the black and white boxes, respectively. AR 6A and 6B are unresolved in the 24 m image. However, at all IRAC wavelengths, AR 6A and 6B are (barely) resolved but AR 6A dominates the flux from the pair. One thing that is clear from this image is that AR 6 is certainly a member of a young stellar cluster. Within 2’ of AR 6 are about 20 bright 24 m sources. This cluster was named the “Spokes” cluster by Teixeira et al. (2006) since many of the stars lie on radial arms extending away from the extremely bright thermal IR source IRAS 06382+0939 (also called NGC2264–IRAS 12 by Margulis et al. 1989). Teixeira et al. (2006) found IRAS 12 to be coincident with the young binary designated RNO-West and RNO-East by Castelaz & Grasdalen (1988). They determined that the two stars were a young B-star with a low-mass companion. This binary can be seen in Figs. 1 and 5 near the north-east corner of the (thin white) HCN mapping region box. It is in the latter figure that the Spoke-like structure of the cluster can be readily seen. Teixeira et al. interpreted this arrangement of young stars as evidence that star formation was occurring in dust filaments on a scale comparable to the Jeans length consistent with thermal fragmentation models for cloud collapse. We note that although AR 6 is located west-south-west of IRAS 12 and the spokes for young stars are to the east-south-east and south-south-east, its 24m brightness and distance from IRAS 12 is consistent with it being a member of the Spokes cluster.
In order to better judge the evolutionary state of AR 6 and to study the stellar environment immediately surrounding it, we have further analyzed the Spitzer IRAC and MIPS data of the region (NGC 2264, PID 58, PI:Rieke) and extracted photometry in all four IRAC bands and the MIPS 24 m band. This photometry, together with the corresponding values in the NIR (taken from AR2003) are shown in Table 1 together with the NIR and mid-IR colors. We have selected number of cluster members showing either optical H emission and/or variability, plus IRAS 12 for our environment study since these are known YSOs. Placing AR 6 in the vs. , the vs. , and the vs. color-color diagrams of Gutermuth et al. (2008, their Figs.8 and 9), we find that in all diagrams, AR 6 lies in within the area predominantly occupied by Class II/classical T Tauri stars (CTTS). We note also that FU Ori has similar IRAC colors to AR 6. Fig. 6 shows s vs. color-color diagram as a representative example of the ones mentioned above. All objects but one are Class II sources. The one exception is V607 Mon which lies at the bottom-right of the Class 0/I area. IRAS 12, the central hub of the Spokes cluster, has IRAC colors indicative of either a Class 0/I or Class II star. A Class I classification was adopted by Margulis et al. (1989).
To quantify the classification we have adopted the spectral index defined by Lada et al. (2006) where the slope of a linear least-squares fit defines the object class. Specifically, is the slope of the best-fit linear function to the spectral energy distribution between 3.6 and 8.0 m in log) vs. log) space. The derived values of for each source are shown in Table 1. For AR 6, and all but one star, 0.0 indicating, by the criteria defined by Lada et al. (2006), that the sources are of evolutionary Class II. The one source where 0.0 is V607 Mon which has a value of +0.34. This confirms that it is at an earlier stage of development and is a Class I source. AR 6 and FU Ori have very similar values of (-0.95 and -1.15, respectively).
Finally, we have examined the Chandra ACIS-I image of the region (NGC 2264, OBS_ID 2540, PI Sciortino, 100 kS) obtained from the Chandra data archive. All but one of the stars listed in Table 1 have Chandra detections including AR 6. The one exception is V350 Mon. X-ray emission is a well-known indicator of youth in star forming region and is generally assumed associated with magnetic reconnection events in the star–disk interface region (Feigelson & Montmerle 1999). Emission at X-ray energies have been detected in Class I (Broos et al. 2007 – M 17), Class II (Gagné, Skinner, & Daniel 2004 – Oph) and Class III (Getman et al. 2002 – NGC 1333) sources yet there is only a tentative detection of such emission from Class 0 protostars (for non-detections see for example Giardino et al. 2007 – Serpens. For the tentative detection see Teixeira et al. 2007 – SMA-1 in NGC 2264). Although X-ray emission can probe completely through molecular clouds and detect background sources such as AGNs, the preponderance of sources near IRAS 12 and AR 6 supports the existence of a young stellar cluster. We finally note that, with the spatial resolution of the ACIS-I images (1′′), AR 6A and 6B (separation 2.8′′) should be resolved. This is confirmed by the Chandra detection of both stellar components of the IRAS 12 binary (separation 2.8′′, Castalez & Grasdalen 1988). However, only AR 6A is detected (152 counts). It is not unexpected that AR 6A was detected since it is clearly a Class II CTTS. Two possible reasons for the non-detection of AR 6B are i) AR 6B is younger than AR 6A and X-ray emission has not yet switched-on. Such a scenario would argue against the two stars are a physical pair since they would then not be coeval, and ii) since AR 6B is fainter than AR 6A, perhaps it is less massive than AR 6A and hence its X-ray emission is below the detection threshold of the ACIS data. We note that the 1 ”sky” noise on the 100kS ACIS- I image is 0.3 counts. Taking a conservative detection limit of 5 counts, the X-ray emission from AR 6B is at least a factor 30 less than that from AR 6A.
4 DISCUSSION
It is clear, from the evidence presented above and in AR2003, that the AR 6 binary has much in common with the FUors and, in particular, with FU Ori itself. In particular,
-
•
AR 6 possesses curving reflection nebulosity (best seen in the HST NIC3 image – Fig. 3 of AR2003, but is also visible in Fig. 1) extending to the south from the west side of AR 6. FU Ori shows similar curving nebulosity, albeit in the optical rather than the NIR (AR 6 – AR2003; FU Ori – Goodrich 1987). We note that several FUors show such morphological structure in the NIR (e.g. PP 13S – Aspin & Sandell 2001, V733 Cep – Reipurth et al. 2007).
-
•
AR 6 is a close multiple system as is FU Ori (AR 6 is possibly a triple – AR2003; FU Ori is a binary – Wang et al. 2004, Reipurth & Aspin 2004). In addition to FU Ori and AR 6, L1551 IRS5 (Looney, Mundy, & Welch 1997), RNO 1B/C (Kenyon et al. 1993), Z CMa (Leinert & Haas 1987), and V1735 Cyg (Sandell & Weintraub 2001) have all been found to have close companions. Bonnell & Bastien (1992) suggested a link between multiplicity and FUor outbursts which was also supported by Reipurth (1989).
-
•
The NIR K-band spectra of both components of AR 6 and FU Ori show deep NIR CO overtone absorption bands and, at most, very weak atomic absorption features. This is a well-known characteristics of FUors and suggests that the NIR continuum and CO overtone bandhead absorption are formed in the disk and not in the star (AR 6 – AR2003; FU Ori – Reipurth & Aspin 1997). A comparison of the relative strengths of the 2 m CO overtone bandhead and atomic absorption features suggests that FUors are dominated in the NIR by absorption created in a giant- to supergiant-like atmosphere (cf. Fig. 10 from AR2003). FU Ori shows an F–G III spectrum in the optical, however, no optical spectrum of AR 6 currently exists.
-
•
AR 6 has little dust emission at sub-mm/mm wavelengths and is therefore similar to FU Ori (AR 6 – AR2003 and this paper; FU Ori – Sandell & Weintraub 2001). In the far-IR, however, AR 6 does not have an IRAS association while FU Ori is coincident with IRAS 05426+0903 (with fluxes of 6, 14, 14, 26 Jy at 12, 25, 60, and 100 m, respectively). As we have seen above, AR 6 was detected by IRAC and MIPS and has a 24 m brightness of 1.33 Jy. As for other FUors, Sandell & Weintraub (2001) found strong and extended sub-mm/mm emission from many of the FUors observed. Only one FUor was not detected (BBW76). FU Ori itself was an weak detection (60 mJy beam-1 at 850 m) and was unresolved in their data. The derived dust/gas mass around FU Ori, from isothermal model fits, was 0.02 M⊙, 5 smaller than the next lowest value of 0.1 M⊙. The other classical FUors in the Sandell & Weintraub (2001) survey (e.g. V1057 Cyg, V1515 Cyg, V1735 Cyg) had derived disk masses between 0.1 and 0.4 M⊙. Unfortunately, since AR 6 does not exhibit a distinct sub-mm emission peak, we cannot provide an estimate of circumstellar dust mass from a similar isothermal fit.
-
•
AR 6, like FU Ori, has no obvious molecular outflow (AR 6 – this paper; FU Ori – Bally & Lada 1983; Evans et al. 1994) and appears to lie at a local minimum in CO intensity. FU Ori was also observed to be at a local minimum in the CO map of Lada & Black (1976). It is interesting to note however, that Evans et al. (1994) detected molecular outflows (using the 12CO J=3-2 line) from six of eight FUors: specifically, RNO 1B, Z CMa, V346 Nor, V1735 Cyg, V1515 Cyg, and V1057 Cyg. In addition to FU Ori, BBW 76 was the other source in which an outflow was not found.
-
•
The 2 m spectrum of AR 6A shows relatively strong Br absorption (AR2003). AR 6B shows no evidence of a Br feature either in absorption or emission. Several FUors show weak Br absorption e.g. FU Ori, V1057 Cyg, V883 Ori, and L1551 IRS5 (Aspin, Greene, & Reipurth 2008). In such objects, Br absorption is likely created in either dense stellar winds or in infalling material depending on whether it is blue- or red-shifted (see Najita, Carr, & Tokunaga 1996 and Muzerolle, Hartmann, & Calvet 1998; for further discussions and examples of Br line profiles in CTTS). In the optical, FUors often show P Cygni H profiles with the blue-shifted absorption arising in stellar winds. Since we have no velocity information on the absorption, all we can say is that both AR 6A and some FUors (including FU Ori) show Br absorption and not emission as one might expect for a heavily accreting young star.
-
•
The NIR colors of AR 6A are similar to those of FU Ori except that AR 6A is more heavily reddened. The similarity of colors can be seen in both the J-H vs. H-K and J-H vs. K-L color-color diagrams shown in AR2003. Both AR 6A and FU Ori show little to no K-band thermal excess in the J-H vs. H-K diagram yet both show a significant thermal excess at L. AR 6B has an enormous thermal excess at both K and L suggesting that the circumstellar disk probably extends closer to the stellar photosphere than in AR 6A. From the Spitzer IRAC data, AR 6 and FU Ori have relatively similar colors and (within the associated uncertainties) identical spectral indices, . This is also true for their colors (4.03 and 3.98, respectively). All this suggests that, once reddening is removed, AR 6 and FU Ori have very similar intrinsic colors from 1 through to 24 m.
We note that the new results presented here elucidate several of the points of commonality between AR 6 and FU Ori. Specifically, the lack of strong sub-mm dust and gas emission in the immediate vicinity of the source, and the lack of active molecular outflows.
Our main conclusion from the above discussion, therefore, is that AR 6 and FU Ori have many photometric and spectroscopic characteristics in common and are probably in a similar evolutionary phase. They can both be classed as Class II objects, and their lack of strong sub-mm flux indicates that their circumstellar envelopes and disks are relatively depleted. They have likely evolved past the stage of driving molecular outflows and HH jets (assuming they did at some stage) and are perhaps within a few million years of the zero-age main sequence. Much of this is contrary to observations of other FUors which possess large circumstellar dust masses, drive wide-angle outflows and collimates jets, and are Class I in nature. The implication, therefore, is that FUor eruptions can occur during any phase of early stellar evolution which, in itself, hints at a repetitive nature to these violent and definitive events.
References
- Allen et al. (2004) Allen, L. E., Calvet, N., D’Alessio, P., Merin, B., Hartmann, L., Megeath, S. T., Gutermuth, R. A., Muzerolle, J., Pipher, J. L., Myers, P. C., & Fazio, G. G. 2004, ApJS, 154, 363
- Aspin, Greene, & Reipurth (2008) Aspin, C., Greene, T. P., & Reipurth, B. 2008, ApJ, in press
- Aspin & Reipurth (2003) Aspin, C., & Reipurth, B. 2003, AJ, 126, 2936 (AR2003)
- Aspin & Sandell (2001) Aspin, C. & Sandell, G. 2001, MNRAS, 382, 751
- Bally & Lada (1983) Bally, J., & Lada, C. J. 1983, ApJ, 265, 824
- Bonnell & Bastien (1992) Bonnell, I., & Bastien, P. 1992, ApJ, 401, L31
- Broos et al. (2007) Broos, P. S., Feigelson, E. D., Townsley, L. K., Getman, K. V., Wang, J., Garmire, G. P., Jiang, Z., & Tsuboi, Y. 2007, ApJS, 169, 353
- Castelaz & Grasdalen (1988) Castelaz, M. W., & Grasdalen, G. 1988, ApJ, 335, 150
- Clarke & Syer (1996) Clarke, C. J., & Syer, D. 1996, MNRAS, 278, L23
- D’Alessio et al. (2005) D’Alessio, P., Mer n, B., Calvet, N., Hartmann, L., & Montesinos, B. 2005, RevMexAA, 41, 61
- Evans et al. (1994) Evans, N.J., II, Balkum, S., Levreault, R.M., Hartmann, L., & Kenyon, S. 1994, ApJ, 424, 793
- Feigelson & Montmerle (1999) Feigelson, E. D., & Montmerle, T. 1999, ARA&A, 37, 363
- Gagné, Skinner, & Daniel (2004) Gagné, M., Skinner, S. L., & Daniel, K. J. 2004, ApJ, 613, 393
- Getman et al. (2002) Getman, K. V., Feigelson, E. D., Townsley, L., Bally, J., Lada, C. J., & Reipurth, B. 2002, ApJ, 575, 354
- Giardino et al. (2007) Giardino, G., Favata, F., Micela, G., Sciortino, S., & Winston, E. 2007, A&A, 463, 275
- Goodrich (1987) Goodrich R.W. 1987. PASP99, 116
- Gutermuth et al. (2008) Gutermuth, R. A., Myers, P. C., Megeath, S. T., Allen, L. E., Pipher, J. L., Muzerolle, J., Porras, A., Winston, E., & Fazio, G. 2008, ApJ, 674, 336
- Hartmann & Kenyon (1985) Hartmann, L. & Kenyon, S.J. 1985, ApJ, 299, 462
- Hartmann et al. (2005) Hartmann, L., Megeath, S. T., Allen, L., Luhman, K., Calvet, N., D’Alessio, P., Franco-Hernandez, R., & Fazio, G. 2005, ApJ, 629, 881
- Henning, Michel & Stognienko (1995) Henning, T., Michel, B., & Stognienko, R. 1995, Planetary Space Sci., 43, 1333
- Herbig (1954) Herbig, G. H. 1954, ApJ, 119, 483
- Herbig (1966) Herbig, G.H.. 1966, Vistas Astron., 8, 109
- Herbig (1977) Herbig, G.H. 1977, ApJ, 217, 693
- Holland et al. (1999) Holland, W. S., Robson, E. I., Gear, W. K., Cunningham, C. R., Lightfoot, J. F., Jenness, T., Ivison, R. J., Stevens, J. A., Ade, P. A. R., Griffin, M. J., Duncan, W. D., Murphy, J. A., & Naylor, D. A. 1999, MNRAS, 303, 659
- Kenyon et al. (1993) Kenyon, S. J., Hartmann, L., Gomez, M., Carr, J. S., & Tokunaga, A. 1993, AJ, 105, 1505
- Lada & Black (1976) Lada, C. J., & Black, J. H. 1976, ApJ, 203, L75
- Lada, Young, & Greene (1993) Lada, C. J., Young, E. T., & Greene, T. P. 1993, ApJ, 408, 471
- Lada et al. (2006) Lada, C. J., Muench, A. A., Luhman, K. L., Allen, L., Hartmann, L., Megeath, T., Myers, P., Fazio, G., Wood, K., Muzerolle, J., Rieke, G., Siegler, N., & Young, E. 2006, AJ, 131, 1574
- Leinert & Haas (1987) Leinert, C., & Haas, M. 1987, A&A, 182, L47
- Looney, Mundy, & Welch (1997) Looney, L. W., Mundy, L. G., & Welch, W. J. 1997, ApJ, 484, L157
- Margulis et al. (1989) Margulis, M., Lada, C. J., & Young, E. T. 1989, ApJ, 345, 906
- Mathis (1990) Mathis, J. S. 1990, ARA&A, 28, 37
- Mould et al. (1978) Mould, J.R., Hall, D.N.B., Ridgway, S.T., Hintzen, P., & Aaronson, M. 1978, ApJ, 222, L123
- Movsessian et al. (2006) Movsessian, T. A., Khanzadyan, T., Aspin, C., Magakian, T. Yu., Beck, T., Moiseev, A., Smith, M. D., & Nikogossian, E. H. 2006, A&A, 455, 1001
- Muzerolle, Hartmann, & Calvet (1998) Muzerolle, J., Hartmann, L., & Calvet, N. 1998, AJ, 116, 455
- Najita, Carr, & Tokunaga (1996) Najita, J., Carr, J. S., & Tokunaga, A. T. 1996, ApJ, 456, 292
- Peretto, André & Belloche (2006) Peretto, N., André, P., & Belloche, A. 2006, A&A, 445, 979
- Reipurth (1989) Reipurth, B. 1989, RevMexAA, 19, 38
- Reipurth & Aspin (1997) Reipurth, B. & Aspin, C. 1997, AJ, 114, 2700
- Reipurth & Aspin (2004) Reipurth, B., & Aspin, C. 2004, ApJ, 608, L65
- Reipurth et al. (2004) Reipurth, B., Yu, K.C., Moriarty-Schieven, G., Bally, J., Aspin, C., & Heathcote, S. 2004, AJ, 127, 1069
- Reipurth et al. (2007) Reipurth B., Aspin C., Beck T., Brogan C., Connelley M.S. & Herbig G.H. 2007, AJ, 133, 1000
- Sandell & Aspin (1998) Sandell, G., & Aspin, C. 1998, A&A, 333, 1016
- Sandell & Weintraub (2001) Sandell, G. & Weintraub, D.A. 2001, ApJS, 134, 115
- Staude & Neckel (1991) Staude, H. J., Neckel, T. 1991, A&A, 244, L13
- Teixeira et al. (2006) Teixeira, P.S., Lada, C.J., Young, E.T., Marengo, M., Muench, A., Muzerolle, J., Siegler, N., Rieke, G., Hartmann, L., Megeath, S.T., & Fazio, G. 2006, ApJ, 636, L45
- Teixeira et al. (2007) Teixeira, P.S.. Zapata, L.A., & Lada, C.J. 2007, ApJ, 667, L179
- Wang et al. (2004) Wang, H., Apai, D., Henning, T., & Pascucci, I. 2004, ApJ, 601, L83
- Ward-Thompson et al. (2000) Ward-Thompson, D., Zylka, R., Mezger, P. G., & Sievers, A. W. 2000, A&A, 355, 1122
- Wolf-Chase et al. (2003) Wolf-Chase, G., Moriarty-Schieven, G., Fich, M., & Barsony, M. 2003, MNRAS, 344, 809
- Young et al. (2006) Young, E. T., Teixeira, P. S., Lada, C. J., Muzerolle, J., Persson, S. E., Murphy, D. C., Siegler, N., Marengo, M., Krause, O. & Mainzer, A. K. 2006, ApJ, 642, 972
| Passband | AR 6 | FU Ori | V350 Mon | GQ Mon | V420 Mon | V421 Mon | V356 Mon | V230 Mon | V607 Mon | V360 Mon | IRAS 12bbIRAS 12 is IRAS 06382+0939 as designated by Margulis et al. (1989). |
|---|---|---|---|---|---|---|---|---|---|---|---|
| AR# | 6 | – | 2 | 1 | 5 | 7 | 15 | – | – | – | – |
| ETY#ccETY# is the identification from Young et al. (2006). | – | – | – | – | – | – | 2 | – | – | – | – |
| OtherddIdentification from Lick and Kiso H surveys. | – | – | LH40 | LH38 | LH42 | KH104 | KH107 | – | – | – | – |
| (mags) | (mags) | (mags) | (mags) | (mags) | (mags) | (mags) | (mags) | (mags) | (mags) | (mags) | (mags) |
| J | 11.64eeConservative uncertainties on all photometry and colors are 0.04 and 0.06, respectively. | 6.52ffJHK photometry from 2MASS. | 13.20 | 12.94 | 12.71 | 11.97 | 12.91 | 12.41 | BggPhotometry quality flag ‘bad’ in 2MASS catalog. | 11.64 | – |
| H | 9.32 | 5.70 | 12.12 | 11.71 | 11.96 | 11.10 | 12.83 | 11.58 | 12.73 | 11.02 | – |
| K | 7.96 | 5.16 | 11.48 | 10.77 | 11.60 | 10.72 | 12.46 | 11.13 | 10.56 | 10.55 | – |
| L | 6.34 | – | – | – | – | – | – | – | – | – | – |
| M | 6.03 | – | – | – | – | – | – | – | – | – | – |
| 3.6ggPhotometry quality flag ‘bad’ in 2MASS catalog. | 6.42 | 5.02 | 10.13 | 9.06 | 10.53 | 9.67 | 11.26 | 10.53 | 8.68 | 10.16 | 6.68 |
| 4.5 | 5.88 | 4.38 | 9.67 | 8.53 | 10.22 | 9.37 | 10.98 | 10.23 | 7.93 | 9.90 | 6.08 |
| 5.8 | 5.30 | 3.55 | 9.48 | 8.08 | 10.15 | 8.91 | 10.56 | 10.19 | 7.07 | 9.80 | 5.59 |
| 8.0 | 4.79 | 3.00 | 8.73 | 7.02 | 9.31 | 8.39 | 10.89 | 9.32 | 5.92 | 9.19 | 4.90 |
| 24.0hhIRAC and MIPS photometry following Gutermuth et al. (2008). | 1.85 | 0.40 | 4.83 | 3.98 | – | 5.64 | 6.24 | – | 2.05 | 4.71 | 0.72 |
| J-H | 2.10 | 0.82 | 0.99 | 1.23 | 0.75 | 0.87 | 0.08 | 0.83 | – | 0.62 | – |
| H-K | 1.58 | 0.54 | 0.73 | 0.93 | 0.36 | 0.38 | 0.37 | 0.45 | 2.17 | 0.47 | – |
| K-L | 1.62 | – | – | – | – | – | – | – | – | – | – |
| 0.54 | 0.64 | 0.47 | 0.52 | 0.31 | 0.31 | 0.28 | 0.30 | 0.75 | 0.26 | 0.60 | |
| 0.51 | 0.55 | 0.75 | 1.06 | 0.84 | 0.52 | –0.33 | 0.86 | 1.15 | 0.61 | 0.69 | |
| 0.58 | 0.83 | 0.18 | 0.45 | 0.07 | 0.45 | 0.42 | 0.04 | 0.86 | 0.11 | 0.49 | |
| 4.03 | 3.98 | 4.83 | 4.55 | – | 3.73 | 4.75 | – | 5.88 | 5.19 | 5.37 | |
| 1.12 | 1.47 | 0.65 | 0.98 | 0.38 | 0.76 | 0.70 | 0.34 | 1.61 | 0.36 | 1.09 | |
| 1.09 | 1.38 | 0.94 | 1.51 | 0.91 | 0.98 | 0.09 | 0.91 | 2.01 | 0.72 | 1.18 | |
| iiIRAC spectral index using the 3.6 to 8.0m photometry following Lada et al. (2006). | -0.95 | -1.15 | –1.30 | –0.53 | –1.51 | –1.34 | –2.35 | –1.53 | +0.34 | –1.77 | –0.82 |