First Principles Study on the origin of large thermopower in hole doped LaRhO3 and CuRhO2
Abstract
Based on first principles calculations, we study the origin of the large thermopower in Ni-doped LaRhO3 and Mg-doped CuRhO2 We calculate the band structure and construct the maximally localized Wannier functions, from which a tightbinding Hamiltonian is obtained. The Seebeck coefficient is calculated within the Boltzmann’s equation approach using this effective Hamiltonian. For LaRhO3, we find that the Seebeck coefficient remains nearly constant within a large hole concentration range, which is consistent with the experimental observation. For CuRhO2, the overall temperature dependence of the calculated Seebeck coefficient is in excellent agreement with the experiment. The origin of the large thermopower is discussed.
1 Introduction
The discovery of large thermopower in NaxCoO2[1] and the findings in cobaltates/cobaltites[4, 5, 6, 7, 8] and rhodates[9, 10] that followed have brought up an interesting possibility of finding good thermoelectric materials that have relatively low resistivity. We have recently proposed that the “pudding-mold” type band is the origin for the coexistence of the large thermopower and the low resistivity in this material. [2]. Let us first summarize our idea. Using the Boltzmann’s equation, the thermopower is given as
| (1) |
where is the electron charge, is the temperature, tensors and are given by
| (2) |
Here, is the band dispersion, is the group velocity, is the quasiparticle lifetime, is the Fermi distribution function, and is the chemical potential. Hereafter, we simply refer to as , and (for diagonal ) as . Using , conductivity can be given as . Roughly speaking for a constant , (apart from a constant factor) stand, where is a summation over the states in the range of , and and are typical velocities for the states above and below , respectively. If we consider a band that has a somewhat flat portion at the top (or the bottom), which sharply bends into a highly dispersive portion below (above). We will refer to this band structure as the “pudding mold” type. For this type of band with sitting near the bending point, holds for high enough temperature, so that the cancellation in is less effective, resulting in and , and thus large V/K. Moreover, the large and the large FS results in a large as well, being able to give a large power factor , which is important for device applications.
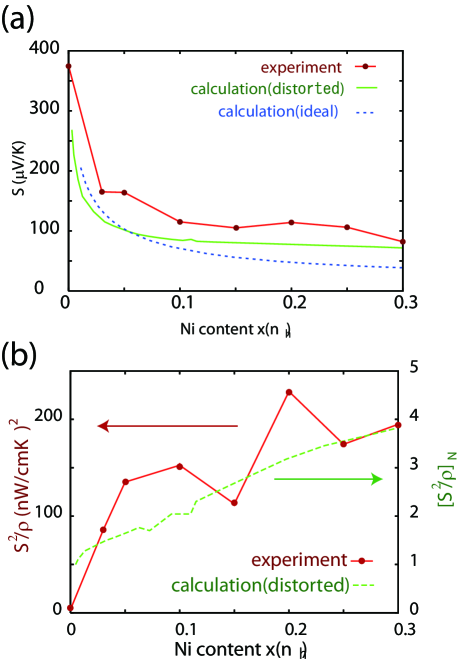
In the present study, we focus on a possibly related rhodate LaRhO3[3] with Ni doping and CuRhO2 [15, 16] with Mg doping, in which large thermopower has been observed. In Ni doped LaRhO3, the Seebeck coefficient at 300K steeply decreases up to the Ni content of , but then stays around V/K up to about . On the other hand, the conductivity monotonically grows, resulting in a monotonically increasing power factor (see Fig.2). For CuRhO2, the two existing experiments give different results. In ref.[16], the Seebeck coefficient is found to be nearly independent of doping, while it decreases with doping in ref.[15].
2 Method
LaRhO3 has an orthorhombic structure, which is distorted to some extent from the ideal cubic perovskite structure. The experimentally determined lattice constants are , and Å[11]. For comparison, we also calculate the band structure for the ideal cubic perovskite structure, where the lattice constant is taken as Å.[14] CuRhO2 has an delafossite structure whose experimental lattice constants are , Å. We have obtained the band structure of these materials with the Quantum-ESPRESSO package[12]. We then construct the maximally localized Wannier functions (MLWFs)[13] for the energy window for the ideal structure of LaRhO3, for the distorted structure of LaRhO3 and for CuRhO2, where is the eigenenergy of the Bloch states and the Fermi energy. With these effective hoppings and on-site energies, the tight-binding Hamiltonian is obtained, and finally the Seebeck coefficient is calculated using eq.(1). The doping concentration is assumed to be equal to the hole concentration, and a rigid band is assumed.
3 Results and Discussions
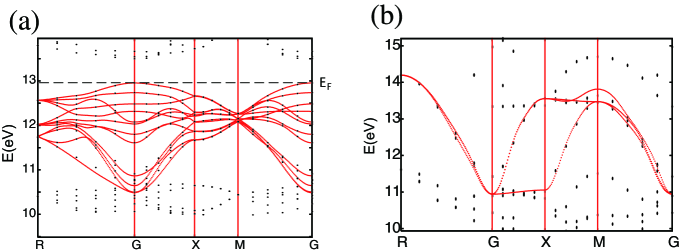
We first present results for LaRhO3. The calculated band structure for the distorted structure of LaRhO3 is shown in Fig.1 along with that for the ideal structure. The tightbinding model Hamiltonian for the distorted structure consists of 12 bands (4 Rh per unit cell), while the model for the ideal structure contains three bands. The calculated Seebeck coefficient at 300K is shown in Fig.2 as a function of hole concentration together with the experimental result.[3] Here we assume that the hole concentration is equal to the Ni content. It can be seen that the Seebeck coefficient steeply decreases with doping with , but stays nearly constant for for the distorted structure in particular. As a result the (normalized) power factor monotonically grows with doping, which is at least in qualitative agreement with the experimental observation.
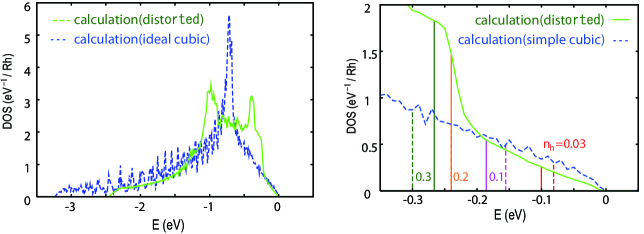
Now, in order to understand this peculiar hole concentration dependence of the Seebeck coefficient, we now turn to the density of states (DOS). The comparison of the DOS between the two structures is shown in Fig.3. The DOS at the band top is larger for the ideal case since the three bands are degenerate. Thus, for low doping, stays closer to the band top for the ideal structure, resulting in a larger Seebeck coefficient. This is a typical example where the multiplicity of the bands lead to an enhanced thermopower, i.e., the larger the number of bands, the closer the to the band top. In the case of the distorted structure, as the hole concentration increases, lowers and hits the portion of the band with a large DOS (Fig.3left). Therefore, hardly moves with doping, resulting in a slow decrease of the Seebeck coefficient. A large DOS region lies in a lower energy regime in the ideal structure, and therefore the Seebeck coefficient continues to decrease with doping (up to a larger doping concentration). The large Seebeck coefficient of about 80V/K in the distorted structure can be considered as due to the flatness of the top of the bands (around the point), i.e., the pudding mold type band.
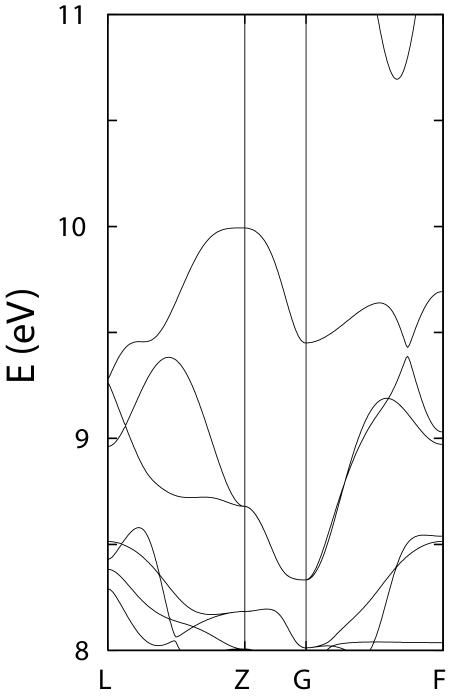
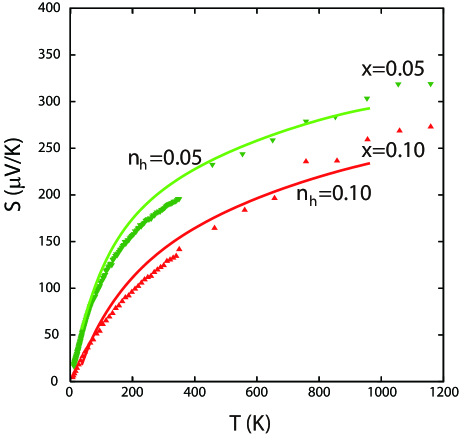
We now move on to CuRhO2. The calculated band structure is shown in Fig.4. Around the point, there is again a pudding mold type band, whose top is very flat. The calculation result of the Seebeck coefficient as a function of temperature is shown in Fig.5. We find excellent agreement with the experiment in ref.[15] in a wide temperature range and for the Mg content and . On the other hand, in ref.[16], the Seebeck coefficient is nearly independent on . The origin of the discrepancy between this experiment and the present calculation remain as a future problem.
4 Conclusion
To conclude, we have studied the origin of the large thermopower in LaRhO3 and CuRhO2. From the first principles band calculation results, a tightbinding model is obtained via the maximally localized Wannier orbitals, and the Seebeck coefficient is calculated using the tightbinding model. In both materials, the large value of the Seebeck coefficient can be considered as due to the flatness of the top of the bands i.e., the pudding mold type band. For LaRhO3 in particular, the Seebeck coefficient barely decreases for the hole concentration of in agreement with the experiment, which we attribute to the peculiar uprise of the DOS near the band top.
The authors acknowledge I. Terasaki, S. Shibasaki, and M. Nohara for valuable discussions and providing us the experimental data. Numerical calculation has been done at the Supercomputing Center, ISSP, University of Tokyo. This study has been supported by the Grants in Aid for Scientific Research from the MEXT of Japan and from JSPS.
References
References
- [1] I. Terasaki, Y. Sasago, and K. Uchinokura, Phys. Rev. B 56, R12686 (1997)
- [2] K. Kuroki and R. Arita, J.Phys.Soc.Jpn. 76, 083707 (2007)
- [3] S. Shibasaki, Y. Takahashi, and I. Terasaki, arXiv:0712.1626.
- [4] S. Li et al., J. Mater. Chem. 9 (1999) 1659
- [5] K. Fujita et al., Jpn. J. Appl. Phys. 40 (2001) 4644
- [6] S. Hbert et al., Phys. Rev. B 64 (2001) 172101
- [7] Y. Miyazaki et al., J. Phys. Soc. Jpn. 71 (2002) 491
- [8] M. Lee /it et al., Nat. Mater. 5 (2006) 537
- [9] S. Okada and I. Terasaki, Jpn. J. Appl. Phys. 44 (2005) 1834
- [10] Y. Okamoto et al., J. Phys. Soc. Jpn. 75 (2006) 023704
- [11] Rne B. Macquart et al., Crystal Growth and Design 6(6) (2006) 1361-1365
- [12] S. Baroni et al., http://www.pwscf.org/.
- [13] N. Marzari and D. Vanderbilt, Phys. Rev. B 56, 12847 (1997); I. Souza et al., Phys. Rev. B 65, 035109 (2002). The Wannier functions are generated by the code developed by A. A. Mostofi et al. (http://www.wannier.org/)
- [14] F. S. Galasso, Structure and Properties of Inorganic Solids (Pergamon, New York, 1970)
- [15] H. Kuriyama, M. Nohara, T. Sasagawa, K. Takubo, T. Mizokawa, K. Kimura, and H. Takagi, Proc. 25th Int. Conf. on Thermoelectrics (IEEE, Piscataway, 2006)
- [16] S. Shibasaki, W. Kobayashi, and I. Terasaki, Phys. Rev. B 74, 235110 (2006).