1\Yearpublication2008\Yearsubmission2008\Month9\Volume999\Issue88\DOIDOI
later
New absolute magnitude calibrations for W Ursa Majoris type binaries
Abstract
Parallaxes of W UMa stars in the Hipparcos catalogue have been analyzed. 31 W UMa stars, which have the most accurate parallaxes () which are neither associated with a photometric tertiary nor with evidence of a visual companion, were selected for re-calibrating the Period–Luminosity–Color (PLC) relation of W UMa stars. Using the Lutz–Kelker (LK) bias corrected (most probable) parallaxes, periods (), and colors () of the 31 selected W UMa, the PLC relation have been revised and re-calibrated. The difference between the old (revised but not bias corrected) and the new (LK bias corrected) relations are almost negligible in predicting the distances of W UMa stars up to about 100 parsecs. But, it increases and may become intolerable as distances of stars increase. Additionally, using and colors from 2MASS (Two Micron All Sky Survey) data, a PLC relation working with infrared data was derived. It can be used with infrared colors in the range , and . Despite 2MASS data are single epoch observations, which are not guaranteed at maximum brightness of the W UMa stars, the established relation has been found surprisingly consistent and reliable in predicting LK corrected distances of W UMa stars.
keywords:
stars: distances, (stars:) binaries: eclipsing1 Introduction
Low-mass contact binaries, popularly known as W Ursa Majoris (W UMa) stars are easy to recognize by a light curve with equal (or nearly equal) depths of minima which are wide enough to touch one another. Even if the total luminosity produced solely by the more massive component, efficient energy distribution through a common envelope makes the their surface brightness practically the same over the visible surface (Rucinski, 1985, 1993). Even though the effective temperature is the same on the surfaces of components, there could be different masses hidden under the common atmospheres. Their mass-ratios span from almost unity (V753 Mon, =0.973, Rucinski, Lu & Mochnacki, 2000) to very small values as small as =0.066 (SX Crv, Rucinski et al., 2001). Therefore, W UMa binaries are non-equilibrium systems exchanging mass and energy between the components. Hence, despite such an external simplicity, their internal structure is rather complex.
External simplicity and the observational properties of W UMa systems were the basic reasons for establishing an absolute magnitude calibration by Rucinski (1994). The calibration uses two observational quantities, the orbital period and intrinsic color, e.g. or . The period and the color are correlated through a combined effect of geometry, Kepler‘s third law and main-sequence relationships. The calibration, which is in the form of , has been widened later to include a metallicity term (Rucinski, 1995). Those earlier calibrations were based on 18 systems, mostly members of high galactic latitude open clusters and of visual binaries, including only three nearby W UMa systems with known trigonometric parallaxes, 44i Boo B, VW Cep and CrA.
After Hipparcos parallaxes became available, the Period–Luminosity–Color (PLC) relation has been re-calibrated with 40 nearby W UMa systems in the solar neighborhood with parallaxes having relative errors from 2.7 to 24%. With this new data, the accuracy of the calibration (0.25 mag at a predicted ) was claimed: “it is no longer limited by the parallax data but, paradoxically, by the lack of reliable photometric data” (Rucinski & Duerbeck, 1997). However, later, Rucinski (2000, 2004) argued: at earlier times, when limited information was available, it seemed that metallicity dependence did exist (Rucinski, 1995). But later when extensive data for many globular clusters were examined, the metallicity term become obsolote (Rucinski, 2000). At least, solar neighborhood calibration works well for contact systems of different metallicities at level of uncertainty mag. Thus, there is no need to keep the metallicity term in PLC relation (Rucinski, 2004). At last, after metallicity term was dropped, the color term was also removed, and the relation is transformed to a much simpler form by Rucinski (2006), when estimating spatial density of contact binaries based on the ASAS survey as a necessity because the lack of color indices in the ASAS data. This calibration was established from 21 systems of good Hipparcos () data which were carefully chosen as being free of triple and multiple systems.
PLC relation provides absolute magnitudes of contact binaries if their de-reddened colors and periods are known. Consequently, PLC relation has many practical usages. It is useful not only in calculating space velocities and space densities of W UMa (Rucinski, 2002; Bilir et al., 2005; Gettel, Geske & Mckay, 2006) stars but also for confirming or disproving of contact binaries in stellar clusters (Rucinski, 1998, 2000). Moreover, it permits W UMa stars to be used as standard candles. In fact, through PLC relation, W UMa stars become more likely to be used as standard candles than RR Lyr stars because W UMa stars are 24000 times more common than RR Lyr stars (Rucinski & Duerbeck, 1997).
Unfortunately, random errors, presumably symmetric on the measured parallaxes, do not provide symmetric uncertainties on the computed distances. Therefore, a measured trigonometric parallax is very likely to be larger than the true parallax. The problem has already been noticed and studied by Lutz & Kelker (1973). Assuming a uniform space distribution of stars and a Gaussian distribution of observed parallaxes over a true parallax, Lutz & Kelker (1973) have revealed that there exists a systematic error in the computed distances which depends only upon the ratio , where is the observed parallax. However, this crucial study has not produced proper response in the literature. Many studies including existing PLC calibration were completed without even discussing the Lutz-Kelker bias. Jerzykiewicz (2001) has shown that only the careful studies which used parallaxes with could be excused since the bias would be negligible. Otherwise, not taking the Lutz-Kelker bias into account would either alter the conclusions or invalidate them altogether if relative larger errors were involved.
Standard Lutz-Kelker corrections become significant if (Maiz Apellaniz, 2005). Therefore, Period-Luminosity relation of Rucinski (2006), which relies on 21 W UMa stars with sufficiently accurate () parallaxes, may not be excused. The classical PLC relation of Rucinski & Duerbeck (1997), which was founded on parallaxes of 40 W UMa stars with relative errors from 2.7 to 24%, definitely needs to be re-calibrated. This study aims to improve existing PLC relation by not only correcting it according to Lutz-Kelker bias but also refining the sample of W UMa stars by eliminating the ones which have less reliable parallaxes because of belonging to multiple systems.
Moreover, applicability of the PLC relation at infrared colors are investigated. Being based on similar principles, a similar relation (PLC) for cataclysmic variables (CV) has already been established by using and colors from 2MASS (Two Micron All Sky Survey) data and proved to be useful for estimating CV distances by Ak et al. (2007). Despite, 2MASS data are compiled from single epoch observations, which are not guaranteed to be at maxima, the relation which uses and colors of 2MASS photometric system have been found to be as useful as the existing relation which involve and colors (Rucinski, 2004). The advantage of this new relation is that it is less effected by de-reddening problems.
2 Data
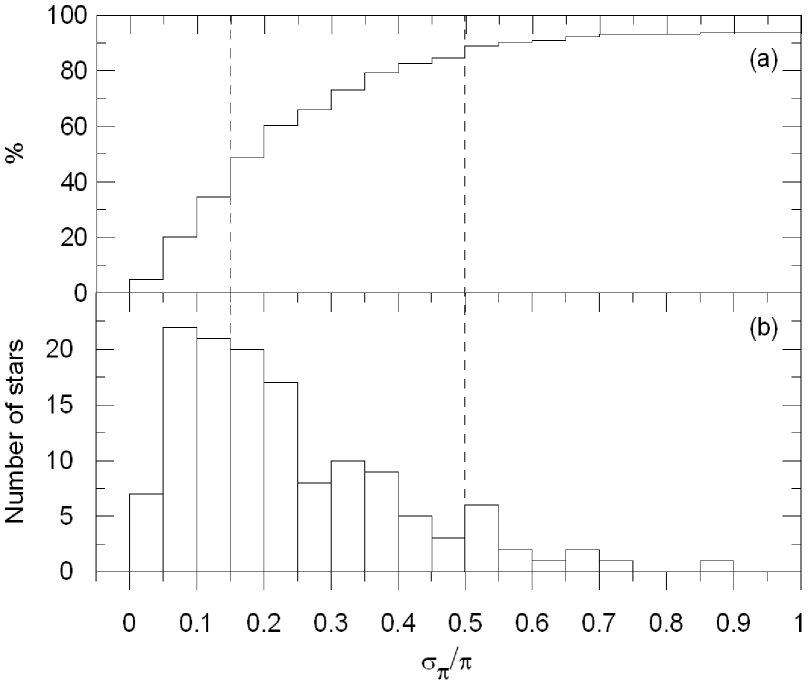
There are 751 W UMa binaries listed in the revised edition of the GCVS. Only 144 of them were found to have trigonometric parallaxes in the Hipparcos catalogue (ESA, 1997). Nine of them could be discarded right away because their relative errors () are intolerable. For the rest (135 systems), the distribution of relative parallax errors have been shown in Fig. 1.
Calibration process of PLC relation requires both accuracy of calibration data and statistical significance. While statistical significance requires as many as possible W UMa stars, accuracy of input data, on the other hand, demands using only the data of W UMa stars with the most accurate parallaxes. Therefore, an optimized upper limit for the relative error of parallaxes needs to be determined.
2.1 Lutz-Kelker bias corrected parallaxes
It is known that a standard Lutz-Kelker (LK) correction , which corrects mean absolute magnitude of a sample, is significant if and increases as increases. Corrections were claimed to diverge and became incomputable if (Lutz & Kelker, 1973, 1975; Norgaard-Nielsen, 1978; Smith, 1987a, b, 2003; Brown et al., 1997; Oudmaijer, Groenewegen & Schrijver, 1998; Maiz Apellaniz, 2005). Standard LK bias primarily computes an expected value of parallaxes, which stands for the mean of the true parallax distribution of an uniformly distributed sample of stars. Here, we are interested in the most probable value of the true parallax () for a single star which has an observed parallax () and associated error (). As for estimating distances, one can transform the posterior probability of the true parallax to that of the distance and use it to find the most probable distance (Smith, 1987a). Considering that the present W UMa sample is well within the Galactic disc (TV Pic has the biggest pc, where is the distance from the galactic plane), it can be assumed that within the limited space at the vicinity of the star, the distribution is uniform. Consequently, according to Smith (1987a)
| (1) |
is the relation between the most probable true parallax (computed) and the observed parallax () and it‘s associated standard error ().
Although Eq. 1 is valid mathematically for , only the most probable true parallaxes of the systems with (standard LK limit), and corresponding distances () were computed and displayed in Table 1.
| ID | Star | Rem. | ||||||
|---|---|---|---|---|---|---|---|---|
| (mas) | (mas) | (mas) | (mas) | (pc) | (pc) | |||
| 1 | 44i Boo | 78.39 | 1.03 | 0.013 | 78.34 | 13 | 13 | 1 |
| 2 | VW Cep | 36.16 | 0.97 | 0.027 | 36.05 | 28 | 28 | 1 |
| 3 | CrA | 33.43 | 0.92 | 0.028 | 33.32 | 30 | 30 | |
| 4 | V972 Her | 16.25 | 0.61 | 0.038 | 16.16 | 62 | 62 | |
| 5 | CN Hyi | 17.22 | 0.65 | 0.038 | 17.12 | 58 | 58 | 1 |
| 6 | AE Phe | 20.49 | 0.81 | 0.040 | 20.36 | 49 | 49 | |
| 7 | DO Cha | 12.56 | 0.57 | 0.045 | 12.46 | 80 | 80 | |
| 8 | V2082 Cyg | 11.04 | 0.56 | 0.051 | 10.92 | 92 | 91 | 1 |
| 9 | W UMa | 20.17 | 1.05 | 0.052 | 19.95 | 50 | 50 | 1 |
| 10 | S Ant | 13.30 | 0.71 | 0.053 | 13.15 | 76 | 75 | |
| 11 | V335 Peg | 16.26 | 0.86 | 0.053 | 16.08 | 62 | 62 | 1 |
| 12 | V2388 Oph | 14.72 | 0.81 | 0.055 | 14.54 | 69 | 68 | 1 |
| 13 | OU Ser | 17.31 | 0.95 | 0.055 | 17.10 | 58 | 58 | |
| 14 | V445 Cep | 8.95 | 0.50 | 0.056 | 8.84 | 113 | 112 | 1 |
| 15 | V759 Cen | 15.88 | 0.93 | 0.059 | 15.66 | 64 | 63 | |
| 16 | AW UMa | 15.13 | 0.90 | 0.059 | 14.92 | 67 | 66 | 1 |
| 17 | GR Vir | 18.83 | 1.18 | 0.063 | 18.53 | 54 | 53 | |
| 18 | KR Com | 13.07 | 0.87 | 0.067 | 12.83 | 78 | 77 | 1 |
| 19 | YY Eri | 17.96 | 1.20 | 0.067 | 17.63 | 57 | 56 | |
| 20 | IS CMa | 10.01 | 0.71 | 0.071 | 9.80 | 102 | 100 | |
| 21 | CP Hyi | 8.38 | 0.60 | 0.072 | 8.20 | 122 | 119 | |
| 22 | YY CrB | 11.36 | 0.85 | 0.075 | 11.10 | 90 | 88 | |
| 23 | V757 Cen | 14.18 | 1.10 | 0.078 | 13.83 | 72 | 71 | |
| 24 | FX Eri | 13.67 | 1.06 | 0.078 | 13.33 | 75 | 73 | |
| 25 | V566 Oph | 13.98 | 1.11 | 0.079 | 13.62 | 73 | 72 | 1 |
| 26 | RR Cen | 9.76 | 0.85 | 0.087 | 9.45 | 106 | 103 | |
| 27 | GM Dra | 10.16 | 0.88 | 0.087 | 9.84 | 102 | 98 | |
| 28 | V899 Her | 8.06 | 0.77 | 0.096 | 7.75 | 129 | 124 | 1 |
| 29 | V502 Oph | 11.84 | 1.17 | 0.099 | 11.36 | 88 | 85 | 1 |
| 30 | V535 Ara | 8.87 | 0.90 | 0.101 | 8.49 | 118 | 113 | |
| 31 | SW Lac | 12.30 | 1.26 | 0.102 | 11.76 | 85 | 81 | 1 |
| 32 | ET Leo | 13.90 | 1.44 | 0.104 | 13.27 | 75 | 72 | 1 |
| 33 | TY Men | 5.93 | 0.63 | 0.106 | 5.65 | 177 | 169 | |
| 34 | V918 Her | 8.70 | 0.93 | 0.107 | 8.28 | 121 | 115 | |
| 35 | V781 Tau | 12.31 | 1.35 | 0.110 | 11.68 | 86 | 81 | 1 |
| 36 | SX Crv | 10.90 | 1.21 | 0.111 | 10.33 | 97 | 92 | |
| 37 | VW LMi | 8.04 | 0.90 | 0.112 | 7.61 | 131 | 124 | 1 |
| 38 | WY Hor | 8.82 | 1.00 | 0.113 | 8.34 | 120 | 113 | |
| 39 | XY Leo | 15.86 | 1.80 | 0.113 | 15.00 | 67 | 63 | 1 |
| 40 | EX Leo | 9.84 | 1.11 | 0.113 | 9.31 | 107 | 102 | |
| 41 | OQ Vel | 5.37 | 0.62 | 0.115 | 5.07 | 197 | 186 | |
| 42 | V1084 Sco | 11.16 | 1.32 | 0.118 | 10.50 | 95 | 90 | 1 |
| 43 | NN Vir | 9.48 | 1.14 | 0.120 | 8.90 | 112 | 106 | |
| 44 | V2377 Oph | 10.09 | 1.22 | 0.121 | 9.46 | 106 | 99 | |
| 45 | VZ Psc | 16.77 | 2.07 | 0.123 | 15.68 | 64 | 60 | |
| 46 | V351 Peg | 7.34 | 0.92 | 0.125 | 6.85 | 146 | 136 | |
| 47 | TV Pic | 5.04 | 0.63 | 0.125 | 4.70 | 213 | 198 | |
| 48 | V870 Ara | 10.01 | 1.34 | 0.134 | 9.23 | 108 | 100 | |
| 49 | V839 Cen | 11.94 | 1.66 | 0.139 | 10.93 | 92 | 84 | |
| 50 | V386 Pav | 7.14 | 1.01 | 0.141 | 6.52 | 153 | 140 | |
| 51 | DX Tuc | 7.40 | 1.12 | 0.151 | 6.65 | 150 | 135 | |
| 52 | V752 Cen | 9.51 | 1.47 | 0.155 | 8.49 | 118 | 105 | |
| 53 | AQ Psc | 8.03 | 1.29 | 0.161 | 7.09 | 141 | 125 | 1 |
| 54 | AC Boo | 7.58 | 1.27 | 0.168 | 6.60 | 152 | 132 | |
| 55 | BV Dra | 14.86 | 2.56 | 0.172 | 12.82 | 78 | 67 | 1 |
| 56 | FU Dra | 6.25 | 1.09 | 0.174 | 5.37 | 186 | 160 | |
| 57 | V1073 Cyg | 5.44 | 0.95 | 0.175 | 4.66 | 214 | 184 |
Remarks: (): selected; (1): discarded because of membership to a multiple system.
2.2 Other observational data
In addition to LK bias corrected parallaxes, the most reliable orbital periods and intrinsic colors are needed to revise the PLC relation. Orbital periods and spectral types are mostly from the catalog of Pribulla, Kreiner & Tremko (2003), while the maximum visual brightnesses () were taken from Pribulla & Rucinski (2006). Intrinsic colors of main sequence stars were taken from Neill Reid’s WEB page 111http://www-int.stsci.edu/inr/intrins.html. In addition to these visual photometric data, the infrared brightnesses , and magnitudes were taken from the Point-Source Catalogue and Atlas (Cutri et al., 2003; Skrutskie et al., 2006) which is based on the Two Micron All Sky Survey (2MASS) observations. The 2MASS photometric system comprises Johnson s (1.25 m) and (1.65 m) bands with the addition of (2.17 m) band, which is bluer than Johnson s -band. Infrared data are for to establishing PLC relation at infrared wavelengths.
The color excess , although a relatively small quantity, it can effect the calibration in a systematic way. It has already been noticed by Rucinski & Duerbeck (1997) that the color excess were likely overestimated in previous studies (Rucinski & Kaluzny, 1981; Rucinski, 1983). Therefore, we have carefully re-investigated the color excess of the stars in Table 1 using three independent methods. The first method uses spectral types to estimate intrinsic color of a system. The second method uses the color excess found from the literature directly, which are the estimates from the hydrogen column density or main-sequence fitting. The third method computes the color excess from Schlegel et al. (1998) maps by using NASA Extragalactic Database222http://nedwww.ipac.caltech.edu/forms/calculator.html. Since sample W UMa stars are relatively nearby, the color excesses according to Schlegel et al. (1998) need to be reduced. First, color excess in the galactic latitude () and longitude () was taken from Schlegel et al. (1998). Then, the total absorption towards the star in the galactic disk in the -band was evaluated as
| (2) |
where the subscript symbolizes up to infinity but actually it is up to the edge of our galaxy in the line of sight. Thirdly, the interstellar absorption up to the star distance is calculated according to Bahcall & Soneira (1980)
| (3) |
where is the scaleheight for the interstellar dust which is adopted to be 100 pc as usual (see e.g. Mendez & van Altena, 1998). Finally, the color excess for the star at the distance is estimated as
| (4) |
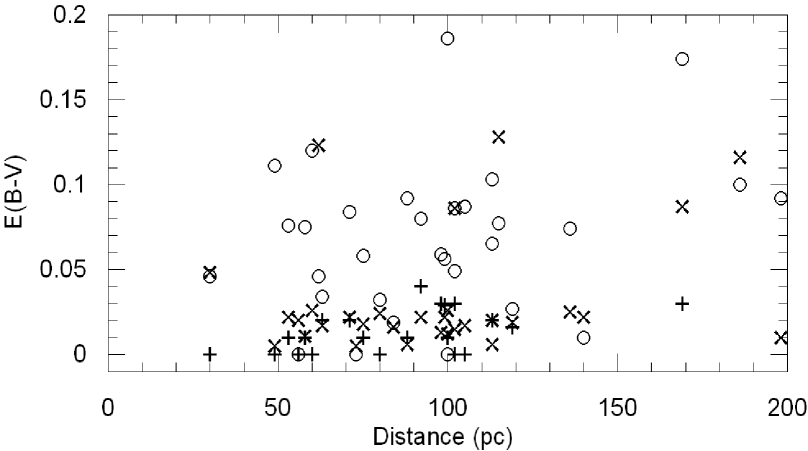
It is demonstrated (Fig. 2) that the first method usually overestimates the color excess with respect to the other two methods. The color excesses from the literature and the values computed using Schlegel et al. (1998) extinction maps agree with each other. Literature values could not be trusted especially if they are zero, which could be the cases because the color excess was ignored blindly. On the other hand, values computed by the method of Schlegel et al. (1998) extinction maps are not trusted at low galactic latitudes () due to local inhomogeneities of galactic disc. Therefore, care was given to values of all stars one by one and the most trustable value was selected. Adopted values are usually the ones which are taken from the literature where the source references are given or the method of inquiry is indicated (Table 2).
Once color excesses are known, then the intrinsic colors and the interstellar absorption in the -band were computed as
| (5) |
| (6) |
Consequently, de–reddening of the infrared bands becomes ready using the relations given by Fiorucci & Munari (2003), (see also, Bilir, Güver & Aslan, 2006; Ak et al., 2007; Bilir et al., 2008), which are
| (7) |
| (8) |
| (9) |
2.3 Formation of the final calibration list
Regarding the accuracy, today’s technology is capable of determining a visual brightness within the accuracy of few millimagnitudes. Because of O’Connell’s effect, which could be several millimagnitudes (Davidge & Milone, 1984), the maximum visual brightness () of W UMa stars have additional uncertainties. Error contribution of a visual brightness, even if it is in the order of several millimagnitudes, is negligible compared to the other contributing errors. For example, uncertainties of , which contributes to the uncertainty of interstellar absorption through , are in the order of 0.01 – 0.02 mag (Rucinski & Duerbeck, 1997; Rucinski, 2002, 2006). The uncertainty of , however, is not only due to the uncertainty of , but also due to the uncertainty of the coefficient in front of . Depending upon the position of a star relative to the Sun in the galactic plane, there could be cases where the coefficient could be as small as 2.75 and as big as 3.52 (Cardelli, Clayton & Mathis, 1989). Therefore a rough estimate of the uncertainty of is in average 0.06 magnitudes. Even if the error contribution of is overestimated to be 0.1 mag, it would still be smaller than the uncertainty contribution of a 10% parallax error, which is 0.217 mag.
There are 29 W UMa systems with in Table 1, which could be considered statistically significant at least at the limit. However, Pribulla & Rucinski (2006) have found that up to 59% of W UMa stars have companions. Actually, one of the criteria of multiplicity for Pribulla & Rucinski (2006) was the large error of the observed parallax. Trigonometric parallaxes are frequently wrong for these systems because complexity of the multiple orbital motions shows itself both at proper motion and parallax measurements. Therefore, W UMa binaries which are known to be associated with companions were excluded as Rucinski (2006) did when establishing PL relation. W UMa which are known to have companions are marked in Table 1. The 13 out 29 stars with are marked, so after removing them, the 16 W UMa systems left would definitely not satisfy statistical significance. We decided to include all systems up to the limit , which means uncertainties in the absolute magnitudes would be better than 0.33 mag. This process provided us with 31 W UMa stars after removing the ones with companions, which we think satisfy statistical significance and accuracy for re-calibrating the PLC relation. W UMa stars with larger parallax errors are not included to avoid adding stars with less accurate absolute magnitudes.
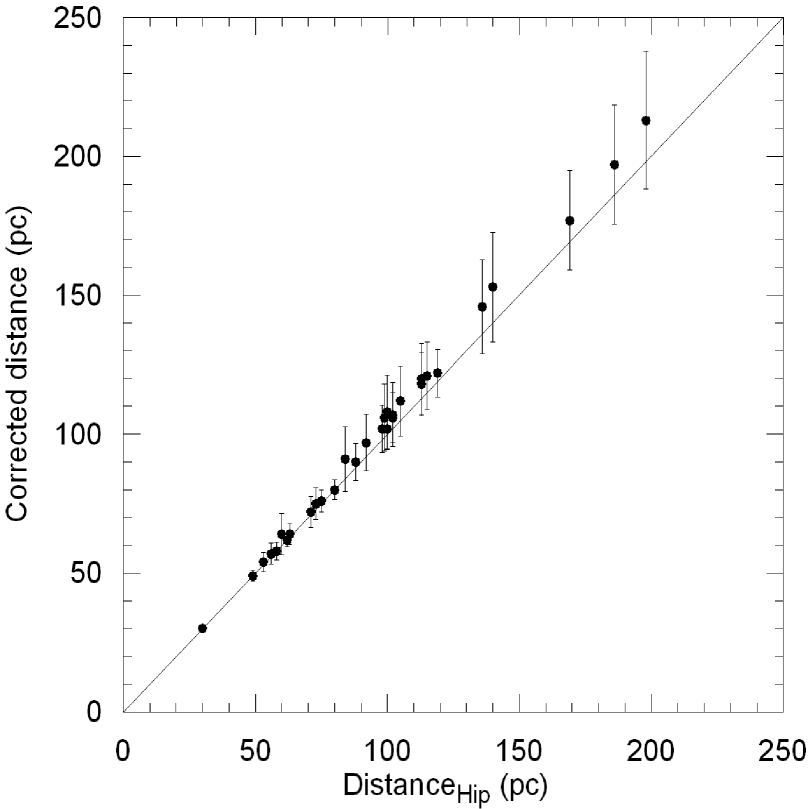
In Table 2, LK corrected absolute magnitudes and for 31 W UMa stars were computed with most probable true parallax and adopted color excess . The uncorrected absolute magnitudes [ and ] were also listed just for comparison. Fig. 3 compares corrected and uncorrected distances of the calibration sample.
| (1) | (2) | (3) | (4) | (5) | (6) | (7) | (8) | (9) | (10) | (11) | (12) | (13) | (14) | (15) | (16) | (17) | (18) | (19) |
|---|---|---|---|---|---|---|---|---|---|---|---|---|---|---|---|---|---|---|
| Name | (B-V)0 | E(B-V) | E(B-V) | E(B-V) | (B-V) | E(B-V) | J | (J-H) | (H-Ks) | M(V) | M(V) | M(J) | M(J) | |||||
| (mas) | (day) | INT1 | OMI2 | LIT3 | SCH4 | (mag) | OBS5 | ADP6 | (mag) | (mag) | (mag) | (Hip) | (true) | (Hip) | (true) | |||
| CrA | 33.32 | 0.028 | 0.59144070 | F2V | 0.35 | 0.046 | 0.000 | 0.048 | 4.74 | 0.396 | 0.046 | 4.052 | 0.264 | -0.090 | 2.218 | 2.211 | 1.632 | 1.625 |
| V972 Her | 16.16 | 0.038 | 0.44309740 | F4V | 0.42 | 0.046 | – | 0.123 | 6.62 | 0.466 | 0.046 | 5.785 | 0.149 | 0.103 | 2.532 | 2.519 | 1.798 | 1.786 |
| AE Phe | 20.36 | 0.040 | 0.36237274 | F8V | 0.53 | 0.111 | 0.000 | 0.005 | 7.56 | 0.641 | 0.000 | 6.577 | 0.289 | 0.107 | 4.118 | 4.104 | 3.135 | 3.121 |
| DO Cha | 12.46 | 0.045 | 0.68144600 | F7V | 0.50 | 0.032 | 0.000 | 0.024 | 7.61 | 0.535 | 0.032 | 6.634 | 0.250 | 0.067 | 3.006 | 2.988 | 2.101 | 2.083 |
| S Ant | 13.15 | 0.053 | 0.64834550 | A9V: | 0.30 | 0.058 | 0.010 | 0.018 | 6.40 | 0.358 | 0.010 | 6.087 | 0.127 | 0.095 | 1.988 | 1.963 | 1.697 | 1.673 |
| OU Ser | 17.10 | 0.055 | 0.29676450 | F9/G0V | 0.56 | 0.075 | 0.010 | 0.011 | 8.10 | 0.635 | 0.010 | 6.946 | 0.264 | 0.112 | 4.260 | 4.234 | 3.129 | 3.102 |
| V759 Cen | 15.66 | 0.059 | 0.39399912 | F9V | 0.56 | 0.034 | 0.020 | 0.017 | 7.40 | 0.594 | 0.020 | 6.530 | 0.242 | 0.063 | 3.342 | 3.311 | 2.517 | 2.486 |
| GR Vir | 18.53 | 0.063 | 0.34696950 | F7-8V | 0.50 | 0.076 | 0.010 | 0.022 | 7.80 | 0.576 | 0.010 | 7.048 | 0.242 | 0.044 | 4.143 | 4.108 | 3.413 | 3.378 |
| YY Eri | 17.63 | 0.067 | 0.32150003 | G5V | 0.68 | -0.006 | 0.000 | 0.020 | 8.10 | 0.674 | 0.000 | 7.031 | 0.337 | 0.106 | 4.372 | 4.331 | 3.303 | 3.262 |
| IS CMa | 9.80 | 0.071 | 0.61698000 | F3V | 0.38 | -0.008 | 0.010 | 0.012 | 6.96 | 0.372 | 0.010 | 6.619 | 0.151 | 0.071 | 1.931 | 1.886 | 1.612 | 1.567 |
| CP Hyi | 8.20 | 0.072 | 0.47940600 | F0V | 0.32 | 0.027 | 0.016 | 0.019 | 7.80 | 0.347 | 0.016 | 7.187 | 0.105 | 0.099 | 2.367 | 2.320 | 1.789 | 1.743 |
| YY CrB | 11.10 | 0.075 | 0.37656400 | F8V | 0.53 | 0.092 | 0.010 | 0.006 | 8.48 | 0.622 | 0.010 | 7.640 | 0.234 | 0.097 | 3.726 | 3.675 | 2.908 | 2.857 |
| V757 Cen | 13.83 | 0.078 | 0.34316916 | F9V | 0.56 | 0.084 | 0.020 | 0.022 | 8.30 | 0.644 | 0.020 | 7.336 | 0.304 | 0.109 | 3.996 | 3.941 | 3.077 | 3.022 |
| FX Eri | 13.33 | 0.078 | 0.29234500 | G9: | 0.78 | -0.007 | – | 0.005 | 9.56 | 0.773 | 0.000 | 8.152 | 0.407 | 0.108 | 5.239 | 5.184 | 3.831 | 3.776 |
| RR Cen | 9.46 | 0.087 | 0.60569200 | F0V | 0.32 | 0.086 | 0.030 | 0.086 | 7.27 | 0.406 | 0.086 | 6.765 | 0.113 | 0.078 | 1.951 | 1.882 | 1.636 | 1.567 |
| GM Dra | 9.84 | 0.087 | 0.33874120 | F5V | 0.45 | 0.059 | 0.030 | 0.013 | 8.66 | 0.509 | 0.030 | 7.736 | 0.252 | 0.043 | 3.601 | 3.533 | 2.744 | 2.675 |
| V535 Ara | 8.49 | 0.101 | 0.62930107 | A8V: | 0.27 | 0.065 | 0.020 | 0.020 | 7.17 | 0.335 | 0.020 | 6.989 | 0.149 | 0.021 | 1.848 | 1.753 | 1.711 | 1.616 |
| TY Men | 5.65 | 0.106 | 0.46166680 | A3/5V | 0.08 | 0.174 | 0.030 | 0.087 | 8.08 | 0.254 | 0.104 | 7.597 | 0.088 | 0.075 | 1.623 | 1.518 | 1.370 | 1.265 |
| V918 Her | 8.28 | 0.107 | 0.57481000 | A7V | 0.20 | 0.077 | – | 0.128 | 7.31 | 0.277 | 0.077 | 6.703 | 0.095 | 0.013 | 1,769 | 1.662 | 1.332 | 1.225 |
| SX Crv | 10.33 | 0.111 | 0.31662090 | F6V | 0.48 | 0.080 | 0.040 | 0.022 | 8.99 | 0.560 | 0.040 | 7.927 | 0.267 | 0.075 | 4.053 | 3.937 | 3.079 | 2.963 |
| WY Hor | 8.34 | 0.113 | 0.39894000 | G2IV/V | 0.63 | 0.103 | – | 0.006 | 9.39 | 0.733 | 0.103 | 8.335 | 0.321 | 0.105 | 3.798 | 3.678 | 2.971 | 2.850 |
| EX Leo | 9.31 | 0.113 | 0.40860250 | F6V | 0.48 | 0.049 | 0.000 | 0.015 | 8.13 | 0.529 | 0.000 | 7.332 | 0.217 | 0.068 | 3.095 | 2.974 | 2.297 | 2.176 |
| OQ Vel | 5.07 | 0.115 | 0.58133800 | A3IV | 0.08 | 0.100 | – | 0.116 | 7.67 | 0.180 | 0.100 | 7.323 | 0.037 | 0.068 | 1.010 | 0.885 | 0.884 | 0.759 |
| NN Vir | 8.90 | 0.120 | 0.48071484 | F0/1V | 0.32 | 0.087 | 0.000 | 0.017 | 7.60 | 0.407 | 0.000 | 7.060 | 0.126 | 0.114 | 2.484 | 2.347 | 1.944 | 1.807 |
| V2377 Oph | 9.46 | 0.121 | 0.42540100 | G0/1V | 0.60 | 0.056 | 0.029 | 0.022 | 8.45 | 0.656 | 0.029 | 7.350 | 0.275 | 0.058 | 3.380 | 3.239 | 2.344 | 2.204 |
| VZ Psc | 15.68 | 0.123 | 0.26125918 | K5V | 1.15 | 0.120 | 0.000 | 0.026 | 10.15 | 1.270 | 0.000 | 8.158 | 0.576 | 0.176 | 6.273 | 6.127 | 4.281 | 4.135 |
| V351 Peg | 6.85 | 0.125 | 0.59329700 | A8V | 0.27 | 0.074 | – | 0.025 | 7.92 | 0.344 | 0.074 | 7.266 | 0.099 | 0.038 | 2.019 | 1.869 | 1.529 | 1.378 |
| TV Pic | 4.70 | 0.125 | 0.85198700 | A2V | 0.05 | 0.092 | – | 0.010 | 7.37 | 0.142 | 0.092 | 7.096 | 0.027 | 0.072 | 0.597 | 0.446 | 0.527 | 0.376 |
| V870 Ara | 9.23 | 0.134 | 0.39978000 | F8 | 0.53 | 0.186 | – | 0.026 | 8.80 | 0.716 | 0.026 | 7.741 | 0.264 | 0.089 | 3.722 | 3.545 | 2.720 | 2.544 |
| V839 Cen | 10.93 | 0.139 | 0.33093400 | G2: | 0.63 | 0.019 | – | 0.016 | 8.82 | 0.649 | 0.019 | 8.315 | 0.268 | 0.146 | 4.146 | 3.955 | 3.683 | 3.492 |
| V386 Pav | 6.52 | 0.141 | 0.55184100 | A9V | 0.30 | 0.010 | – | 0.022 | 8.28 | 0.310 | 0.010 | 7.759 | 0.101 | 0.091 | 2.517 | 2.320 | 2.019 | 1.821 |
1: intrinsic color, 2: Observed minus intrinsic colors, 3: taken from literature, 4: based on Schlegel et al. (1998), 5: Observed color, 6: Adopted color excess
a: Color excess of observed minus intrinsic colors, b: Rucinski (2006), c: Nordström et al. (2004), d: Rucinski & Duerbeck (1997), e: Schlegel et al. (1998)
3 Calibrations and discussions
3.1 PLC relation according to uncorrected Hipparcos parallaxes
There were 40 contact binaries used by Rucinski & Duerbeck (1997) when establishing former PLC relation. Only 11 of them ( CrA, AE Phe, V759 Cen, V757 Cen, RR Cen, GR Vir, YY Eri, V535 Ara, TY Men, SX Crv, VZ Psc) are retained in our final calibration sample (Table 2). The others are eliminated either because they are members of multiple systems or their parallax errors are out of the acceptable limits of this study.
In the first step, we were curious if the coefficients of the PLC relation by Rucinski & Duerbeck (1997) would change. Therefore, the uncorrected of the W UMa stars in the calibration list are used in a regression analysis, which uses least squares fit for determining the three coefficients appearing in the PLC relation. The regression analysis produced similar coefficients. Therefore, the PLC relation of Rucinski & Duerbeck (1997) were kept as the reference relation with LK bias (uncorrected).
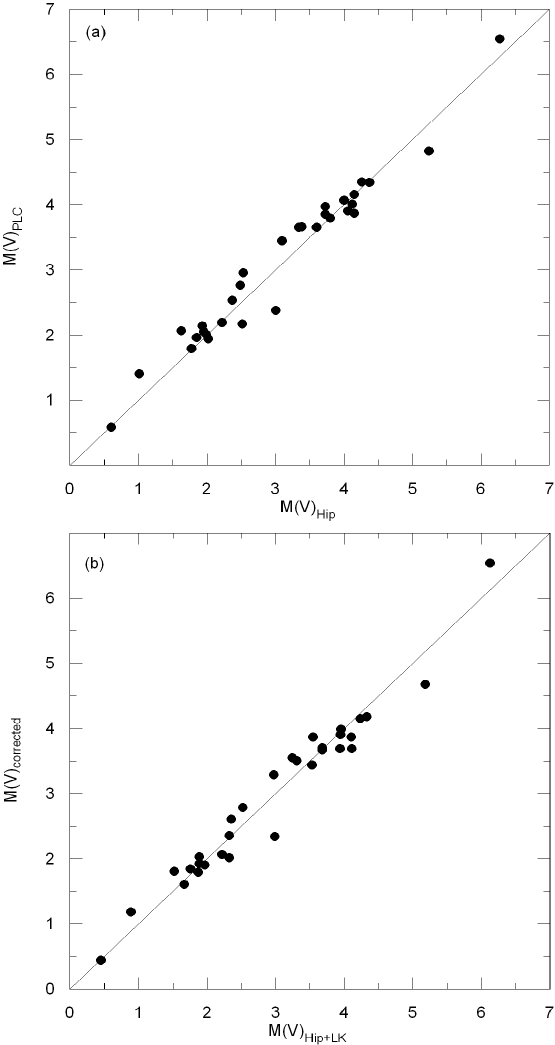
Fig. 4a displays the absolute visual magnitudes which are predicted by the PLC relation of Rucinski & Duerbeck (1997) against the absolute visual magnitudes from the Hipparcos parallaxes directly. According to the regression analysis, the correlation coefficient and the standard deviation from the diagonal is .
So, it can be concluded that having only more accurate parallaxes () than the original sample () of Rucinski & Duerbeck (1997), the result does not justify re-calibrating the PLC relation, but only confirms an existing relation.
3.2 PLC relation according to LK bias corrected parallaxes
Using the corrected absolute magnitudes (), orbital periods () and the intrinsic colors determined from the observed colors and adopted color excesses (), of the stars in Table 2, the coefficients of the linear equation
| (10) |
have been determined as , and by a regression analysis with a correlation coefficient and standard deviation . According to the regression analysis it can be concluded that the internal error of the new relation is mag. That is, in a case if periods and intrinsic colors are errorless, then the standard error of predicted is expected to be mag. The standard error of should become larger if errors are introduced through orbital periods and intrinsic colors appearing in the relation.
3.3 Comparing PLC relations with and without LK bias
Comparing PLC relations of same format with and without LK bias may help to analyze and study the effect of LK bias on the PLC relation. There could be two basic types of comparison: The two relations may be compared on their own grounds to see how good their predicting powers are according to their own conditions; or they could be compared to see what the difference is in predicting true absolute magnitudes.
Consequently, for the first type of comparison, the
points are plotted against the corrected absolute magnitudes coming from the
corrected parallaxes in Fig. 4b. Although, the correlation coefficient is slightly better
() and the standard deviation is smaller, the apparency of Fig. 4b is not
much different Fig. 4a. Both figures are consistent with each other. Thus, LK correction is
justified.
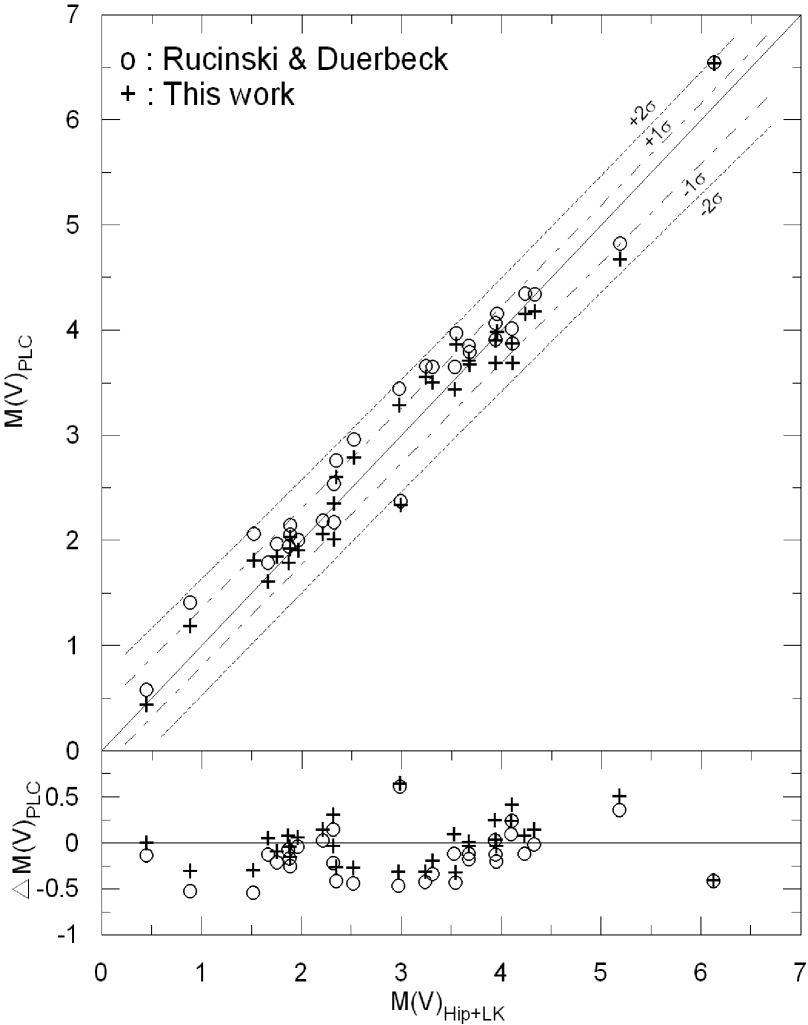
The difference between the two PLC relations can be observed better in Fig. 5 where the predictions of both relations are plotted against the corrected absolute magnitudes. Although both data sets remain within the reliability limit, it is clearly shown in Fig. 5 that the PLC relation of Rucinski & Duerbeck (1997) systematically underestimates the absolute brightness of the same sample stars.
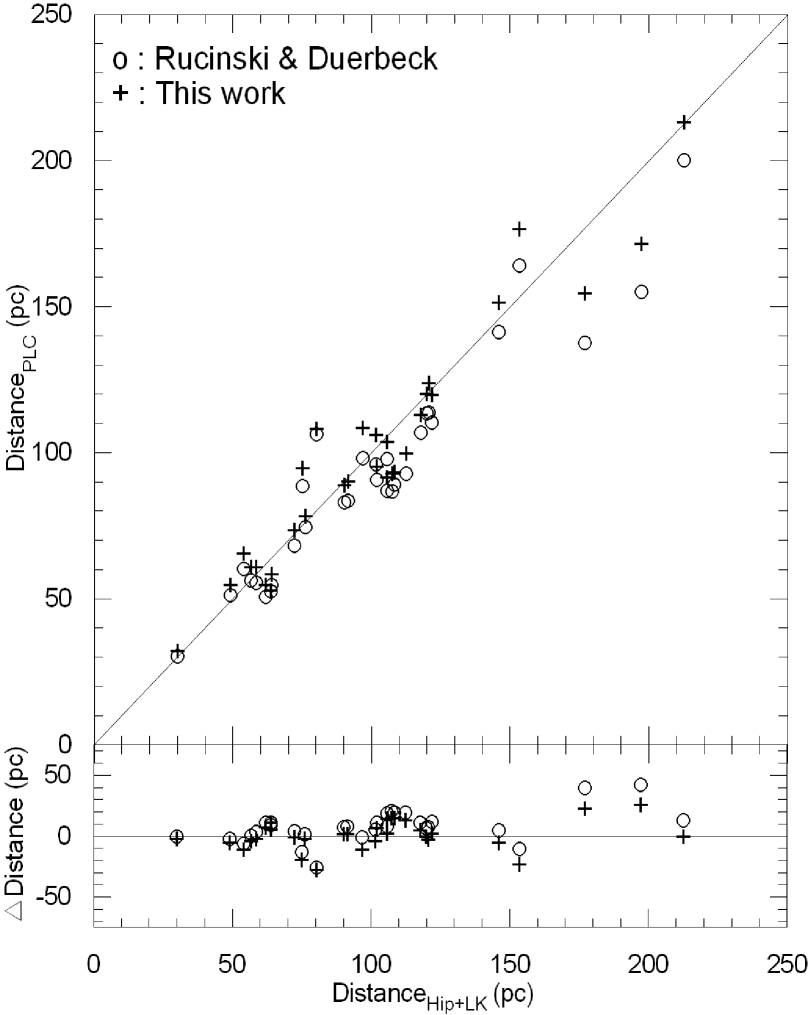
A similar comparison can be done on a distance scale rather than a magnitude scale. Fig. 6 displays such a comparison. It is clearly shown that the PLC relation of Rucinski & Duerbeck (1997) underestimates the distances with respect to the predictions of the PLC relation from this study especially when the distances are large. If the distances are smaller than 100 pc, apparently, the difference becomes negligible. This must be because; LK corrections become noticeable if and increases as increases.
3.4 Calibrating PLC relation using 2MASS data
PLC relation of W UMa stars could be calibrated using different color indices and color excesses. A PLC relation using already exists (Rucinski, 2004). The advantage of shifting PLC relation towards the infrared colors is obvious; extinction is less, so uncertainty of interstellar absorption becomes relatively reduced.
The method of calibration is the same. Absolute magnitudes, and then intrinsic colors through (8) and (9) were computed using the data in Table 2 for the same sample (31 stars). Finally a regression analysis is done for determining the numerical coefficients. It has been tried for many different forms of the relation such as; with one color or both and and even to include color besides the terms of including a free constant. The highest correlation have been found with the following
| (11) |
where , , and , which gives a correlation coefficient and a standard deviation mag. Consequently, the internal error of the relation is mag. Since best correlation was achieved by using two rather than a single color term, it seems using two color terms increases the correlation. This is expected because each color term contributes to improving the correlation. The constant term which has an absolute value comparable to its uncertainty may not be real so it can be avoided in the relation.
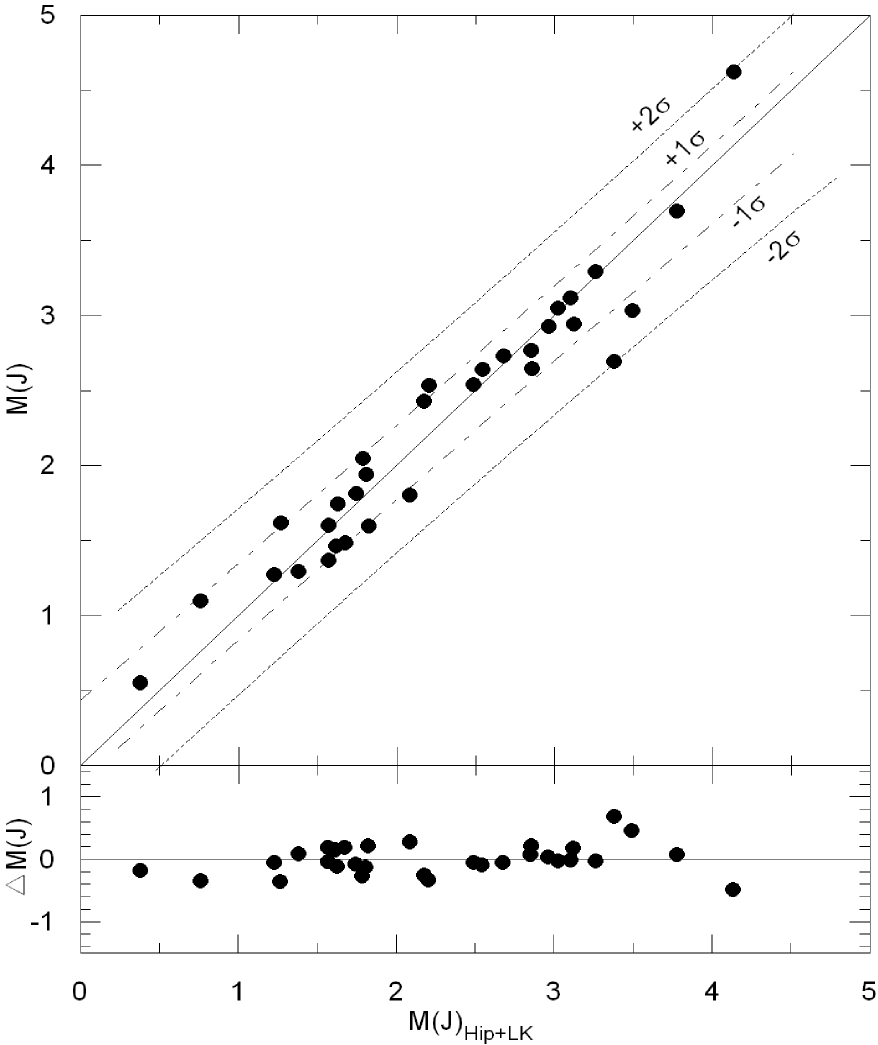
The predicted values by Eq. 11 are plotted against LK corrected absolute magnitudes (Fig. 7). Despite, 2MASS data are single epoch observations, which were not guaranteed to be at the maximum brightness phase of the systems, the calibration gave reliable relation which can be used in predicting the true distances of W UMa stars from their periods and infrared colors. It is even more interesting that the standard deviation of data and the internal error of the PLC relation in infrared are slightly smaller than the standard deviation and internal error of the PLC relation in the visual although the PLC relation is slightly less correlated at infrared.
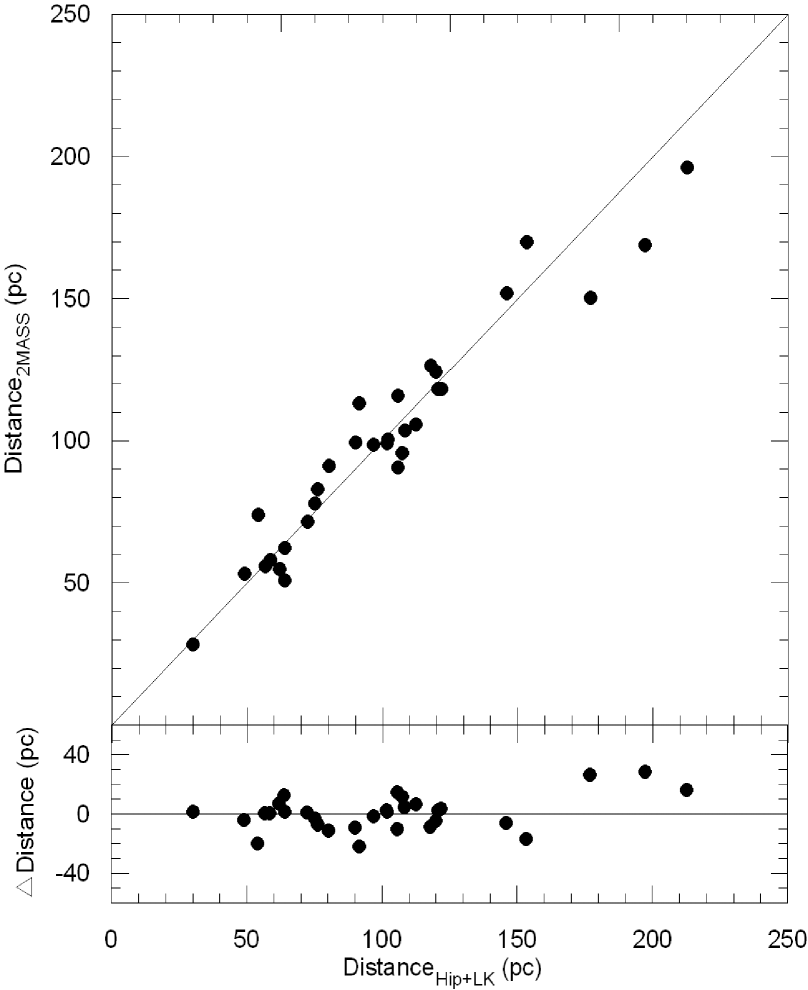
The distance predictions of the PLC relation are compared to LK bias corrected distances in Fig. 8. The internal error of the relation is . The PLC relation at infrared could have been improved more if maximum brightnesses at these infrared colors were available.
4 Conclusions
In this study, a statistical bias, which is classically known as Lutz-Kelker (LK) bias, has been introduced to the PLC relation of W UMa stars. Since parallax errors remain after a LK bias correction, studies such as ours, should still be careful in setting up an upper limit on the reliability of input parallax data. In this study, we have preferred to work with parallax data more accurate than 15%.
Using LK corrected parallaxes (or distances), we have re-calibrated the classical PLC relation of Rucinski & Duerbeck (1997). The new relation has been compared with the classical relation. It has been found that old and new relations are nearly equivalent in predicting a distance up to about 100 parsecs. The difference between the predictions increases and may become intolerable as the distances of stars increase. The new relation is valid in the ranges (, and ).
We have also produced a PLC relation which can be used by 2MASS data. Despite 2MASS data are single epoch observations, which are not guaranteed to be at the maximum brightness phase of the W UMa stars in the calibration sample (Table 2), the established relation has been found surprisingly consistent and reliable to predict LK corrected distances. This new relation is valid in the ranges (, , and ). Observers are encouraged to obtain light and color curves of W UMa stars at 2MASS colors. If the apparent magnitudes at maximum brightness phases of W UMa stars are provided with 2MASS colors, the current PLC relation using infrared colors could be improved to provide more reliable distances.
5 Acknowledgments
This work has been partially supported by TÜBİTAK 104T508 and 106T688. We would also like to thank Prof. Dr. Utku Coşkunoğlu and Başar Coşkunoğlu correcting the english grammer and linguistics of the manuscript. This research has made use of the SIMBAD database, operated at CDS, Strasbourg, France. This publication makes use of data products from the Two Micron All Sky Survey, which is a joint project of the University of Massachusetts and the Infrared Processing and Analysis Center/California Institute of Technology, funded by the National Aeronautics and Space Administration and the National Science Foundation. This research has made use of the NASA/IPAC Extragalactic Database (NED) which is operated by the Jet Propulsion Laboratory, California Institute of Technology, under contract with the National Aeronautics and Space Administration.
References
- Ak et al. (2007) Ak, T., Bilir, S., Ak, S., Retter, A.: 2007, NewA 12, 446
- Bahcall & Soneira (1980) Bahcall, J. N., Soneira, R. M.: 1980, ApJS 44, 73
- Bilir et al. (2005) Bilir, S., Karataş, Y., Eker, Z., Demircan, O.: 2005, MNRAS 357, 497
- Bilir, Güver & Aslan (2006) Bilir, S., Güver, T., Aslan, M.: 2006, AN 327, 693
- Bilir et al. (2008) Bilir, S., Ak, S., Karaali, S., Cabrera-Lavers, A., Chonis, T. S., Gaskell, C. M.: 2008, MNRAS 384, 1178
- Brown et al. (1997) Brown, A. G. A., Arenou, F., van Leeuwen, F., Lindegren, L., Luri, X.: 1997, Proceedings of the ESA Symposium “Hipparcos - Venice 97”, 13-16 May, Venice, Italy, ESA SP-402 (July 1997), p.63
- Cardelli, Clayton & Mathis (1989) Cardelli, J. A., Clayton, G. C., Mathis, J. S.: 1989, ApJ 345, 245
- Cutri et al. (2003) Cutri, R. M. et al.: 2003, VizieR On-Line Data Catalog: II/246, Originally published in: University of Massachusetts and Infrared Processing and Analysis Center
- Davidge & Milone (1984) Davidge, T. J., Milone, E. F.: 1984, ApJS 55, 571
- ESA (1997) ESA: 1997, The Hipparcos and Tycho Catalogues, ESA SP-1200. ESA, Noordwijk
- Fiorucci & Munari (2003) Fiorucci, M., Munari, U.: 2003, A&A 401, 781
- Gettel, Geske & Mckay (2006) Gettel, S. J., Geske, M. T., Mckay, T. A.: 2006, AJ 131, 621
- Jerzykiewicz (2001) Jerzykiewicz, M.: 2001, AcA 51, 151
- Lutz & Kelker (1973) Lutz, T. E., Kelker, D. H.: 1973, PASP 85, 573
- Lutz & Kelker (1975) Lutz, T. E., Kelker, D. H.: 1975, PASP 87, 617
- Maiz Apellaniz (2005) Maiz Apellaniz, J.: 2005, Proceedings of the Gaia Symposium “The Three-Dimensional Universe with Gaia” (ESA SP-576). Held at the Observatoire de Paris-Meudon, 4-7 October 2004. Editors: C. Turon, K.S. O Flaherty, M. A. C. Perryman, p.179
- Mendez & van Altena (1998) Mendez, R. A., van Altena, W. F.: 1998, A&A 330, 910
- Nordström et al. (2004) Nordström, B., Mayor, M., Andersen, J., Holmberg, J., Pont, F., Jorgensen, B. R., Olsen, E. H., Udry, S., Mowlavi, N.: 2004, A&A 418, 989
- Norgaard-Nielsen (1978) Norgaard-Nielsen, H.U.: 1978, A&A 65, 287
- Oudmaijer, Groenewegen & Schrijver (1998) Oudmaijer, R. D., Groenewegen, M. A. T., Schrijver, H.: 1998, MNRAS 294L, 41
- Pribulla, Kreiner & Tremko (2003) Pribulla, T., Kreiner, J. M., Tremko, J.: 2003, CoSka 33, 38
- Pribulla & Rucinski (2006) Pribulla, T., Rucinski, S. M.: 2006, AJ 131, 298
- Rucinski & Kaluzny (1981) Rucinski, S. M., Kaluzny, J.: 1981, AcA 31, 409
- Rucinski (1983) Rucinski, S. M.: 1983, A&A 127, 84
- Rucinski (1985) Rucinski, S. M.: 1985, in Interacting Binary Stars, eds. J. E. Pringle and R. A. Wade (Cambridge, Cambridge Univ. Press), p.85 and 113
- Rucinski (1993) Rucinski, S. M.: 1993, in the Realm of Interacting Binary Stars, eds. J. Shade, Y. Kondo and G. McClusky (Dordrecht, Kluwer), p.11
- Rucinski (1994) Rucinski, S. M.: 1994, PASP 106, 462
- Rucinski (1995) Rucinski, S. M.: 1995, PASP 107, 648
- Rucinski & Duerbeck (1997) Rucinski, S. M., Duerbeck, H. W.: 1997, PASP 109, 1340
- Rucinski (1998) Rucinski, S. M.: 1998, AJ 116, 2998
- Rucinski (2000) Rucinski, S. M.: 2000, AJ 120, 319
- Rucinski, Lu & Mochnacki (2000) Rucinski, S. M., Lu, W., Mochnacki, S. W.: 2000, AJ 120, 1133
- Rucinski et al. (2001) Rucinski, S. M., Lu, W., Mochnacki, S. W., Ogloza, W., Stachowski, G.: 2001, AJ 122, 1974
- Rucinski (2002) Rucinski, S. M.: 2002, PASP 114, 1124
- Rucinski (2004) Rucinski, S. M.: 2004, NewAR 48, 703
- Rucinski (2006) Rucinski, S. M.: 2006, MNRAS 368, 1319
- Schlegel et al. (1998) Schlegel, D. J., Finkbeiner, D. P., Davis, M.: 1998, ApJ 500, 525
- Skrutskie et al. (2006) Skrutskie, M. F., et al.: 2006, AJ 131, 1163
- Smith (1987a) Smith, H. Jr.: 1987a, A&A 171, 336
- Smith (1987b) Smith, H. Jr.: 1987b, A&A 188, 233
- Smith (2003) Smith, H. Jr.: 2003, MNRAS 338, 891