Using Ultra Long Period Cepheids to Extend the Cosmic Distance Ladder to 100 Mpc and Beyond
Abstract
We examine the properties of 18 long period ( days) and very luminous (median absolute magnitude of M and M) Cepheids to see if they can serve as an useful distance indicator. We find that these Ultra Long Period (ULP) Cepheids have a relatively shallow Period-Luminosity (PL) relation, so in fact they are more “standard candle”-like than classical Cepheids. In the reddening-free Wesenheit index, the slope of the ULP PL relation is consistent with zero. The scatter of our sample about the WI PL relation is mag, approaching that of classical Cepheids and Type Ia Supernovae. We expect this scatter to decrease as bigger and more uniform samples of ULP Cepheids are obtained. We also measure a non-zero period derivative for one ULP Cepheid (SMC HV829) and use the result to probe evolutionary models and mass loss of massive stars. ULP Cepheids main advantage over classical Cepheids is that they are more luminous, and as such show great potential as stellar distance indicators to galaxies up to Mpc and beyond.
Subject headings:
Cepheids — stars: distances — stars: mass loss — distance scale1. Introduction
A reliable method of measuring the physical distance to astrophysical objects has always been sought after in observational astronomy (e.g., Bessel, 1839). In the era of “precision cosmology”, the need for accurate physical distance measurements has been amplified (e.g., Spergel et al., 2003; Riess et al., 2004; Tegmark et al., 2004). Accurate and precise distance indicators hold the key to pinning down the value of the Hubble constant and many other cosmological parameters (see discussion in, e.g., Macri et al., 2006). A number of methods have been employed to determine extragalactic distances, with varying degree of success (e.g., Freedman et al., 2001). The construction and reliability of the “cosmological distance ladder” depends crucially on Cepheid variables being able to provide precise and accurate distances to nearby (Mpc) galaxies. The quest for such distances has been an arduous journey for almost a hundred years, with many dramatic twists and turns (for a review of early years, see Baade, 1956, for a recent review see, e.g., Macri 2005).
Cepheids offer several advantages as distance indicators. Massive stars make an excursion through the instability strip and most, if not all, of them become Cepheid variables. These variable stars are relatively bright ( for a day Cepheid) and often have large brightness variations (amplitude mag) with a characteristic “saw-tooth” shaped light curve. Their intrinsic brightness, combined with their light curve shape and colors, make them easy to distinguish from other classes of variable stars. As a result, Cepheids have been detected and studied in a significant number of star-forming galaxies. The physical mechanisms underlying Cepheid pulsation are well understood, including the observed tight period-luminosity (PL) relationship (e.g., Chiosi et al., 1993). The small scatter in the PL relation allows distance measurements precise to (e.g., Macri et al., 2006). For these reasons, Cepheids are commonly used to calibrate other distance indicators, forming the base of the cosmological distance ladder.
Despite their many advantages as a distance indicator, Cepheid distances also have some shortcomings. Most Cepheids have an intrinsic brightness of , so with the current instrumentation they can be only used to measure distances to Mpc (the largest Cepheid distance in Freedman et al. 2001 is Mpc). Observations of Cepheids in distant galaxies are also hindered by blending (Mochejska et al., 2000)— as young stars, Cepheids live in close proximity to the crowded star-forming regions of their host galaxies, and are thus likely to have another star of similar brightness on the scale of a typical instrumental point-spread-function (PSF). The effect of blending becomes worse as the square of the distance to the host galaxy (Stanek & Udalski, 1999), again limiting the usefulness of Cepheids to measuring distances Mpc even with high resolution instruments such as the Hubble Space Telescopes (HST). Ideally, we would like to find a distance indicator that shares the good properties of classical Cepheids, but is even more luminous, allowing us to observe it further away and be less susceptible to blending. In this paper we discuss such a possible distance indicator, namely Ultra Long Period (ULP) Cepheids.
We define ULP Cepheids as fundamental mode Cepheids with pulsation periods greater than 80 days. Several such Cepheids have been already discovered in the pioneering study of Leavitt (1908). However, ULP Cepheids have traditionally been ignored for distance measurements as they are PL outliers. Indeed, the observed PL relation flattens for Cepheids with periods greater than 100 days (e.g., Grieve et al., 1985; Freedman et al., 1992). Grieve et al. (1985) suggests that long period Leavitt Variables could be used for distance measures— unfortunately that idea has not permeated through the community. We argue that the flattening of the PL at long periods actually improves the usefulness of ULP Cepheids as distance indicators because it makes them a good standard candle in the traditional sense. We note several additional advantages of ULP Cepheids over lower period Cepheids due to their increased luminosity. ULP Cepheids could be used as a stellar distance measure to the Hubble Flow (up to Mpc)— several times the current observational limit. In Section 2 we describe our sample compiled from the literature. The ULP Cepheid PL relation is discussed in Section 3. Section 4 demonstrates how ULP Cepheids may provide the additional benefit of testing massive stellar evolutionary models. We summarize our results in Section 5.
2. Sample

| ID | Host Galaxy | RA | DEC | P | WI | (m-M)0 | O/H | References | ||||||
|---|---|---|---|---|---|---|---|---|---|---|---|---|---|---|
| (J2000.0) | (J2000.0) | (days) | (mag) | (mag) | (mag) | (mag) | (mag) | (mag) | (mag) | (mag) | dex | |||
| (1) | (2) | (3) | (4) | (5) | (6) | (7) | (8) | (9) | (10) | (11) | (12) | (13) | (14) | (15) |
| LMC HV883 | LMC | 1,2,3 | ||||||||||||
| LMC HV2447 | LMC | 1,2,3 | ||||||||||||
| LMC HV2883 | LMC | 1,2,3 | ||||||||||||
| LMC HV5497 | LMC | 1,2,3 | ||||||||||||
| SMC HV1956 | SMC | 5,2,3;4 | ||||||||||||
| SMC HV821 | SMC | 1,6,3;4 | ||||||||||||
| SMC HV829 | SMC | 1,6,3;4 | ||||||||||||
| NGC 6822-1 | NGC 6822 | 7,8,9 | ||||||||||||
| NGC 55-1 | NGC 55 | 10,11,12 | ||||||||||||
| NGC 55-2 | NGC 55 | 10,11,12 | ||||||||||||
| NGC 55-3 | NGC 55 | 10,11,12 | ||||||||||||
| NGC 55-4 | NGC 55 | 10,11,12 | ||||||||||||
| NGC 55-5 | NGC 55 | 10,11,12 | ||||||||||||
| NGC 300-1 | NGC 300 | 13,14,15 | ||||||||||||
| NGC 300-2 | NGC 300 | 13,14,15 | ||||||||||||
| NGC 300-3 | NGC 300 | 13,14,15 | ||||||||||||
| I Zw 18-1 | I Zw 18 | 16,17 | ||||||||||||
| I Zw 18-2 | I Zw 18 | 16,17 |
Note. — ULP Cepheids in our sample grouped by host galaxy. (1): Cepheid Identification. (2): Host galaxy name. (3,4): Right Ascension and Declination in J2000 coordinates. (5): Period in days. (6): Apparent mean magnitude of Cepheid. (7): Apparent color of Cepheid. (8): Apparent Wesenheit magnitude (definition in text). (9): Reddening towards host galaxy. (10): Reddening-free distance modulus. (11): Absolute magnitude. (12): Absolute color. (13): Absolute Wesenheit magnitude. (14): Metallicity: O/H. (15): First reference is for photometry, reddening, and distance modulus (except where noted in text). Second reference refers to metallicity. If third reference is present, its reddening and distance modulus measurements supercedes the first.
References. — References: 1. Freedman et al. (1985); 2. Pagel et al. (1978); 3. Udalski et al. (1999); 4. Hilditch et al. (2005) and Keller & Wood (2006); 5. Pojmanski (1997, ASAS survey); 6. Peimbert & Torres-Peimbert (1976); 7. Pietrzyński et al. (2004); 8. Peimbert et al. (2005); 9. Gieren et al. (2006) 10. Pietrzyński et al. (2006); 11. Tüllmann et al. (2003); 12. Gieren et al. (2008) 13. Gieren et al. (2004); 14. Urbaneja et al. (2005); 15. Gieren et al. (2005); 16. Fiorentino et al. (2008); 17. Skillman & Kennicutt (1993).
We have assembled a sample of ULP Cepheids from the literature and list their reported positions, periods, and mean and magnitudes (see Table 2). We adopt the periods, reddening values, and distance moduli found in these sources except in the case of the Magellanic Clouds (see below). Our primary criteria for selecting the sample was the existence of and data calibrated on the standard Johnson/Kron-Cousins magnitude system using Landolt standards (with the possible exception of the Magellanic Clouds; see below). The ULP distinction is applied to fundamental mode Cepheids with periods greater 80 days. We combed the recent literature for reports of such variable stars.
Magellanic Clouds Our sample includes four LMC and three SMC ULP Cepheids. Freedman et al. (1985) calibrated photoelectric observations of these Cepheids and transformed them to the Johnson/Kron-Cousins standard system. The mean flux-weighted photometry for the six Cepheids reported in Freedman et al. (1985) agrees with the Landolt standard star calibrated results of Moffett et al. (1998) to within mag, suggesting that the standard photometric system calibration is robust. Mean flux-weighted photometry for HV1956 is obtained from the All Sky Automated Survey (ASAS; Pojmanski, 1997) and Moffett et al. (1998). The light curves of six of these ULP Cepheids were obtained from ASAS. HV2883 was not targeted by ASAS, and its light curve photometry was obtained from Madore (1975), van Genderen (1983), and Moffett et al. (1998). Moffett et al. (1998) provide the light curve data for the entire sample. We applied the analysis of variance technique (Schwarzenberg-Czerny, 1989) to the seven Harvard Variable light curves in Figure 1 to obtain the periods listed in Table 2. We adopt total reddening values of mag and mag for the LMC and SMC, respectively (Udalski et al., 1999). We assume a distance modulus (DM) of mag to the LMC for consistency with the sources listed in Table 2. The SMC DM used is mag (Hilditch et al., 2005; Keller & Wood, 2006). The LMC (SMC) hosts ULP Cepheids with periods of 98.6, 109.2, 118.7, and 133.6 (84.4, 127.5, and 210.4) days. The LMC has gas phase oxygen abundance O/H (Pagel et al., 1978) while the SMC is O/H (Peimbert & Torres-Peimbert, 1976).
The Araucaria Project (Pietrzyński et al., 2002) is a photometric survey of Local and Sculptor Group galaxies and their Cepheid populations. The primary goal is to more accurately determine the distances to these galaxies and to characterize the dependence of various stellar distance indicators on metallicity and age. The Araucaria Project has observed ULP Cepheids in the following galaxies.
NGC 55 Five ULP Cepheids were found in NGC 55 (Pietrzyński et al., 2006). Observations were taken with the Optical Gravitation Lensing Experiment (OGLE) detector on the Warsaw 1.3 m telescope at Las Campanas Observatory. They estimate that the calibration procedure used to transform their photometric data from the OGLE filters to the standard system produced errors mag. Follow up observations in the IR revealed a total reddening of mag (Gieren et al., 2008). Their multi-wavelength PL analysis produced a DM to NGC 55 of mag (statistical and systematic errors, respectively). NGC 55 hosts ULP Cepheids with periods of 85.1, 97.7, 112.7, 152.1, and 175.9 days. The oxygen abundance of NGC 55 is O/H (Tüllmann et al., 2003).
NGC 6822 One ULP Cepheid was found in NGC 6822 (Pietrzyński et al., 2004). The filters and telescope used are identical to those of NGC 55 (Pietrzyński et al., 2006). Similarly, the reported calibration error onto the standard system is mag. As in the multi-wavelength follow up study of NGC 6822 (Gieren et al., 2006), we adopt a total reddening of mag. The lone ULP Cepheid in NGC 6822 has a period of 123.9 days. Gieren et al. (2006) calculate a DM to NGC 6822 of mag (statistical and systematic errors, respectively). NGC 6822 has a similar oxygen abundance to NGC 55 of O/H (Peimbert et al., 2005).
NGC 300 Gieren et al. (2004) found three ULP Cepheids in NGC 300. Again, OGLE filters were used for the observations. Their calibration onto the standard system has a reported error mag. A multi-wavelength study of NGC 300 (Gieren et al., 2005) determined a reddening-free DM of mag (statistical and systematic, respectively) using a total reddening of mag. ULP Cepheids of 83.0, 89.1, and 115.8 days are observed in NGC 300. NGC 300 has a strong metallicity gradient; therefore we adopt mean Cepheid radial distance of 4 kpc and apply the averaged gradient of Urbaneja et al. (2005) to obtain a mean oxygen abundance value of O/H.
I Zw 18 Aloisi et al. (2007) discovered three ULP Cepheids from the extremely metal poor galaxy I Zw 18, though they could not confirm one candidate. A follow-up study (Fiorentino et al., 2008) presents flux weighted mean photometry but no data, so the light curves of these objects could not be included in Figure 1. The ULP Cepheids have periods of and days (Table 2). After accounting for extinction mag, Aloisi et al. (2007) use the red giant branch tip to determine a DM of mag while Fiorentino et al. (2008) find a DM of mag via pulsation models. We use the former measurement as it is considered more reliable by the authors. We do not include these two Cepheids in the upcoming PL determination as I Zw 18 is a full dex more metal poor than the other galaxies in this sample (O/H; Skillman & Kennicutt 1993). There is an increasing amount of support for a metallicity dependent PL (e.g. Sandage et al., 2008) and including these Cepheids in our PL analysis would greatly increase the metallicity dispersion of the host galaxies in our sample. We do, however, make use of them to examine the ULP PL relation dependence on metallicity.
2.1. Absolute Photometry
The ULP Cepheid sample and its mean, flux-weighted photometry in the standard system can be found in Table 2. We assume that the photometric error associated with each ULP Cepheid is negligible when compared to the intrinsic scatter of the PL relation. We transform these measurements to absolute magnitudes via:
| (1) |
where is the absolute magnitude in either the or , is the apparent magnitude; is the reddening free distance modulus; and is the extinction in the or . We use the extinction law and (Schlegel et al., 1998). We define the Wesenheit magnitudes as: W (e.g., Udalski et al., 1999).
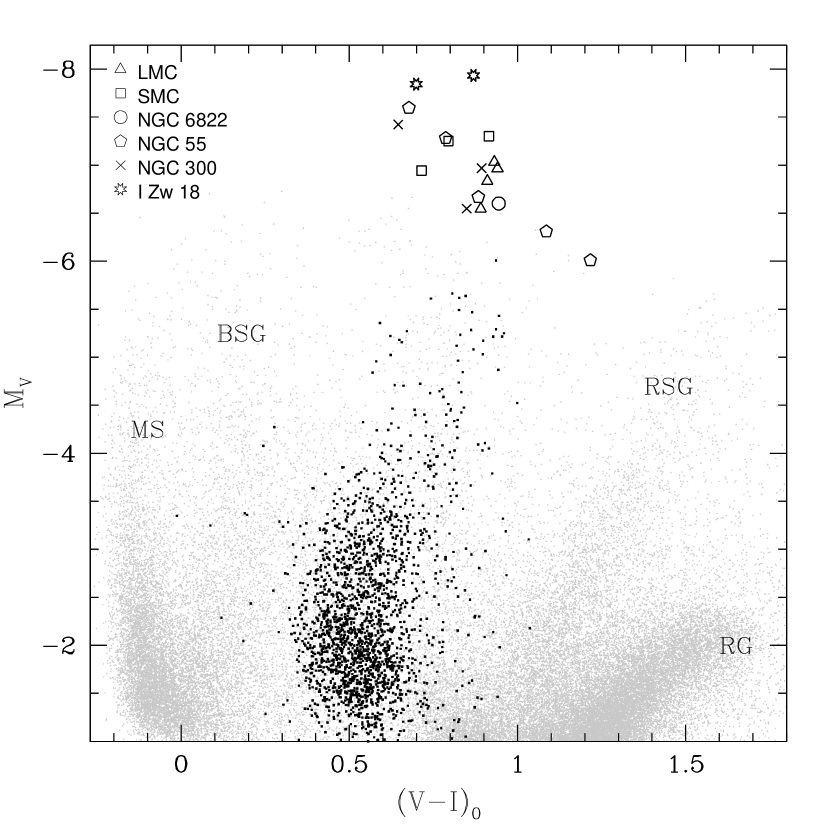
The color-magnitude diagram (CMD) highlights several important characteristics of the ULP Cepheid data set (Figure 2). ULP Cepheids are the luminous counterparts to shorter period Cepheids in color magnitude space. Our sample clearly populates the luminous region of the instability strip. Future Cepheid studies can use ULP Cepheids to push Cepheid distance measurements well beyond the current Mpc limit as our sample’s median absolute magnitude is MI(M (see Section 5). The intrinsic brightness of ULP Cepheids makes them ideal candidates for distance indicators to galaxies where classical Cepheids cannot be observed.
3. Distance Measurements with ULP Cepheids
The Cepheids in our sample have been ignored as distance indicators as they do not follow to the standard period-luminosity relationship (e.g., Freedman et al., 1992). In this section, we examine the characteristics of our ULP Cepheid sample in the period-luminosity plane and explore their viability as a distance indicator. We determine PL relations of our sample in the , , and WI in Section 3.1 while the metallicity dependence of our results is presented in Section 3.2.
3.1. Period Luminosity Relations
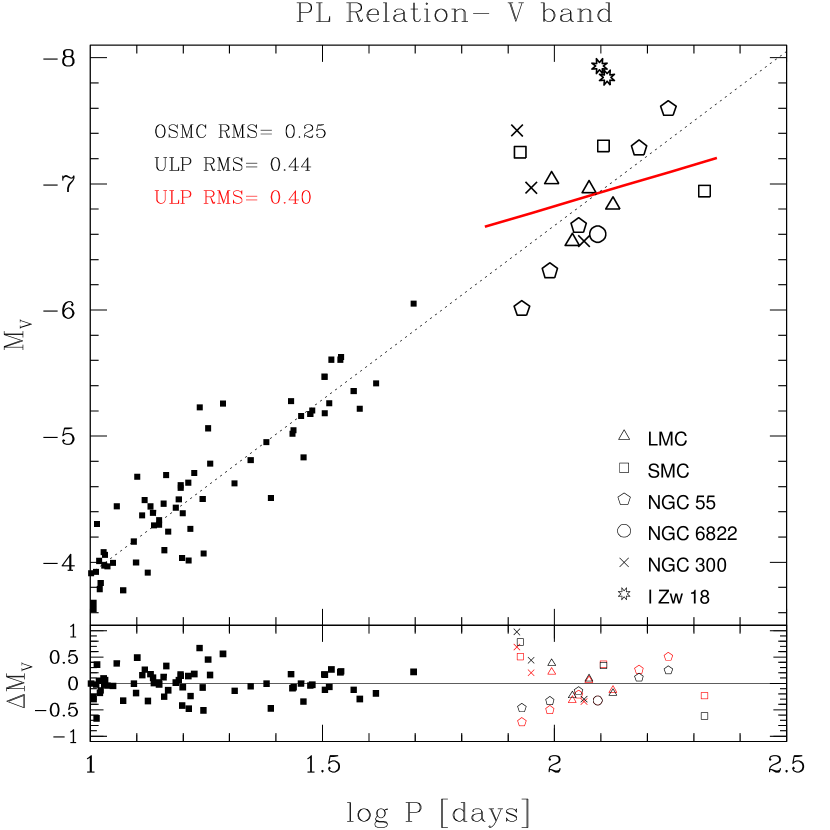
Using the data in Table 2, we construct PL diagrams in , , and WI (Figures 3, 4, 5, respectively). In each case, ULP Cepheids are compared to fundamental mode SMC Cepheids (hereafter, this control sample will be referred to as OGLE Cepheids). The OGLE Cepheid sample contains over fundamental mode Cepheids with periods ranging from to days; however, we only plot the 70 Cepheids with periods of greater than 10 days. To quantify our comparison, we perform a linear fit on both samples in each PL diagram: the slopes of the OGLE Cepheid PL relations (hereafter PLSMC; dotted lines in the figures) are adopted from Udalski et al. (1999) while the intercepts are chosen to minimize chi-square. We employ linear least square fitting of the ULP Cepheid sample to identify their PL relation (hereafter PLULP). We omit errors in distance moduli and extinction in this demonstration as they are small when compared to the overall scatter of the sample. The parameters of these fits and the RMS of each data set in , , and WI are listed in Table 2. Despite our sample ranging in period from 83 to 210 days, ULP Cepheids occupy a small region of luminosity space. We note that the ULP Cepheids from I Zw 18 are not included in this analysis for reasons outlined in Section 2.
The PL diagram is Figure 3. The PLSMC fit has a slope of and the RMS of the OGLE Cepheid sample about this fit is mag. The ULP Cepheid sample has more scatter (RMS= mag) about the PLSMC fit. This discrepancy in scatter has led to the standard practice of removing ULP Cepheids from PL relation studies (e.g., Freedman et al., 1985) and the significant increase in RMS suggests that the ULP Cepheids do not conform to the classical PL relation. If we determine the PL relation of ULP Cepheids alone we find PLULP has a slope () that is flatter than PLSMC (though the slopes are within of each other, see Table 2). The RMS of our sample to PLULP is mag; only marginally better than the ULP Cepheid scatter about the established PLSMC relation. In , the ULP Cepheid sample does not follow a statistically distinct and unique PL.
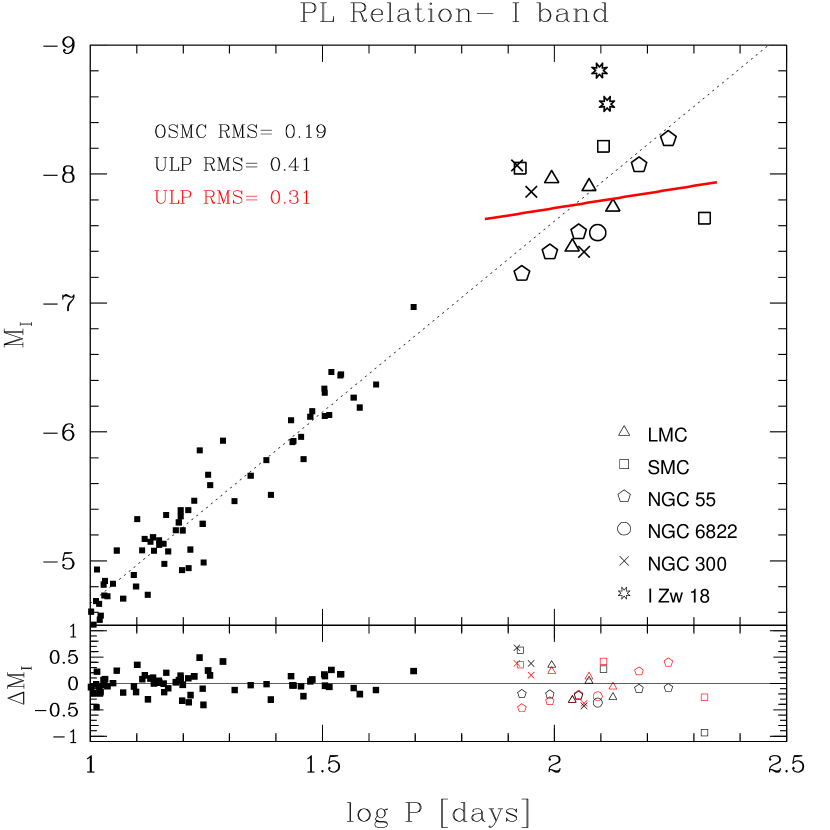
The longer the wavelength the less reddening is a concern. The accuracy of distance measurement with Cepheids increases going from to (PL diagram in Figure 4). PLSMC has a slope of and the OGLE Cepheid sample’s RMS is . The ULP Cepheid scatter about this fit is larger ( mag). The RMS of the ULP Cepheids is reduced to mag when using the PLULP fit (slope). PLULP is approximately five times as flat as PLSMC and the two slopes are distinct at the level. While ULP Cepheids show the same general trends with regards to period, luminosity, and color as normal Cepheids, significant statistical differences between the two populations are apparent in the -band PL relation.
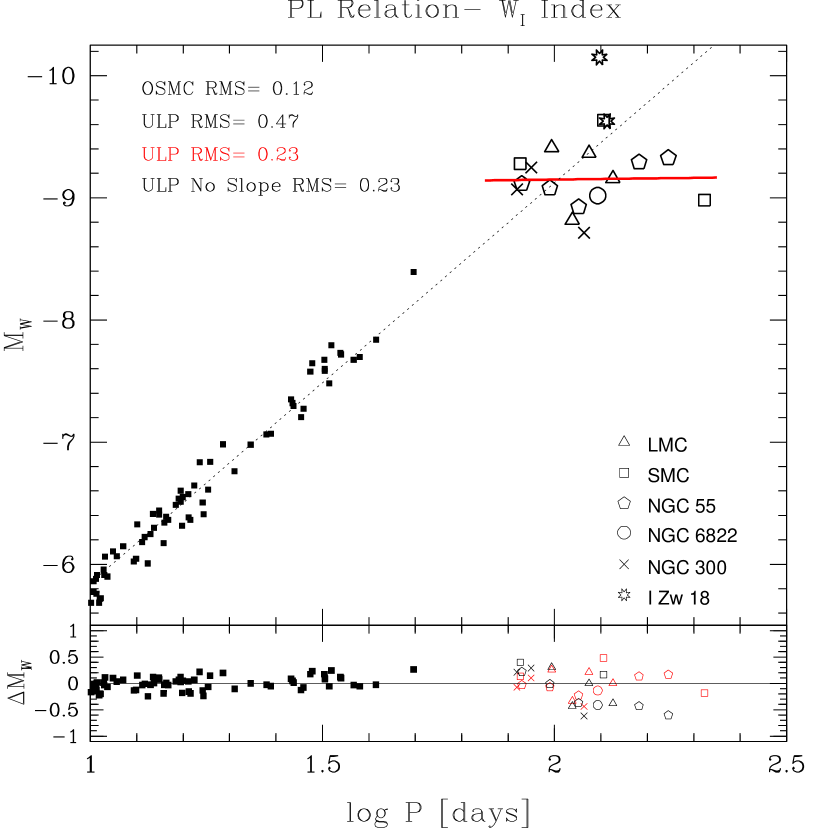
To further reduce the uncertainty associated with reddening in our PL analysis, we repeat the procedure using the reddening-free Wesenheit Index (WI) introduced in Madore & Freedman (1991). The WI PL diagram illuminates the advantages of this reddening-free index for Cepheid distance measurements (Figure 5). The OGLE Cepheid sample has a very tight relation between period and luminosity; with small scatter about the PLSMC fit (slope of ; RMS of only mag). The ULP Cepheid RMS about PLSMC is mag. The -fold increase in scatter implies the ULP Cepheid and the OGLE Cepheid samples do not conform to the same PL relation. The PLULP fit slope is flatter than its PLSMC counterpart at the level ( vs. ) and the ULP fit slope is consistent with zero slope. The scatter of the ULP Cepheids is only mag about the PLULP relation. This scatter is still more than that of the OGLE Cepheid sample; however, the ULP sample is relatively small and heterogeneous. We note that the scatter of ULP Cepheids about the PLULP fit is smaller than that of the OGLE Cepheid sample about the nominal PL relation in and on par with the same in .
Several trends in PL space are apparent as one examines the ULP Cepheid sample in , then , and finally in the WI index. As reddening is reduced, the PLULP parameters are increasingly different from those of PLSMC. The PLULP fit is more shallow as one moves from to WI. In the WI, the PLULP relation reveals that ULP Cepheid luminosity becomes statistically independent of period. In essence, ULP Cepheids behave as bright, standard candles in the reddening-free index.
3.2. Metallicity Dependence
An uncertainty of the Cepheid PL and its derived distance measurement is its sensitivity to the metallicity of the stars (e.g., Freedman & Madore, 1990; Kennicutt et al., 1998). Our sample of ULP Cepheids contains six different host galaxies that span a range of dex in O/H from 7.22 to 8.39, providing an opportunity to investigate the dependence of the ULP Cepheid PL on metallicity. We plot the residual of each ULP Cepheid to the PL fit listed in Table 2 as a function of metallicity (Figure 6). In other studies, linear fits of PL residuals have determined a correction factor, , between and mag dex-1 (see Figure 1 of Romaniello et al., 2008). Recently, Macri et al. (2006) used the metallicity gradient in NGC 4258 to determine mag dex-1 (random and systematic errors, respectively). We overlay this relation (normalized to our data set) in Figure 6 for reference. If the I Zw 18 Cepheids are confirmed, it suggests a stronger correlation between PL offset and metallicity than is evident in lower period Cepheids (e.g., Kochanek, 1997; Kennicutt et al., 1998). However, we note that we do not take into account any reddening or DM errors in this analysis. As such, we do not claim a specific metallicity dependence for ULP Cepheids. We simply demonstrate that the residuals to the PLULP fit are broadly consistent with the range of values presented in the literature to date.
| Relation | Subset | Shorthand | Intercept (b) | Slope (a) | RMS |
|---|---|---|---|---|---|
| (1) | (2) | (3) | (4) | (5) | (6) |
| Period-Luminosity: | SMC Cepheids | PLSMC,V | |||
| Period-Luminosity: | ULPs | PLULP,V | |||
| Period-Luminosity: | SMC Cepheids | PLSMC,I | |||
| Period-Luminosity: | ULPs | PLULP,I | |||
| Period-Luminosity: index | SMC Cepheids | PL | |||
| Period-Luminosity: index | ULPs | PL |
Note. — The fit values of the PL relationships in , , and WI. For each photometric system, we calculate the PL relation of classical SMC (PLSMC) and ULP (PLULP) Cepheids.
At this time we do not apply a metallicity correction to our ULP Cepheid PL relations. Precise gas phase oxygen abundance measurements are difficult to obtain (for a review see Bresolin, 2006) and we adopt a minimum metallicity error of dex. The ULP Cepheid sample must grow in size and the PL analysis must be more detailed to determine if I Zw 18 is an exception and to characterize the functional form of the ULP Cepheid PL sensitivity to metallicity.

4. Using ULP Cepheids to Probe the Evolutionary Models of Massive Stars
Most Cepheid variables cross the instability strip three times (e.g., Bono et al., 2000; Pietrukowicz, 2001). One can determine which crossing a Cepheid is undergoing by measuring its period change, . The first and third crossings are associated with positive while Cepheids exhibit a decreasing period on their second crossing. We investigated the light curves of our sample for signs of period changes by comparing photometry taken over the last years. One ULP Cepheid, HV829, exhibits a negative period change of about 1.5 days. For this Cepheid, we compiled photometric data taken during 1970-1976 from Madore (1975) and van Genderen (1983) and 2000-2004 data from the ASAS catalog (See Figure 7). This result is confirmed by a measured period of days in Payne-Gaposchkin & Gaposchkin (1966) and 85.2 days by Moffett et al. (1998), firmly establishing HV829 as a Cepheid on its second crossing. No other Cepheid in our sample exhibited a measurable period change.
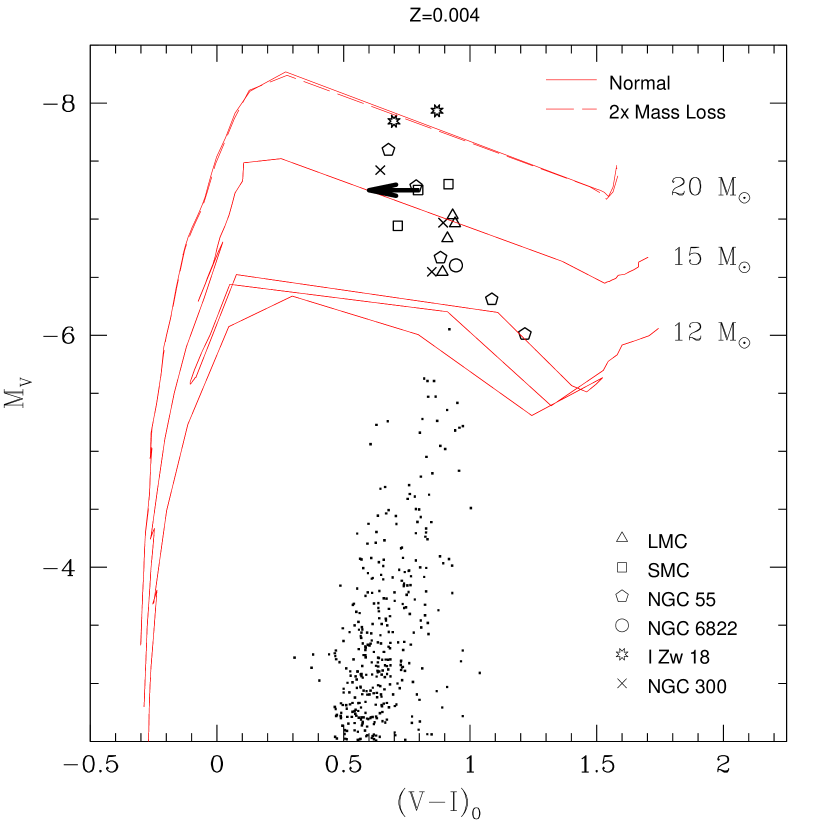
ULP Cepheids occupy a mass range that is ideal to probe high mass evolutionary models along the instability strip. We plot the CMD of our ULP Cepheid sample and overlay the evolutionary tracks of Lejeune & Schaerer (2001) (Figure 8). The location of ULP Cepheids in the color magnitude diagram suggest masses between and , depending on the assumed metallicity (here, we choose SMC metallicity). Our sample clearly probes a mass range unexplored by current Cepheid studies. Note the evolutionary tracks at and only cross the instability strip once, regardless of assumed mass-loss rate. However, we have shown and confirmed that HV829 is undergoing its second crossing; a result at odds with the models. We note that the evolutionary model represents some “mean” behavior based on assumptions of stellar chemical composition, overshooting, and other parameters. Nevertheless, our result is one of the few observational constraints on high mass stellar evolutionary models. HV829 may indicate that massive stars behave differently than expected. Future stellar evolutionary models in this mass regime should take this into account.
5. Discussion
We have presented, for the first time, a collection of Ultra Long Period (days) Cepheids from the literature and demonstrated their viability as a distance indicator. In the past, ULP Cepheids have been ignored as distance indicators, and in fact many stellar variability searches did not extend their cadence and search strategy to allow for their discovery.
In , , and especially reddening-free WI magnitude, ULP Cepheids have a relatively flat PL relation compared to the respective relations for classical Cepheids (Udalski et al., 1999). The dispersion in both the classical and ULP Cepheid populations about their respective PL relationships becomes smaller as one moves from to to WI, and the discrepancy between the slopes increases. Most notably, the slope of the ULP Cepheid WI PL relation is significantly shallower than the standard SMC PL relation (slope is vs. ). The reddening-free Wesenheit index produces the tightest ULP PL relation, with RMS residual of only mag (See Figure 5). Other papers (e.g. Kanbur et al., 2007) have found non-linearites in the PL relationship at lower periods. However, the change in slope seen here is much more dramatic and it is unlikely that it shares a physical connection with the PL changes at lower periods.
Our ULP PL scatter in WI is already less than that of the initial peak brightness vs. absolute magnitude relation for Type Ia Supernova ( mag; Phillips (1993)). A huge amount of effort has been necessary to increase the number of observed Type Ia SNe, refine the calibration technique (e.g., Prieto et al., 2006), and to obtain the low - mag scatter in the relation seen today (e.g., Jha et al., 2007). We expect future observational and theoretical studies of ULP Cepheids will further decrease the already fairly small scatter found in this first analysis.
We strove to find all the known ULP Cepheids in the literature, but our sample is likely not a complete census of ULP Cepheids. We note that the Araucaria Project found ULP Cepheids in three of the five galaxies they observed at the time of this analysis, so the ULP Cepheid sample should grow at a reasonable rate as Cepheid studies are extended to more galaxies and previous data sets are reanalyzed with longer period searches. There is also evidence ULP Cepheids exist in a broad range of metallicities, as preliminary data analysis of a M81 variability survey with the Large Binocular Telescope has already discovered at least one ULP Cepheid (Kochanek, private communication).
In addition to following a fairly tight PL relation, the ULP Cepheids are also very luminous, with a median absolute magnitude in () for our sample of . Using WFPC3, HST can obtain photometry at or (DM — distance of Mpc for the median ULP Cepheid) in about 10 orbits, while only two orbits are needed to reach a DM of . As one would only need a few orbits per epoch, one could detect the median ULP Cepheid (with a period of days) at 100 Mpc and the brightest ULP Cepheids at Mpc in a reasonable amount of time. Since the luminosity of an ULP Cepheid is a weak function of its period, relatively accurate distances would not require as precise period measurements as is needed for classical Cepheids. We encourage future variability proposals to search for Cepheids with periods greater than 100 days.
We note two concerns in using ULP Cepheids for distance measurements. It is obvious from our sample size that ULP Cepheids are far less common than classical Cepheids. The relatively small ULP Cepheid population will make precision distance measurements less practical. As the sample size grows and the ULP Cepheid PL relations become established, a single ULP Cepheid observation may yield distance measurements accurate to . Blending is always a concern in Cepheid studies. Blending can compromise Classical Cepheid measurements as stars of comparable brightness are likely to lie within a single PSF (Mochejska et al., 2000), especially at larger distances. We expect blending to be less of a problem for our ULP Cepheids even at large distances simply because they are so bright and there are very few stars of comparable brightness in a given galaxy. The effect of blending on ULP Cepheid observations will need to be investigated further as the sample is increased.

The data set and analysis herein provides meaningful constraints on theoretical work on Cepheids in this mass and period range. We have shown that ULP Cepheids show strong evidence for a different, flatter PL relation than their lower period cousins. Several papers have modeled Cepheid pulsations and mapped these to theoretical PL relations (e.g., Bono et al., 2002). However, this work has not been reliably extended to the period range of our sample. Pulsation models in this period range would also help determine the intrinsic scatter to the PLULP relation.
Our current sample is not large enough to constrain the sensitivity of the ULP Cepheid PL to metallicity. The PL residuals as a function of metallicity are consistent with the results for shorter period Cepheids ( mag dex-1; Macri et al., 2006). Note that the median O/H value for a galaxy in our sample is about dex lower than the corresponding value for the HST Key Project Cepheid hosts.
Period changes of ULP Cepheids have powerful implications for stellar evolutionary models in this mass regime. We examined photometry from two epochs separated by thirty years to check for evidence of period changes in seven Magellanic Cloud ULP Cepheids. Only one, SMC HV829, showed a significant period change— from to days. The negative period derivative indicates that the Cepheid is undergoing its second crossing. Assuming the metallicity of the SMC, many current evolutionary models do not predict second crossings for Cepheids in this mass range (See Figure 8). Future models should incorporate this observational result as it should place limits on several key input parameters. In addition to their potential as distance indicators, ULP Cepheids provide observational constraints on high mass stellar evolution models.
To summarize, ULP Cepheids, while often dismissed in the past, are potentially a powerful distance indicator, probe of PL metallicity sensitivity, and also a probe of massive star evolutionary models. ULP Cepheids could provide the first direct stellar distance measurements to galaxies in the 50-150 Mpc range, extending the cosmological distance ladder well into the Hubble flow.
References
- Aloisi et al. (2007) Aloisi, A., Clementini, G., Tosi, M., Annibali, F., Contreras, R., Fiorentino, G., Mack, J., Marconi, M., Musella, I., Saha, A., Sirianni, M., & van der Marel, R. P. 2007, ApJ, 667, L151
- Baade (1956) Baade, W. 1956, PASP, 68, 5
- Bessel (1839) Bessel, F. W. 1839, Astronomische Nachrichten, 16, 65
- Bono et al. (2000) Bono, G., Caputo, F., Cassisi, S., Marconi, M., Piersanti, L., & Tornambè, A. 2000, ApJ, 543, 955
- Bono et al. (2002) Bono, G., Groenewegen, M. A. T., Marconi, M., & Caputo, F. 2002, ApJ, 574, L33
- Bresolin (2006) Bresolin, F. 2006, ArXiv Astrophysics e-prints, astroph/0608410
- Chiosi et al. (1993) Chiosi, C., Wood, P. R., & Capitanio, N. 1993, ApJS, 86, 541
- Fiorentino et al. (2008) Fiorentino, G., Clementini, G., Contreras, R., Marconi, M., Musella, I., Tosi, M., Aloisi, A., Annibali, F., & Saha, A. 2008, Memorie della Societa Astronomica Italiana, 79, 461
- Freedman et al. (1985) Freedman, W. L., Grieve, G. R., & Madore, B. F. 1985, ApJS, 59, 311
- Freedman & Madore (1990) Freedman, W. L. & Madore, B. F. 1990, ApJ, 365, 186
- Freedman et al. (2001) Freedman, W. L., Madore, B. F., Gibson, B. K., Ferrarese, L., Kelson, D. D., Sakai, S., Mould, J. R., Kennicutt, Jr., R. C., Ford, H. C., Graham, J. A., Huchra, J. P., Hughes, S. M. G., Illingworth, G. D., Macri, L. M., & Stetson, P. B. 2001, ApJ, 553, 47
- Freedman et al. (1992) Freedman, W. L., Madore, B. F., Hawley, S. L., Horowitz, I. K., Mould, J., Navarrete, M., & Sallmen, S. 1992, ApJ, 396, 80
- Gieren et al. (2006) Gieren, W., Pietrzyński, G., Nalewajko, K., Soszyński, I., Bresolin, F., Kudritzki, R.-P., Minniti, D., & Romanowsky, A. 2006, ApJ, 647, 1056
- Gieren et al. (2005) Gieren, W., Pietrzyński, G., Soszyński, I., Bresolin, F., Kudritzki, R.-P., Minniti, D., & Storm, J. 2005, ApJ, 628, 695
- Gieren et al. (2008) Gieren, W., Pietrzyński, G., Soszyński, I., Bresolin, F., Kudritzki, R.-P., Storm, J., & Minniti, D. 2008, ApJ, 672, 266
- Gieren et al. (2004) Gieren, W., Pietrzyński, G., Walker, A., Bresolin, F., Minniti, D., Kudritzki, R.-P., Udalski, A., Soszyński, I., Fouqué, P., Storm, J., & Bono, G. 2004, AJ, 128, 1167
- Grieve et al. (1985) Grieve, G. R., Madore, B. F., & Welch, D. L. 1985, ApJ, 294, 513
- Hilditch et al. (2005) Hilditch, R. W., Howarth, I. D., & Harries, T. J. 2005, MNRAS, 357, 304
- Jha et al. (2007) Jha, S., Riess, A. G., & Kirshner, R. P. 2007, ApJ, 659, 122
- Kanbur et al. (2007) Kanbur, S. M., Ngeow, C., Nanthakumar, A., & Stevens, R. 2007, PASP, 119, 512
- Keller & Wood (2006) Keller, S. C. & Wood, P. R. 2006, ApJ, 642, 834
- Kennicutt et al. (1998) Kennicutt, Jr., R. C., Stetson, P. B., Saha, A., Kelson, D., Rawson, D. M., Sakai, S., Madore, B. F., Mould, J. R., Freedman, W. L., Bresolin, F., Ferrarese, L., Ford, H., Gibson, B. K., Graham, J. A., Han, M., Harding, P., Hoessel, J. G., Huchra, J. P., Hughes, S. M. G., Illingworth, G. D., Macri, L. M., Phelps, R. L., Silbermann, N. A., Turner, A. M., & Wood, P. R. 1998, ApJ, 498, 181
- Kochanek (1997) Kochanek, C. S. 1997, ApJ, 491, 13
- Leavitt (1908) Leavitt, H. S. 1908, Annals of Harvard College Observatory, 60, 87
- Lejeune & Schaerer (2001) Lejeune, T. & Schaerer, D. 2001, A&A, 366, 538
- Macri (2005) Macri, L. M. 2005, ArXiv Astrophysics e-prints, astro-ph/0507648
- Macri et al. (2006) Macri, L. M., Stanek, K. Z., Bersier, D., Greenhill, L. J., & Reid, M. J. 2006, ApJ, 652, 1133
- Madore (1975) Madore, B. F. 1975, ApJS, 29, 219
- Madore & Freedman (1991) Madore, B. F. & Freedman, W. L. 1991, PASP, 103, 933
- Mochejska et al. (2000) Mochejska, B. J., Macri, L. M., Sasselov, D. D., & Stanek, K. Z. 2000, AJ, 120, 810
- Moffett et al. (1998) Moffett, T. J., Gieren, W. P., Barnes, III, T. G., & Gomez, M. 1998, ApJS, 117, 135
- Pagel et al. (1978) Pagel, B. E. J., Edmunds, M. G., Fosbury, R. A. E., & Webster, B. L. 1978, MNRAS, 184, 569
- Payne-Gaposchkin & Gaposchkin (1966) Payne-Gaposchkin, C. & Gaposchkin, S. 1966, Smithsonian Contributions to Astrophysics, 9, 1
- Peimbert et al. (2005) Peimbert, A., Peimbert, M., & Ruiz, M. T. 2005, ApJ, 634, 1056
- Peimbert & Torres-Peimbert (1976) Peimbert, M. & Torres-Peimbert, S. 1976, ApJ, 203, 581
- Phillips (1993) Phillips, M. M. 1993, ApJ, 413, L105
- Pietrukowicz (2001) Pietrukowicz, P. 2001, Acta Astronomica, 51, 247
- Pietrzyński et al. (2002) Pietrzyński, G., Gieren, W., Fouqué, P., & Pont, F. 2002, AJ, 123, 789
- Pietrzyński et al. (2006) Pietrzyński, G., Gieren, W., Soszyński, I., Udalski, A., Bresolin, F., Kudritzki, R.-P., Mennickent, R., Walker, A., Garcia, A., Szewczyk, O., Szymański, M., Kubiak, M., & Wyrzykowski, Ł. 2006, AJ, 132, 2556
- Pietrzyński et al. (2004) Pietrzyński, G., Gieren, W., Udalski, A., Bresolin, F., Kudritzki, R.-P., Soszyński, I., Szymański, M., & Kubiak, M. 2004, AJ, 128, 2815
- Pojmanski (1997) Pojmanski, G. 1997, Acta Astronomica, 47, 467
- Prieto et al. (2006) Prieto, J. L., Rest, A., & Suntzeff, N. B. 2006, ApJ, 647, 501
- Riess et al. (2004) Riess, A. G., Strolger, L.-G., Tonry, J., Casertano, S., Ferguson, H. C., Mobasher, B., Challis, P., Filippenko, A. V., Jha, S., Li, W., Chornock, R., Kirshner, R. P., Leibundgut, B., Dickinson, M., Livio, M., Giavalisco, M., Steidel, C. C., Benítez, T., & Tsvetanov, Z. 2004, ApJ, 607, 665
- Romaniello et al. (2008) Romaniello, M., Primas, F., Mottini, M., Pedicelli, S., Lemasle, B., Bono, G., François, P., Groenewegen, M. A. T., & Laney, C. D. 2008, A&A, 488, 731
- Sandage et al. (2008) Sandage, A., Tammann, G. A., & Reindl, B. 2008, ArXiv e-prints
- Schlegel et al. (1998) Schlegel, D. J., Finkbeiner, D. P., & Davis, M. 1998, ApJ, 500, 525
- Schwarzenberg-Czerny (1989) Schwarzenberg-Czerny, A. 1989, MNRAS, 241, 153
- Skillman & Kennicutt (1993) Skillman, E. D. & Kennicutt, Jr., R. C. 1993, ApJ, 411, 655
- Spergel et al. (2003) Spergel, D. N., Verde, L., Peiris, H. V., Komatsu, E., Nolta, M. R., Bennett, C. L., Halpern, M., Hinshaw, G., Jarosik, N., Kogut, A., Limon, M., Meyer, S. S., Page, L., Tucker, G. S., Weiland, J. L., Wollack, E., & Wright, E. L. 2003, ApJS, 148, 175
- Stanek & Udalski (1999) Stanek, K. Z. & Udalski, A. 1999, ArXiv Astrophysics e-prints, astro-ph/9909346
- Tegmark et al. (2004) Tegmark, M., Strauss, M. A., Blanton, M. R., Abazajian, K., Dodelson, S., Sandvik, H., Wang, X., Weinberg, D. H., Zehavi, I., Bahcall, N. A., Hoyle, F., Schlegel, D., Scoccimarro, R., Vogeley, M. S., Berlind, A., Budavari, T., Connolly, A., Eisenstein, D. J., Finkbeiner, D., Frieman, J. A., Gunn, J. E., Hui, L., Jain, B., Johnston, D., Kent, S., Lin, H., Nakajima, R., Nichol, R. C., Ostriker, J. P., Pope, A., Scranton, R., Seljak, U., Sheth, R. K., Stebbins, A., Szalay, A. S., Szapudi, I., Xu, Y., Annis, J., Brinkmann, J., Burles, S., Castander, F. J., Csabai, I., Loveday, J., Doi, M., Fukugita, M., Gillespie, B., Hennessy, G., Hogg, D. W., Ivezić, Ž., Knapp, G. R., Lamb, D. Q., Lee, B. C., Lupton, R. H., McKay, T. A., Kunszt, P., Munn, J. A., O’Connell, L., Peoples, J., Pier, J. R., Richmond, M., Rockosi, C., Schneider, D. P., Stoughton, C., Tucker, D. L., vanden Berk, D. E., Yanny, B., & York, D. G. 2004, Phys. Rev. D, 69, 103501
- Tüllmann et al. (2003) Tüllmann, R., Rosa, M. R., Elwert, T., Bomans, D. J., Ferguson, A. M. N., & Dettmar, R.-J. 2003, A&A, 412, 69
- Udalski et al. (1999) Udalski, A., Szymanski, M., Kubiak, M., Pietrzynski, G., Soszynski, I., Wozniak, P., & Zebrun, K. 1999, Acta Astronomica, 49, 201
- Urbaneja et al. (2005) Urbaneja, M. A., Herrero, A., Bresolin, F., Kudritzki, R.-P., Gieren, W., Puls, J., Przybilla, N., Najarro, F., & Pietrzyński, G. 2005, ApJ, 622, 862
- van Genderen (1983) van Genderen, A. M. 1983, A&AS, 52, 423