Dose dependence of ferromagnetism in Co-implanted ZnO
Abstract
We have studied the structural, magnetic and electronic properties of Co-implanted ZnO(0001) films grown on Al2O3 () substrates for different implantation doses and over a wide temperature range. Strong room temperature ferromagnetism is observed with magnetic parameters depending on the cobalt implantation dose. A detailed analysis of the structural and magnetic properties indicates that there are two magnetic phases in Co-implanted ZnO films. One is a ferromagnetic phase due to the formation of long range ferromagnetic ordering between implanted magnetic cobalt ions in the ZnO layer, the second one is a superparamagnetic phase, which occurs due to the formation of metallic cobalt clusters in the Al2O3 substrate. Using x-ray resonant magnetic scattering, the element specific magnetization of cobalt, oxygen and Zn was investigated. Magnetic dichroism was observed at the Co L2,3 edges as well as at the O K edge. In addition, the anomalous Hall effect is also observed, supporting the intrinsic nature of ferromagnetism in Co-implanted ZnO films.
pacs:
85.75.-d, 75.50.Pp, 61.72.U-I Introduction
ZnO is a II-VI semiconductor with a wide band gap of about 3.4 eV. The stable crystal structure of ZnO is the wurtzite structure (hexagonal, with and ) Wyckoff (2001), in which each atom of zinc is surrounded by four oxygen atoms in tetrahedral coordination. The magnetic transition metal doped ZnO is interesting from the view point of forming a transparent ferromagnetic material, and it has the potential to be a highly multifunctional material with coexisting ferromagnetic, semiconducting, and magneto-optical properties. Theoretical predictions of room temperature ferromagnetism in transition metal (TM)-doped ZnO Dietl et al. (2000); Sato and Katayama-Yoshida (2000, 2001) have initiated a number of experimental works on these systems as a potential oxide-based diluted magnetic semiconductor (DMS) material. The first observation of ferromagnetism in Co-doped ZnO was reported by Ueda et al. Ueda et al. (2001). They prepared Zn1-xCoxO thin films on sapphire substrates using PLD technique with varying between 0.05 and 0.25. Following these initial theoretical and experimental reports, different growth methods have been used to deposit Co:ZnO films, including radio-frequency (RF) magnetron co-sputtering Lim et al. (2003), pulsed laser deposition (PLD) using a KrF laser Yoo et al. (2001); Kim et al. (2002, 2003); Prellier et al. (2003); Venkatesan et al. (2004); Yan et al. (2004); Ramachandran et al. (2004); Ivill et al. (2008), combinatorial laser molecular beam epitaxy (LMBE) Jin and et al. (2001); Zheng et al. (2005), sol-gel method Lee et al. (2002), as well as ion implantation Akdogan et al. (2008a). Sapphire has been widely used as substrate due to the small mismatch (2%) between (0001) oriented ZnO and Al2O3 () substrates. In addition to cobalt, other 3d transition elements have also been used for doping, including Mn Fukumura et al. (1999); Ueda et al. (2001); Jin and et al. (2001); Cheng and Chien (2003); Chakrabarti et al. (2008), Ni Ueda et al. (2001); Jin and et al. (2001); Venkatesan et al. (2004), V Jin and et al. (2001); Venkatesan et al. (2004); Saeki et al. (2004), Cr Ueda et al. (2001); Venkatesan et al. (2004), and also Fe Ueda et al. (2001); Jin and et al. (2001); Cho et al. (2002); Venkatesan et al. (2004).
Various solubility limits for Co in ZnO were reported by different groups. Prellier et al. Prellier et al. (2003) have determined a solubility limit of about 10 at.% in PLD-grown films. Park et al. Park et al. (2004) reported that cobalt nanoclusters start to form for 12 at.% in samples grown by sol-gel and RF sputtering techniques. Lee et al. Lee et al. (2002) observed some undefined Bragg peaks for a cobalt concentrations higher than 25 at.%. Kim et al. Kim et al. (2002) showed that the solubility limit is less than 40 at.% in PLD-grown films. Ueda et al. Ueda et al. (2001) claimed that the solubility limit is lower than 50 at.% and they clearly observed a phase separation into ZnO- and CoO-rich phases in the film prepared using Zn0.5Co0.5O targets. These controversial results from different research groups are likely due to different growth techniques used and/or due to different growth conditions such as oxygen pressure and deposition temperature. Recently, we have reported that using ion implantation cobalt concentrations of up to 50 at.% in ZnO are possible without cobalt cluster formation Akdogan et al. (2008a). This high concentration is attributed to the properties of ion implantation, which allows doping of transition metals beyond their equilibrium solubility limits Hebard et al. (2004).
Regarding the magnetic properties of Co-doped ZnO films, while several groups including ourself have observed room temperature ferromagnetism for 50 at.% Akdogan et al. (2008a), 25-30 at.% Lee et al. (2002); Ivill et al. (2008) and lower Prellier et al. (2003); Venkatesan et al. (2004); Ramachandran et al. (2004); Yin et al. (2004) Co concentrations, others reported the absence of ferromagnetism at room temperature Jin and et al. (2001); Kim et al. (2002); Park et al. (2004).
In this paper we report detailed studies using various experimental techniques for the investigation of the structural, magnetic and electronic properties of Co-implanted ZnO films grown on sapphire substrates and for different cobalt concentrations. Rutherford backscattering spectroscopy (RBS) and X-ray diffraction (XRD) were used to determine the depth profile of implanted cobalt ions and to detect the formation of possible secondary phases such as metallic cobalt clusters. The magnetic properties of the films were characterized by the magneto-optical Kerr effect (MOKE), a superconducting quantum interference device (SQUID) magnetometer, as well as x-ray resonant magnetic scattering (XRMS) techniques. In order to determine the type and concentration of carriers in Co-implanted ZnO films, Hall effect measurements were also performed.
II Sample Preparation
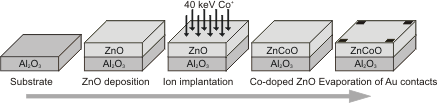
About 35 nm thick ZnO(0001) films were grown on mm2 epi-polished single-crystalline Al2O3 () substrates by RF (13.56 MHz) sputtering of a ZnO target Ay et al. (2003). The sputtering was carried out in an atmosphere of mbar pure Ar () with a substrate temperature of . In order to increase the quality of ZnO films, the samples were annealed in an oxygen atmosphere with a partial pressure of up to 2000 mbar and a temperature of . After annealing, the ZnO samples were implanted with 40 keV Co+ ions with an ion current density of using the ILU-3 ion accelerator (Kazan Physical-Technical Institute of Russian Academy of Science). The sample holder was cooled by flowing water during the implantation to prevent the samples from overheating. The implantation dose varied in the range of . After implantation, the samples were cut into square pieces and gold contacts were evaporated on the corners of the samples for Hall effect studies (Fig. 1). A list of the Co-implanted ZnO films used for the present study is given in Table 1.
| Sample | Dose () |
|---|---|
| 1 | 0.25 |
| 2 | 0.50 |
| 3 | 0.75 |
| 4 | 1.00 |
| 5 | 1.25 |
| 6 | 1.50 |
| 7 | 2.00 |
III Experimental Results
III.1 Structural Properties
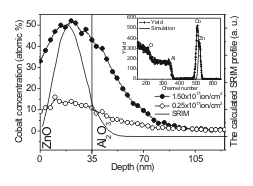
The depth dependence of the cobalt concentration in Co-implanted ZnO/Al2O3 films was investigated using the RBS technique at the Dynamic Tandem Laboratory (DTL) at the Ruhr-Universität Bochum. The RBS data show both a maximum of cobalt concentration located close to the ZnO/Al2O3 interface and an extended inward tail due to cobalt diffusion into the volume of the Al2O3 substrate (Fig. 2). We also noticed that after ion implantation the thickness of the ZnO layer has shrunk (e.g., from originally 35 nm to 28 nm for sample 6) due to sputtering effects. According to the SRIM algorithm Ziegler et al. (1985), the average implanted depth of 40 keV Co ions in ZnO/Al2O3 is about 20.4 nm with a straggling of 9.6 nm in the Gaussian-like depth distribution (solid line in Fig. 2). However, because of the surface sputtering, ion mixing and heating of the implanted region by the ion beam, a redistribution of the implanted cobalt ions compared to the calculated profile has to be taken into account.
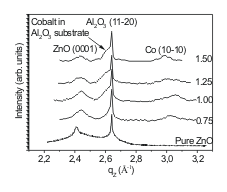
High-angle XRD experiments provide information on the structural coherence of the films and in our case also of possible additional phases in the sample after ion implantation. Fig. 3 shows high angle Bragg scans of the ZnO films before and after cobalt implantation. The data were taken using synchrotron radiation at the ”Hamburg Synchrotron Radiation Laboratory” (HASYLAB) (for pure ZnO film) and at the ”Dortmund Electron Accelerator” (DELTA) (for cobalt implanted ZnO films) with an energy of E=11000 eV. Before implantation the x-ray diffraction pattern consists of a very strong Al2O3 () peak and a ZnO(0001) reflection to the left side. The ZnO peak is surround by thin film Laue oscillations, which are indicative for the high quality of the ZnO film. After implantation, the XRD diffraction pattern shows a () reflection of the Co hcp structure on the right side of the sapphire substrate peak. The ion bombardment also causes an intensity reduction of the ZnO(0001) peak proportional to the implantation dose, indicating an increasing amount of lattice defects. Furthermore, after implantation we observe a shift of the ZnO (0001) peak to higher angles. We attribute the ZnO lattice contraction to the substitution of Zn ions by Co cobalt ions, which has a smaller ion radius. In addition, after implantation a tail (shown by an arrow in Fig. 3) appears on the low angle side of the main Al2O3 () peak which is not observed before implantation. This tail likely reflects the lattice expansion of the sapphire substrate upon Co implantation.
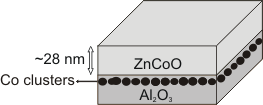
In addition to the XRD experiments, we have also performed high resolution cross sectional transmission electron microscopy (TEM) measurements for sample 6 Akdogan et al. (2008a). The TEM results reveal the presence of metallic cobalt clusters in the Al2O3 sapphire substrate, but not in the ZnO film. Co clusters with a diameter of about 5-6 nm form a Co rich layer in the substrate close to the ZnO/Al2O3 interface Akdogan et al. (2008a).
III.2 Magnetic Properties
III.2.1 Room temperature magnetization measurements
For the investigation of the magnetic properties of the Co implanted samples we used a high-resolution MOKE setup in the longitudinal configuration with s-polarized light Zeidler et al. (1996); Schmitte et al. (2002); Westphalen et al. (2007). Fig. 4 shows the hysteresis loops of Co-implanted ZnO films which were recorded at room temperature. The MOKE data in Fig. 4 clearly indicate that after cobalt implantation, non-magnetic ZnO becomes ferromagnetic at room temperature with a large remanent magnetization. With increasing cobalt concentration the implanted ZnO films exhibit sequentially paramagnetic, weak ferromagnetic and, finally, ferromagnetic response with a square-like hysteresis at room temperature for the dose of . For the highest dose () the square-like shape of the hysteresis loop disappears and the coercive field increases drastically. From this we infer that for the highest dose level the cobalt atoms start to form clusters in the ZnO film. Moreover, although no in-plane magnetic anisotropy was observed by MOKE in Co-implanted ZnO films, we observed a clear six-fold in-plane magnetic anisotropy by ferromagnetic resonance (FMR) technique Akdogan et al. (2008b). The corresponding FMR data show that the easy and hard axes have a periodicity of 60 degree in the film plane, in agreement with the hexagonal structure of the ZnO film.
In order to study in detail the observed ferromagnetic behavior, the magnetic properties of Co-implanted ZnO films were investigated using the XRMS technique. XRMS has proven to be a highly effective method for the analysis of the magnetic properties of buried layers and interfaces, including their depth dependence Tonnerre et al. (1995); van der Laan (2006). Moreover, if the photon energy is fixed close to the energy of the corresponding x-ray absorption edges, element specific hysteresis loops can be measured Kortright et al. (2003). Since there are three elements in the Co-doped ZnO film, the analysis can be carried out separately for Co, O and Zn.
The XRMS experiments were performed using the ALICE diffractometer Grabis et al. (2003) at the undulator beamline UE56/1-PGM at BESSY II (Berlin, Germany). The diffractometer comprises a two-circle goniometer and works in horizontal scattering geometry. A magnetic field can be applied in the scattering plane and along the sample surface either parallel or antiparallel to the photon helicity, which corresponds to the longitudinal magneto-optical Kerr effect (L-MOKE) geometry. The maximum field of Oe was high enough to fully saturate the magnetization of the sample. The magnetic contribution to the scattered intensity was always measured by reversing the magnetic field at fixed photon helicity. As a compromise between high scattering intensity and high magnetic sensitivity for the investigation of the magnetic properties at the Co L edges, the scattering angle was fixed at the position of (the angle of incidence is ) Akdogan et al. (2008a).
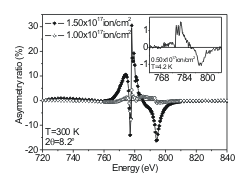
The magnetic contribution to the resonant scattering can best be visualized by plotting the asymmetry ratio, . In Fig. 5 we show the asymmetry ratio taken at the Co L edges for samples doped with different doses. The asymmetry ratio shows a strong ferromagnetic signal for sample 6 (up to 30 %), and it decreases with decreasing cobalt implantation dose. For sample 2, we observe only a very small magnetic signal at 4.2 K. In addition to XRMS, we have also employed x-ray absorption spectroscopy (XAS) experiments for sample 6. The XAS spectrum clearly exhibits a multiplet structure of the Co peak, which is typical for oxidized cobalt showing the presence of Co2+ state in the ZnO film Akdogan et al. (2008a).
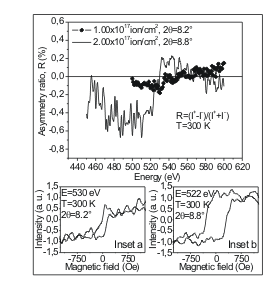
The magnetic signal at the Zn - (E=1021.8 eV) and the O K- (526.8 eV) edges were also investigated. Within the sensitivity limit no magnetic signal could be resolved for Zn. However, a clear magnetic signal was observed at the O K edge for sample 6 Akdogan et al. (2008a). In addition to sample 6, a very small magnetic signal at the O K edge was also observed for the samples 4 and 7 presented in Fig. 6.
III.2.2 Temperature dependent magnetization measurements
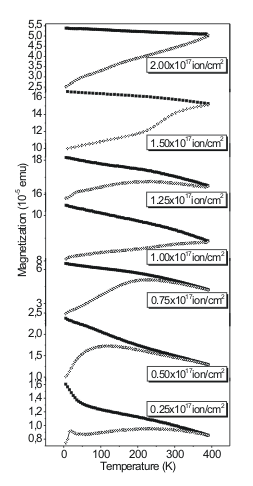
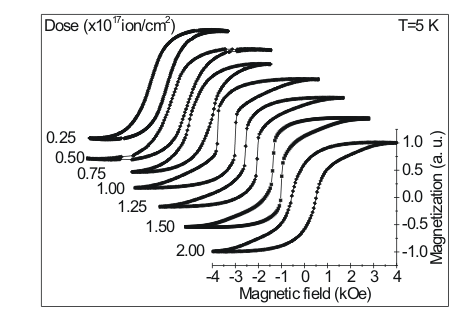
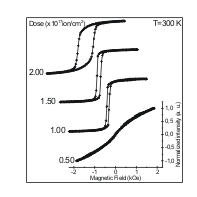
In order to check the temperature dependence of the magnetization for ZnO films doped with different doses, we carried out field cooled (FC) and zero field cooled (ZFC) measurements using a SQUID magnetometer. For ZFC measurements, the samples are first cooled in zero field to 5 K and the magnetization is recorded during warming up to 390 K with an applied field of 100 Oe, parallel to the film surface. For FC measurements, the applied field of 100 Oe is kept constant during cooling to 5 K and the magnetization is recorded during warming at the same field value. Due to the clustering of cobalt in the Al2O3 substrate (Akdogan et al. (2008a)), the FC (closed symbols) and ZFC (open symbols) curves presented in Fig. 7 always show evidence for the presence of a superparamagnetic phase. There is a small peak at about 20 K in ZFC curve of sample 1 () and this peak shifts to higher temperatures with increasing cobalt concentration. The trend in the curve of sample 1 () can be attributed to the coexistence of a ferromagnetic phase originating from substituted Co2+ ions in ZnO and the superparamagnetic phase due to cluster formation in Al2O3. Hysteresis curves measured at 5 K (Fig. 8) indicate that the superparamagnetic phase in this sample is more dominant than the ferromagnetic phase. The measurements for the samples implanted with higher doses exhibits superparamagnetism with a blocking temperature of about 100 K and 250 K for sample 2 () and sample 3 (), respectively. The hysteresis curves of these films (Fig. 8) also show that the superparamagnetic phase is still dominating over the ferromagnetic phase. But the steep part of the hysteresis curve of sample 3 and the increased coercivity () are indicative for the onset of a clear ferromagnetism phase at this dose. The temperature dependent magnetization curves of sample 4 (), sample 5 () and sample 6 () show that these samples have a blocking temperature of about 390 K or even higher. The magnetic hysteresis of these samples measured by SQUID (Fig. 8) clearly show a ferromagnetic phase superimposed by a superparamagnetic component. The ferromagnetic component is present even above room temperature as seen in the MOKE experiments in Fig. 4. Since MOKE probes only films near their surface, the superparamagnetic component in these samples, which is deeper in the substrate, is not seen by MOKE experiments.
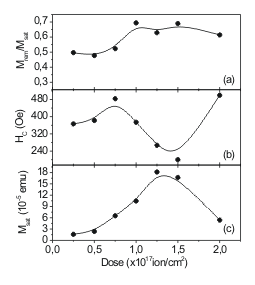
In the SQUID hysteresis curves there is another remarkable effect of the ferromagnetic phase as a function of dose. The coercivity decreases systematically with increasing Co dose up until a dose of , as seen in Figs. 8 and 9 (b). This behavior may be explained as follows: with increasing Co dose the magnetization becomes more homogeneous and, since magnetic inhomogeneities are the main source of pinning for the domain walls, decreases with increasing Co dose. Between and the potential barrier for reversal of the ferromagnetic component becomes smaller. Up to this level all inhomogeneities are filled. Any higher dose is counterproductive, it decreases the saturation magnetization and enhances the coercivity (see Figs. 9 (b) and (c)), indicating that Co goes into antisites with eventually antiferromagnetic (AF) coupling, loss of magnetization, and increase of the coercivity. CoO clusters are formed in the ZnO matrix with AF spin structure and AF coupling to the remaining ferromagnetic Zn(Co)O film. The data (Fig. 7) and the room temperature (Fig. 4) and low temperature (Fig. 8) hysteresis measurements of sample 7 () clearly indicate that the cobalt atoms start to cluster also within the ZnO layer at the highest dose.
III.3 Hall effect measurements
In ferromagnetic materials the Hall voltage consists of the ordinary term and an additional term that contributes to the Hall voltage due to their spontaneous magnetization. This additional contribution, called anomalous Hall effect, is proportional to the sample magnetization Hurd (1972). Hence, the Hall voltage can be written as Hurd (1972),
| (1) |
where is the film thickness and is the current. and are the ordinary and anomalous Hall effect coefficients, respectively. is the permeability of free space. is the angle between the applied magnetic field () and sample normal. is the angle between the sample magnetization () and the sample normal. The first term in Eq. 1 is the ordinary Hall effect and arises from the Lorentz force acting on conduction electrons. This establishes an electric field perpendicular to the applied magnetic field and to the current. The anomalous Hall effect term is conventionally attributed to spin dependent scattering involving a spin-orbit interaction between the conduction electrons and the magnetic moments of the material. At low applied magnetic fields, the Hall voltage () is dominated by the magnetic field dependence of the sample magnetization . When the applied magnetic field is high enough to saturate the sample magnetization, the magnetic field dependence of the Hall voltage becomes linear due to the ordinary Hall effect.
In order to check whether this behavior is present in Co-implanted ZnO films and to determine the character of the majority carriers, we have carried out Hall effect experiments. The Hall effect measurements were performed at 4.2 K using a van der Pauw configuration presented in Fig. 10 as an inset.
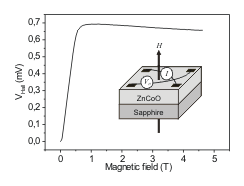
The Hall effect data of sample 6 () are shown in Fig. 10. A sharp rise in the Hall voltage at low field, i.e., AHE, is followed by a slow decrease corresponding to the ordinary Hall effect. It is important to note that the negative slope at high fields indicates n-type carriers in Co-implanted ZnO film with a 3D carrier concentration of . The Hall mobility measured at 4.2 K is about for sample 6. We have also observed similar behavior for the samples 3, 4, 5 and 7. However, for the lowest two doses (samples 1 and 2), the measurements cannot be done because of a too small signal-to-noise ratio of the Hall voltage.
IV Discussion
For the dose dependence of magnetic phases in ZnO films at room temperature we propose the following scenario : At low doses () the number of substituted cobalt ions in the ZnO layer is very small, which results in a paramagnetic signal at room temperature. Increasing of cobalt implantation dose leads to an increasing number of substituted cobalt ions and after certain cobalt concentration they start to interact ferromagnetically. For this reason at the cobalt dose of a weak ferromagnetic behavior is observed with a below room temperature. At higher cobalt concentrations () the substituted cobalt ions in ZnO interact strongly and stabilize room temperature ferromagnetism. At the highest dose of , in addition to the substituted cobalt ions, metallic cobalt clusters are also present in the ZnO layer.
As discussed in detail in Ref. Akdogan et al. (2008a), the difference in the shape of the hysteresis loops obtained by MOKE and SQUID is attributed to the surface sensitivity of the MOKE technique with a maximum penetration depth of about 20-30 nm. The ZnO films have a thickness of 35 nm before implantation. Because of surface sputtering, the ZnO thickness decreases (e.g., decreased to about 28 nm for sample 6) after implantation. Thus, MOKE provides information only from the ZnO layer, not from the sapphire substrate, i.e. MOKE is only sensitive to the ferromagnetic contribution from the ZnO layer. In this layer a small fraction of nonmagnetic Zn atoms are substituted by magnetic Co ions, giving raise to the MOKE hysteresis. However, SQUID measurements collect magnetic contributions from both the Co-implanted ZnO film and from the cobalt clusters in Al2O3 (Fig. 11). Therefore, the difference between the MOKE and SQUID data appear as a result of the depth-dependent Co content in the implanted layer.
Another important result of this study is the observation of oxygen spin polarization in Co-implanted ZnO films. This shows that the oxygen atoms are polarized due to the spontaneous ferromagnetic order in ZnO films. The main question that arises here is the mechanism which leads to the observed long range ferromagnetic ordering in Co-doped ZnO. Recently, Patterson Patterson (2006) calculated the electronic band structure of Co substituted for Zn in ZnO, for Zn and O vacancies, and for interstitial Zn in ZnO using the B3LYP hybrid density functional theory. He reported that the singly-positively charged O vacancy is the only defect in Co-doped ZnO which can mediate ferromagnetic exchange coupling between Co ions at intermediate range (just beyond near neighbor distances). In the ground state configuration the majority Co spins are parallel, whereas the minority spins are parallel to each other and to the oxygen vacancy spin, so that there are exchange couplings between these three spins leading to an overall ferromagnetic ground state of the Co ions. No substantial exchange coupling was found for the positively charged interstitial Zn defect which has also spin 1/2. The exchange coupling mechanism proposed by Patterson is essentially the same as the impurity band model of Coey et al. Coey et al. (2005), where the polarons bound to the oxygen vacancies mediate ferromagnetic coupling between Co ions. In order to have the magnetic moments of the Co ions aligned ferromagnetically, one mediating electron is required with an oppositely directed spin. This is in line with a recent comparison of band structure calculations by Walsh et al. showing that the electronic structure of Co-doped ZnO is consistent with carrier mediated ferromagnetism Walsh et al. (2008). The oxygen spin polarization has not explicitly been considered in the aforementioned band structure calculations and may be due to ferromagnetic splitting of nearest neighbor oxygen p-levels. This has already been speculated by Methfessel and Mattis in their seminal review article on magnetic semiconductors Methfessel and Mattis (1968).
The reason for the observation of AHE and n-type carriers in Co-implanted ZnO films can be explained by electron doping via Zn interstitials. Normally, isovalent TM2+ doping of ZnO does not introduce charge carriers itself, they need to be produced by additional doping Nielsen et al. (2006). However, using ion implantation not only cobalt ions are introduced in ZnO, but simultaneously many other defects are also be produced in the implanted region, such as Zn interstitials which are reported to form shallow donors in ZnO Look et al. (1998, 1999); Lee et al. (2002). This can be thought of as an added advantage of ion implantation that it not only introduces transition metal ions to induce ferromagnetism but also introduces the required charge carriers into the ZnO.
V Summary
In conclusion, the structural, magnetic and electronic properties of Co-implanted ZnO films, deposited by RF-sputtering methods on a () oriented sapphire substrate, have been investigated. The structural data indicate a Co cluster formation in the sapphire substrate close to the ZnO/Al2O3 interface but well separated from the ZnO film. No indication of clustering in the ZnO layer has been found. The previously reported XAS data with a multiplet fine structure around the Co L3 edge clearly shows that the implanted cobalt ions are in the Co2+ oxidation state, most likely substituting part of the Zn2+ ions in the host matrix. The combination of room temperature and low temperature magnetization measurements indicates that there are two magnetic phases in the Co-implanted ZnO/Al2O3 films. One is the ferromagnetic phase due to the Co substitution on Zn sites in the ZnO film, the second magnetic phase originates from Co clusters in the sapphire substrate. Furthermore, a clear ferromagnetic signal at the O K edge is observed which shows that the oxygen spin polarization is an important indicator for the observed long range ferromagnetic ordering in the ZnO layer. In conclusion, implantation of cobalt ions into the nonmagnetic ZnO film causes intrinsic ferromagnetism at room temperature and simultaneously creates n-type charge carriers without additional doping.
Acknowledgements.
We would like to acknowledge S. Erdt-Böhm and P. Stauche for sample preparation and technical support. We also would like to thank also Dr. C. Sternemann and Dr. M. Paulus for their assistance with the beamline operation at DELTA, and G. Nowak for his help to perform XRD experiments at HASYLAB. This work was partially supported by BMBF through Contracts Nos. 05KS4PCA (ALICE Chamber) and 05ES3XBA/5 (Travel to BESSY), by DFG through SFB 491, and by RFBR through the grant Nos 07-02-00559-a and 04-02-97505-r. N. Akdogan acknowledges a fellowship through the International Max Planck Research School-SurMat.References
- Wyckoff (2001) R. W. G. Wyckoff, Crystal Structures, 2nd Edition (Wiley, New York, 2001).
- Dietl et al. (2000) T. Dietl, H. Ohno, F. Matsukura, J. Cibert, and D. Ferrand, Science 287, 1019 (2000).
- Sato and Katayama-Yoshida (2000) K. Sato and H. Katayama-Yoshida, Jpn. J. Appl. Phys. 39, L555 (2000).
- Sato and Katayama-Yoshida (2001) K. Sato and H. Katayama-Yoshida, Jpn. J. Appl. Phys. 40, L334 (2001).
- Ueda et al. (2001) K. Ueda, H. Tabada, and T. Kawai, Appl. Phys. Lett. 79, 988 (2001).
- Lim et al. (2003) S. W. Lim, S. K. Hwang, and J. M. Myoung, Solid State Commun. 125, 231 (2003).
- Yoo et al. (2001) Y. Z. Yoo, T. Fukumura, Z. Jin, K. Hasagewa, M. Kawasaki, P. Ahmet, T. Chikyov, and H. Koinuma, J. Appl. Phys. 90, 4246 (2001).
- Kim et al. (2002) J. H. Kim, H. Kim, D. Kim, Y. E. Ihm, and W. K. Choo, J. Appl. Phys. 92, 6066 (2002).
- Kim et al. (2003) J. H. Kim, H. Kim, D. Kim, Y. E. Ihm, and W. K. Choo, Physica B 327, 304 (2003).
- Prellier et al. (2003) W. Prellier, A. Fouchet, B. Mercey, C. Simon, and B. Raveau, Appl. Phys. Lett. 82, 3490 (2003).
- Venkatesan et al. (2004) M. Venkatesan, C. B. Fitzgerald, J. G. Lunney, and J. M. D. Coey, Phys. Rev. Lett. 93, 177206 (2004).
- Yan et al. (2004) L. Yan, C. K. Ong, and X. S. Rao, J. Appl. Phys. 96, 508 (2004).
- Ramachandran et al. (2004) S. Ramachandran, A. Tiwari, and J. Narayan, Appl. Phys. Lett. 84, 5255 (2004).
- Ivill et al. (2008) M. Ivill, S. J. Pearton, S. Rawal, L. Leu, P. Sadik, R. Das, A. F. Hebard, M. Chisholm, J. D. Budai, and D. P. Norton, New Journal of Physics 10, 065002 (2008).
- Jin and et al. (2001) Z. Jin and et al., Appl. Phys. Lett. 78, 3824 (2001).
- Zheng et al. (2005) Y. Zheng, J. C. Boilliard, D. Demaille, Y. Bernard, and J. F. Petroff, J. Crys. Growth 274, 156 (2005).
- Lee et al. (2002) H. J. Lee, S. Y. Jeong, C. R. Cho, and C. H. Park, Appl. Phys. Lett. 81, 4020 (2002).
- Akdogan et al. (2008a) N. Akdogan, A. Nefedov, K. Westerholt, H. Zabel, H. W. Becker, C. Somsen, R. Khaibullin, and L. Tagirov, J. Phys. D: Appl. Phys. 41, 165001 (2008a).
- Fukumura et al. (1999) T. Fukumura, J. Zin, A. Ohtomo, and H. Koinuma, Appl. Phys. Lett. 75, 3366 (1999).
- Cheng and Chien (2003) X. M. Cheng and C. L. Chien, J. Appl. Phys. 93, 7876 (2003).
- Chakrabarti et al. (2008) M. Chakrabarti, S. Dechoudhury, D. Sanyal, T. Roy, D. Bhowmick, and A. Charabarti, J. Phys. D: Appl. Phys. 41, 135006 (2008).
- Saeki et al. (2004) H. Saeki, H. Matsui, T. Kawai, and H. Tabata, J. Phys. Chem. 16, S5533 (2004).
- Cho et al. (2002) Y. M. Cho, W. K. Choo, H. Kim, D. Kim, and Y. Ihm, Appl. Phys. Lett. 80, 3358 (2002).
- Park et al. (2004) J. H. Park, M. G. Kim, H. M. Jang, S. Ryu, and Y. M. Kim, Appl. Phys. Lett. 84, 1338 (2004).
- Hebard et al. (2004) A. F. Hebard, R. P. Rairigh, J. G. Kelly, S. J. Pearton, C. R. Abernathy, S. N. G. Chu, and R. G. Wilson, J. Phys. D: Appl. Phys. 37, 511 (2004).
- Yin et al. (2004) Z. Yin, N. Chen, C. Chai, and F. Yang, J. Appl. Phys. 96, 5093 (2004).
- Ay et al. (2003) M. Ay, A. Nefedov, and H. Zabel, Appl. Surf. Sci. 205, 329 (2003).
- Ziegler et al. (1985) J. F. Ziegler, J. P. Biersack, and U. Littmark, The Stopping and Range of Ions in Solids (Pergamon Press, New York, 1985).
- Zeidler et al. (1996) T. Zeidler, F. Schreiber, H. Zabel, W. Donner, and N. Metoki, Phys. Rev. B 53, 3256 (1996).
- Schmitte et al. (2002) T. Schmitte, K. Westerholt, and H. Zabel, J. Appl. Phys. 92, 4524 (2002).
- Westphalen et al. (2007) A. Westphalen, M. S. Lee, A. Remhof, and H. Zabel, Rev. Sci. Instruments 78, 121301 (2007).
- Akdogan et al. (2008b) N. Akdogan, B. Rameev, S. Güler, A. Nefedov, H. Zabel, R. Khaibullin, and L. Tagirov, in preparation (2008b).
- Tonnerre et al. (1995) J. M. Tonnerre, L. Seve, D. Raoux, G. Soullie, B. Rodmacq, and P. Wolfers, Phys. Rev. Lett. 75, 740 (1995).
- van der Laan (2006) G. van der Laan, Current Opinion in Solid State and Materials Science 10, 120 (2006).
- Kortright et al. (2003) J. B. Kortright, J. S. Jiang, S. D. Bader, O. Hellwig, D. T. Marguiles, and E. E. Fullerton, Nucl. Instr. Meth. Phys. Res. B 199, 301 (2003).
- Grabis et al. (2003) J. Grabis, A. Nefedov, and H. Zabel, Rev. Sci. Instr. 74, 4048 (2003).
- Hurd (1972) C. M. Hurd, The Hall Effect in Metals and Alloys (Plenum Press, New York, 1972).
- Patterson (2006) C. H. Patterson, Phys. Rev. B 74, 144432 (2006).
- Coey et al. (2005) J. M. D. Coey, M. Venkatesan, and C. B. Fitzgerald, Nature Materials 4, 173 (2005).
- Walsh et al. (2008) A. Walsh, J. L. F. D. Silva, and S.-H. Wei, Phys. Rev. Lett. 100, 256401 (2008).
- Methfessel and Mattis (1968) S. Methfessel and D. Mattis, Encyclopedia of Physics, edited by S. Fl gge, Springer Verlag XVIII/1, 256401389 (1968).
- Nielsen et al. (2006) K. Nielsen, S. Bauer, M. Lübbe, S. T. B. Goennenwein, M. Opel, J. Simon, W. Mader, and R. Gross, Phys. Stat. Sol. (a) 203, 3581 (2006).
- Look et al. (1998) D. C. Look, D. C. Reynolds, J. R. Sizelove, R. L. Jones, C. W. Litton, G. Cantwell, and W. C. Harsch, Solid State Commun. 105, 399 (1998).
- Look et al. (1999) D. C. Look, J. W. Hemsky, and J. R. Sizelove, Phys. Rev. Lett. 82, 2552 (1999).