Relativistic Outflows in two quasars in the Chandra Deep Field South
Abstract
In this paper, we provide new 1 Ms ACIS spectra of two quasars in the Chandra Deep Field South (CDF-S), which were previously reported to show strong and extremely blueshifted X-ray emission/absorption line features in previous 1 Ms spectra, with outflowing bulk velocity 0.65-0.84c. In the new 1 Ms spectra, the relativistic blueshifted line feature is solidly confirmed in CXO CDFS J033225.3-274219 (CDFS 46, = 1.617), and marginally visible in CXO CDFS J033260.0-274748 (CDFS 11, = 2.579), probably due to the increased Chandra ACIS background in the new 1 Ms exposure. The new data rule out the possibility (though very tiny already based on the old 1Ms data) that the two sources were selected to be unusual due to noise spikes in the spectra. The only likely interpretation is extremely blueshifted iron absorption/emission line or absorption edge due to relativistic outflow. We find that the rest frame emission line center in CDFS 46 marginally decreased from 16.2 keV to 15.2 keV after 7 years. The line shift can be due to either decreasing outflowing velocity or lower ionization level. Including the two quasars reported in this paper, we collect from literature a total of 7 quasars showing blueshifted emission or absorption line feature with in X-ray spectra, and discuss its connection to jet and/or BAL (broad absorption line) outflow.
1 Introduction
It’s well known that quasars interact with their environments through collimated jets and outflowing winds, which is required as the feedback (from the central supermassive black hole to the host galaxy) for the the M- relation (Gebhardt et al. 2000). The collimated jets and outflowing winds are also natural diagnostics to study the gas flow patterns in the innermost regions of black holes, the source geometry and energy generation mechanism (e.g., see Cappi 2006).
Intrinsic outflowing systems may be categorized by their outflowing velocities. The jets are often seen in radio-loud quasars with velocities very close to the speed of light (except for shocks and lobe-dominated sources, which are interacted with the surrounding medium and appear to be sub-relativistic, e.g., Kellermann et al. 2004). The broad absorption lines (BALs) in UV/optical band are blueshifted with velocities up to 0.2c, presenting in the spectra of 1020% quasars. The BAL outflow can be seen in the X-ray spectra at even higher velocity. Chartas et al. (2002, 2003, 2007a, 2007b) discovered very broad absorption lines with outflow velocity of 0.4-0.67c in three gravitational lensed radio quiet BAL quasars (PG 1115080, H 1413117, and APM 082795255; see table 1 for details), which are the only BALs reported with relativistic outflows () in their X-ray spectrum.
Meanwhile, relativistic outflows with are also seen in the X-ray spectra of four non-BAL quasars. Yaqoob et al. (1998) reported blueshifted OVII emission line in the ASCA spectrum of PKS 0637-752 with outflow velocity of 0.77c. The line is however invisible in the Chandra exposure obtained 2 years later, which instead detected an extended X-ray jet in this core-dominated radio-loud quasar. Yaqoob et al. (1999) reported the detection of blueshifted iron K emission line in radio-loud quasar PKS 2149-306 with velocity of 0.71c (see Table 1) in the ASCA spectrum. Such feature is also visible in following up XMM spectrum (see Fig. 2 of Page et al. 2005), and our independent analysis gives a confidence level of 99% in XMM PN spectrum. With the 1 Ms Chandra exposure on Chandra Deep Field South (CDF-S), Wang et al. (2003; 2005) reported the detection of strong blueshifted iron K line features with 0.65-0.84c, in CXO CDFS J033225.3-274219 (CDFS 46, = 1.617, emission line, radio-loud) and CXO CDFS J033260.0-274748 (CDFS 11, = 2.579, absorption line, radio-quiet) respectively. The blueshift velocities of the three emission lines reported are far larger than that could be produced by the rotational velocities of the accretion disk, and can only be due to outflow (see Wang et al. 2003).
In this paper, we report new 1 Chandra Ms observation111The Deep Field South (CDF-S, e.g., Giacconi et al. 2002; Rosati et al. 2002) now has a newly 1 Ms exposure (from 2007 September to 2007 November), and the data has been released. See http://cxc.harvard.edu/cda/whatsnew.html#CDFS2000-2007 of the two CDF-S sources with relativistic outflows. Their multi-band properties are described in details in Wang et al. (2003; 2005). The X-ray data and spectral fitting are reported in §2 and the nature of the blueshifted features are discussed in §3. Throughout the paper we assume a cosmological model with km s-1 Mpc-1, = 0.3, and = 0.7.
2 The Data and X–ray spectral fitting
The newly released 1 Ms exposure on CDF-S was composed of 12 individual ACIS observations obtained from September to November, 2007. Each observation was filtered to include only standard ASCA event grades. Cosmic ray afterglows, ACIS hot pixels and bad pixels were removed, and high background intervals were subtracted. All exposures were then added to produce a combined event file with net exposure of 954 ks. The two sources, CDFS 46 and CDFS 11, 6 and 7 from the center of the field, respectively, were covered by all 12 exposures. The X-ray count rates of CDFS 46 and CDFS 11 extracted from 12 exposures are examined and no significant fluctuations ( 3) are seen.
We extract the Chandra ACIS-I X-ray spectra of CDFS 46 and CDFS 11 from the 95% encircled-energy radius of the ACIS point-spread function at each source’s position, and the background spectra are extracted from the annulus at the same position with inner and outer radius of and . The X-ray telescope response and CCD ACIS-I instrument response were generated for each single Chandra observation, and then summed together with corresponding exposure times as weighting factor. The final time-weighted response files were used for spectral analysis. The net counts of CDFS 46 and CDFS 11 are 375 and 963 in the 0.5–2.0 keV band, 170 and 451 in the 2.0–9.0 keV band. During the fit, we use the C-statistics (Cash 1979; Nousek & Shue 1989), which perform better than the analysis for spectra with low detected counts. We use XSPEC version 12.0 to perform the spectral fitting. All the spectral fitting was done in the energy band 0.5–9.0 keV, and all the statistical errors quoted in this paper are at the 90% confidence level for one interesting parameter.
The spectra of both CDFS 46 and CDFS 11 were binned to have at least one count per bin, and were first fitted with a simple power law plus a neutral absorber in the quasar frame. A galactic neutral hydrogen absorption column of 8 1019 cm-2 (Dickey & Lockman 1990) was also included. The fitting results of CDFS 46 are presented in Table 2.
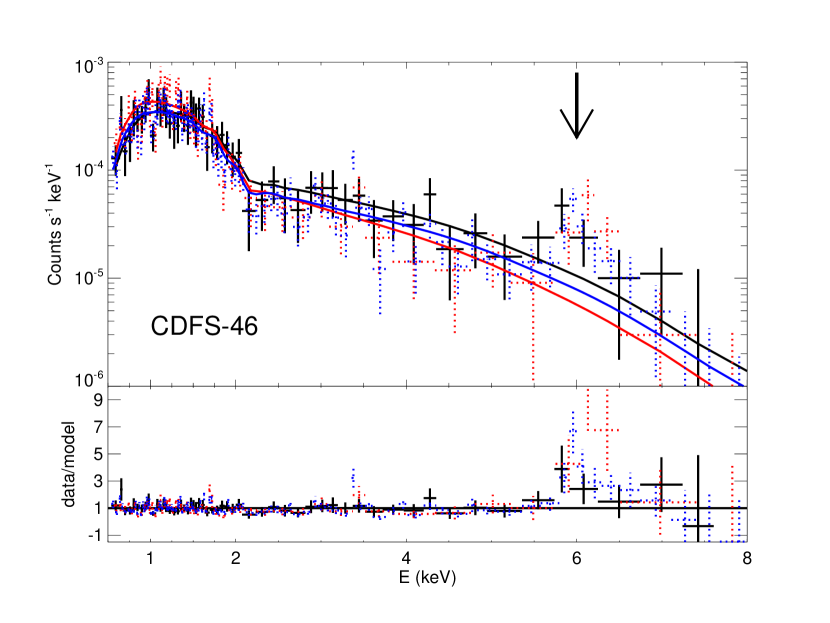
In Fig. 1 we plotted Chandra spectra of CDFS 46, for old, new 1 Ms exposure, and a combined 2 Ms exposure respectively. In the new 1 Ms exposure, the emission line feature at around 6 keV (observed frame) is obvious. A single Gaussian was added to our continuum model. With three more free parameters (, , and ), the fit was significantly improved ( = -18.2) , indicating a confidence level of 99.99% based on F-test. However, comparing with the old 1 Ms exposure, we find marginal shift of the rest frame line center from 16.2 to keV (see Fig. 2).
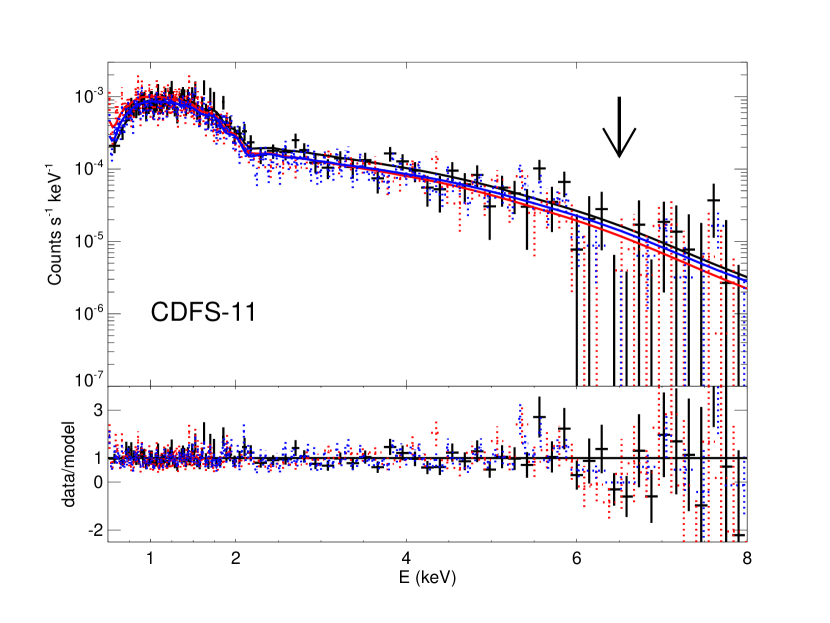
The absorption feature at around 7 keV in CDFS 11 is also marginally visible in the new 1 Ms exposure (see Fig. 3). We added an absorption edge to our continuum model, but it did not improve the fit significantly ( -2). We also tried to model the absorption feature by a saturated absorption line model. The model of XSPEC was used by fixing the covering fraction at 0.99 to represent a blank absorption trough. The fitting was slightly better with for two extra free parameters, yielding a confidence level of 93% based on F-test. Note in the old 1 Ms spectra, the feature was detected with a level of 99.98%. This could probably be due to the significant higher ACIS background in the new 1 Ms exposure.
3 Discussion
Wang et al. (2003; 2005) have ruled out the possibilities that the unusual X-ray features in CDFS 46 and CDFS 11 are due to any instrumental artifact, or due to improper background subtraction. The conclusions hold for the new 1 Ms exposure, and get stronger since it’s even more unlikely that any artifact mentioned above, can affect both exposures obtained 7 years apart. Statistical fitting results show that the confidence level of the unusual features in both CDFS 46 and CDFS 11 is lower in the new 1 Ms exposure, than early reported with old 1 Ms exposure. This is actually expected due to the increasing Chandra ACIS background with time.222The ACIS background rates remained relatively constant from the year 2000 until the end of 2003, and started to increase in 2004 with 10% per year, independent of variability induced by the solar cycle. (See Section 6.16.2 of the Proposers’ Observatory Guide v. 10 http://cxc.harvard.edu/proposer/POG/) Note the blueshifted absorption feature in CDFS 11 is only marginally visible in the new 1 Ms spectrum, and we are unable to tell whether it varied based on current data. Except for providing marginally support to the reality of the unusual absorption feature in CDFS 11 with new 1 Ms spectrum, we are not discussing on its nature more than Wang et al. (2005) did. In this paper we will focus on CDFS 46.
Wang et al. (2003) has interpreted the X-ray emission line in CDFS 46 as relativistic blueshifted iron K line intrinsic to the quasar at = 1.617 (see below for further discussion). We noticed that Basu (2006) proposed a different scenario to interpret the optical and X-ray spectrum of CDFS 46. He suggested that all the optical and X-ray emission lines are blueshifted, resulting from an ejection. However, we find this scenario is unacceptable due to several reasons. First, all the emission lines were identified to have negative redshift, i.e., the observed optical emission lines were identified as infrared lines in the rest frame. However, such extremely unusual galaxies with high blueshifts have never been reported. Furthermore, the identification of three optical emission lines yields a redshift/blueshift scatter of 2.8%, significantly larger than 0.8% we obtained. The scatter (corresponding to 8400 km/s) is even larger than the full width of the broadest emission line identified in CDFS46 (see Fig. 6 of Szokoly et al. 2004). Finally, the strong X-ray emission line was classified as S K, which is supposed to be rather weak, and has never been detected before.
It’s interesting to note that in the GOODS-S ACS images, a nearby fainter galaxy ( = 24.7) is detected, 1.1″ to the southwest of the quasar CDFS 46. We note that the possibility to have a random galaxy brighter than = 24.7 within 1.1″ to certain known galaxy in GOODS-S is only 4%, suggesting that the two galaxies are likely at the same redshift. VLT/FORS spectroscopy observations have classified the nearby fainter galaxy as an emission line galaxy at redshift 1.609 based on the detection of [OII] 3727, and photometric measurements (Vanzella et al. 2008). This is within 0.5% to the redshift of CDFS 46 ( = 1.617)333The redshift of CDFS 46 was identified based on the detection of CIV, CIII] and MgII emission lines, see Wang et al. 2003; Szokoly et al. 2004.. This provides further evidence showing the redshift measurement of CDFS 46 is reliable. CDFS 11 is not covered by GOODS ACS images.
3.1 The Nature of the Outflow
Wang et al. (2003) has listed several possible explanations to the unusual strong emission line in CDFS 46, including iron emission line from a relativistic outflow intrinsic to the quasar, strong iron absorption edge due to a cold relativistic outflow, or intervening low-redshift ( 0.034) type 2 AGN. In the high spatial resolution GOODS ACS images, only CDFS 46 at = 1.617 and a nearby galaxy at = 1.609 (1.1″ apart) are visible within 3.5″ radius. Also, although strong Fe K line from neutral iron at 6.4 keV is not unusual in type 2 AGN, variation in the line central energy is not expected, contrary to what find in CDFS 46. These facts firmly rule out an intervening low-redshift type 2 AGN.
As Wang et al. (2003) stated, the emission line feature could also be statistically fitted by a blueshifted strong Fe absorption edge due to cold outflow. Spectral fitting to the 2 Ms spectrum shows that a heavy absorption (with = 3.2 1024 cm-2), covering 99.92% of the direct continuum, is required. Statistically we can not rule out this model based on the 2Ms exposure, however, we point out that, in addition to a Compton-thick cold outflow with a velocity of 0.65c, such a model can only work under more extreme conditions. These include that, the intrinsic X-ray luminosity of CDFS 46 needs to be 500 times larger (L2-10keV 3.0 1046 erg/s), which is way too luminous for its radio and optical emission444The intrinsic X-ray to optical ratio obtained under this model is 0.2.; the leaking X-ray emission (or scattered X-ray emission) can not exceed 0.12%; the cold outflow needs to slow down from 0.69c555The velocity of 0.74c (page L90, right column, 5th line) in Wang et al. (2003) should be corrected to 0.69c. There is a mistake in the calculation from Doppler factor to velocity in Wang et al. (2003). to 0.65c after 2.7 years (in the quasar rest frame), and have to be locate at a large distance from the unusual strong central continuum, to avoid to be ionized, otherwise we would see strong soft X-ray emission which is free from absorption by an ionized absorber. Assuming a density of 1011 cm-3, which is typical of the Broad Line Region in AGN, we obtained a distance cm from the central emission. Assuming the outflow cloud has a round or square shape, the outflow rate is then yr-1, which is higher than the Eddington accretion rate M☉ yr-1 of a 108 solar mass black hole, even for a very small covering factor of the outflow 10-4.
Therefor, the line feature we detected is most plausibly blueshifted iron line due to a relativistic outflow intrinsic to the quasar. The Doppler factor of 2.2 (for H- like FeXXVI Kα, 6.97 keV) implies bulk velocity of 0.65c (head-on) that must be responsible for the blueshift and relativistic boosting intensity. Assuming a lower ionization state would yields higher velocity up-to 0.7c (for neutral Fe Kα line). If the line is due to fluorescent emission or recombination emission from plasma ionized by X-ray continuum, the continuum must illuminate the outflow from sides to produce strong line with equivalent width above several keV. In this case, the equivalent width of the line can be boosted by a factor of DF3+Γ, where DF means the Doppler factor for the bulk motion, and the photon index of the X-ray continuum.
If the outflow is not ionized by the central X-ray emission, considering the recombination timescale for FeXXV is s (Allen 1973, here T5 is the temperature in unit of 105 K, and n9 the electron density in unit of cm-3.), typically in the range between 4.4 and 4.4 s (Chartas, et al. 2002), there must be some mechanics (such as magnetic driving) which keep heating the relativistic outflow. Migliari, Fender, & Mendez (2002) had reported the discovery of blueshifted and very strong iron emission lines (with velocity of 0.26c and equivalent width of 13 keV, Migliari, private communication) from extended X-ray emission in the X-ray binary system SS 433. Their discovery implied the existence of large-scale reheating of baryon, which may work for the extreme blueshifted iron line in CDFS 46. We note that the new HETG observation of SS 433 also shows relativistic red- and blue- shifted lines from the central part indicating two side relativistic jets (Marshall et al. 2002, Lopez et al. 2006). Taking the velocity of the outflow as 0.70c, the distance which the outflow travelled during the 7 years’ observation gap is pc = 1.8 cm (in the quasar rest frame), which is 5 times the dust sublimation radius (0.13 pc, here L45 is the intrinsic 0.5-10 keV luminosity in unit of erg s-1.). The distance is too large for an adiabatic cooling process except for the existence of reheating (Migliari, Fender, & Mendez 2002).
The marginal change in the observed line central energy can either be due to a slow down of the outflow (from 0.69c to 0.65c for H-like Fe K line), or a change of the ionization state, for example, from H-like Fe K dominated to He-line Fe K dominated (see table 3). In the former case, we expect weaker emission line due to the weaker boosting effect, which is consistent with observation (see Fig 1 and table 3). In the later case, the line could either goes stronger or weaker, depending on the exact ionization state. We note that Chartas et al. (2007a) discovered 0.92-yr and 5.9-day (rest frame) variability of the outflowing absorbing gas, with velocity of 0.1c (0.05c) and 0.4c (0.36c) due to He-like Fe Kα (H-like Fe Kα) resonant absorption, in the large gravitational lensed BAL quasar PG 111580.
3.2 Why So Rare?
Our two quasars are among the several AGNs which show X-ray outflows with velocity 0.4 c (see Table 1). Considering the large number of X-ray spectra obtained for quasars with advanced X-ray telescopes such as XMM and Chandra, why there are only several sources show relativistic outflowing features in their X-ray spectra? We contribute this to the orientation and observational selection effect. The broad absorption line outflow in quasars, with velocity up-to 0.1c, is believed to have a sky coverage of 20%. We propose that relativistic outflow with velocity c has similar or smaller sky coverage, thus can only be detected in a small fraction of quasars.
The instrumental bandpass, such as Chandra (0.3–10 keV) and XMM-Newton (0.3–12 keV), also limits the detection of relativistic outflowing features to certain redshift range. Assuming a Doppler factor 2 (or a bulk velocity of 0.6 c), only H- like Fe Kα line at redshift above 1.0 can be detected below 7 keV in the observed frame (where Chandra & XMM are sensitive to detect enough counts). Furthermore, to confirm an emission or absorption line feature in an X-ray spectrum requires high number of detected photons (more than several hundreds), thus they can only be detected in luminous sources or by long enough exposure.
3.3 Connection with jet or BAL Outflows in AGN
We have stated above that the strong blueshifted emission line could be possibly due to line emission from collimated jets. It’s interesting to note that all the three sources presenting blueshifted emission lines in Table 1 are radio-loud, suggesting the blueshifted emission lines and jets are somehow connected.
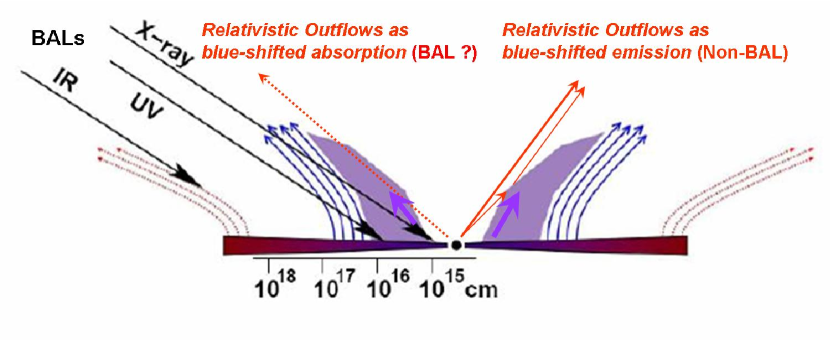
Historically, in additional to jet, the most dominant examples of AGN outflows have been found in Broad Absorption Line Quasars (BAL QSOs), which show absorption troughs in UV and optical lines with velocities up to tens of thousands of km s-1 (as large as 0.2 c, e.g., Hidalgo et al. 2007). Disk wind model is one of most popular model to BAL outflows (see Proga 2007), and the presence of X-ray shielding gas is required to prevent the gas from over ionization and attenuate the X-ray continuum as observed (with cm-2, Gallagher & Everett, 2007). We propose that the innermost region of the X-ray shielding gas could be outflowing at a higher velocity (such as 0.6 0.7 c), and more ionized, which produces no photo-electric but He-like and H-like iron absorption to central X-ray continuum. Actually, Chartas et al. (2002; 2003; 2007a; 2007b) have identified blueshifted X-ray absorption features in BAL QSOs at higher velocities and higher ionization level ( see table 1). An iron absorption line is produced when our line of sight is covered by the innermost shielding gas, and an emission line is observed when our line of sight is not covered but close to the outflowing direction (see Fig. 4). Note the most recent simulation work of Sim et al. (2008) shows a similar and clear pattern that outflow can produce both iron absorption and emission features, depending on the viewing angle. Taking into account the relativistic boosting effect, the blueshifted Fe K emission line can be seen at a significant level. The innermost region of the X-ray shielding gas might have sky coverage different from the broad absorption line region, thus the presence of X-ray absorption or emission line features does not necessarily link to the presence of broad absorption line in optical/UV band. However, it’s worth to look for possible blueshifted optical/UV features in CDFS 46 and CDFS 11, which requires optical spectra with much higher quality. On the other hand, the search for blueshifted X-ray features in high S/N X-ray spectra of BAL QSOs would also be helpful.
Finally, we note that BAL outflow could be aligned with jets, at least in some BAL QSOs, and they might be physically connected (e.g. see Wang et al. 2008). This suggest that both mechanisms (jet or BAL outflow) could probably work simultaneously to produce blueshifted emission/absorption lines with 0.4c in the X-ray spectra of quasars.
| Name | Type | Erest | Type | voutflow | Reference | |
|---|---|---|---|---|---|---|
| (keV) | (c) | |||||
| PG 1115080 | mini-BAL RQQ | 1.72 | 7.3, 9.8 | FeXXV Kα | 0.1, 0.4 | 1 |
| H 1413117 | LoBAL RQQ | 2.56 | 9, 15 | FeXXV Kα | 0.23, 0.67 | 2 |
| APM 082795255 | BAL RQQ | 3.91 | 8.1, 9.8 | FeXXV Kα | 0.2, 0.4 | 3 |
| CXO J033260-274748 | non-BAL RQQ | 2.579 | 22.2 | FeXXVI Kα | 0.83 | 4 |
| CXO J033225-274219 | RLQ | 1.617 | 16.2 | FeXXVI Kα | 0.69 | 5 |
| PKS 2149-306 | RLQ | 2.345 | 17.2 | FeXXVI Kα | 0.71 | 6 |
| PKS 0637-752 | RLQ | 0.654 | 1.60 | OVII Kα | 0.77 | 7 |
| New 1 Ms | Old 1 Ms | Wang03 | Comb. 2 Ms | |
|---|---|---|---|---|
| NH(1022cm-2) | 0.3 | 1.2 | 1.4 | 1.1 |
| 1.8 | 2.4 | 2.2 | 2.0 | |
| C/dof(continuum only) | 252.1/287 | 241.0/246 | 571.4/578 | 348.6/372 |
| Ec (keV) | 5.82 | 6.2 | 6.2 | 6.1 |
| (keV) | 0.15 | 0.18 | 0.2 | 0.3 |
| I | 0.9 | 1.4 | 1.3 | 1.3 |
| EW (keV) | 1.9 | 5.7 | 4.4 | 3.6 |
| C/dof(continuum+line) | 233.9/284 | 216.4/243 | 548.8/575 | 317.7/369 |
| F test | 99.99% | 99.999% | 99.996% | 99.9999% |
| a: H- like Fe Kα, | assuming . | ||
|---|---|---|---|
| Year | F | EW | vbulk/c |
| 2001 | 4.4 | 59 | 0.69 |
| 2007 | 4.0 | 44 | 0.65 |
| b: H- like Fe Kα | to He- like Fe Kα, | assuming . | |
| Year | F | EW | vbulk/c |
| 2001 | 4.4 | 59 | 0.69 |
| 2007 | 3.4 | 27 | 0.67 |
References
- (1) Allen, C. W. 1973, Astrophysical Quantities (London: Athlone Press)
- (2) Basu, D. 2006, AJ, 131, 1231
- (3) Cash, W. 1979, ApJ, 228, 939
- (4) Cappi, M. 2006, AN, 327, 10
- (5) Chartas, G. 2007, AIPC, 938, 3
- (6) Chartas, G., Brandt, W. N., Gallagher, S. C., & Garmire, G. P. 2002, ApJ, 579, 169
- (7) Chartas, G., Brandt, W. N., & Gallagher, S. C. 2003, ApJ, 595, 85
- (8) Chartas, G., Brandt, W. N., Gallagher, S. C., & Proga, D. 2007a, AmJ, 133, 1849
- (9) Chartas, G., Eracleous, M., Dai, X., Agol, E., & Gallagher, S. 2007b, ApJ, 661, 687
- (10) Dickey, L. M., & Lockman, F. J. 1990, ARA&A. 28, 215
- (11) Gallagher, S. C., & Everett, J. E. 2007, ASPC, 373, 305
- (12) Gebhardt, K., et al. 2000, ApJ, 539, L13
- (13) Giacconi, R., et al. 2002, ApJS, 139, 369
- (14) Hasinger, G., Schartel, N., & Komossa, S. 2002, ApJL, 573, L77
- (15) Hidalgo, P. R., et al. 2007, ASPC, V373, 287
- (16) Kellermann, K, L, et al. 2004, ApJ, 609, 539
- (17) Lopez, L.A., et al. 2006, ApJ, 650, 338
- (18) Marshall, H. L., Canizares, C. R., & Schulz, N. S. 2002, ApJ, 564, 941
- (19) Migliari, S., Fender, R., & Méndez, M. 2002, Science, 297, 1673
- (20) Nousek, J. A., & Shue, D. R. 1989, ApJ, 342, 1207
- (21) Page, K. L., Reeves, J. N., O‘Brien, P. T., & Turner, M. J. L. 2005, MNRAS, 364, 195
- (22) Proga, D. 2007, ASPC, 373, L267
- (23) Rosati, P., et al. 2002, ApJ, 566, 667
- (24) Sim, S. A., Long, K. S., Miller, L., & Turner, T. J. 2008, astro-ph/0805.2251
- (25) Szokoly, G. P., et al. 2004, ApJS, 155, 271
- (26) Vanzella, E., et al. 2008, A&A, 478, 83
- (27) Wang, J. X., et al. 2003, ApJ, 590, L87
- (28) Wang, J. X., et al. 2005, ApJ, 631, L33
- (29) Wang, J. X., et al. 2008, ApJ, 676, L97
- (30) Yaqoob, T., et al. 1998, ApJ, 505, L87
- (31) Yaqoob, T., et al. 1999, ApJ, 525, L9