New address ]École Polytechnique Fédérale, Lausanne CH-1015, Switzerland
Effect of magnesium doping on the orbital and magnetic order in
Abstract
In , the Ni3+ ions, with S=1/2 and twofold orbital degeneracy, are arranged on a triangular lattice. Using muon spin relaxation (SR) and electron spin resonance (ESR), we show that magnesium doping does not stabilize any magnetic or orbital order, despite the absence of interplane Ni2+. A disordered, slowly fluctuating state develops below K. In addition, we find that magnons are excited on the time scale of the ESR experiment. At the same time, a factor anisotropy is observed, in agreement with orbital occupancy.
pacs:
76.75.+i, 75.50.Ee, 76.30.Fc, 76.50.+gI Introduction
Orbital physics in oxides has attracted considerable interest thanks to the discovery of high-temperature super-conductivity in cuprates and colossal magnetoresistance in manganites Tokura and Nagaosa (2000). These macroscopic properties are based on strong correlations between charge, orbital and magnetic degrees of freedom. In this context, numerous studies have been performed on the orbital and magnetic orders in the isostructural and notionally isoelectronic compounds Goodenough et al. (1958); de Brion et al. (2005); Chung et al. (2005), Bongers and Enz (1966); Chappel et al. (2000a, b); Lewis et al. (2005); de Brion et al. (2005, 2007) and more recently Wawrzyńska et al. (2007a, b); Lancaster et al. (2008). These compounds offer the possibility of studying a triangular lattice of Ni3+ ions with spin and twofold orbital degeneracy ( orbitals). In and , it has been possible to characterize both the orbital and magnetic ground states. However in , these remain a matter of debate.
The octahedral oxygen crystal field at the ions lowers the original spherical SO symmetry of the Coulomb field and lifts partially the orbital degeneracy, leaving the three fold orbitals lower in energy than the orbital doublet. In , the Jahn-Teller (JT)-effect further lifts the orbital degeneracy, giving rise to a ferro orbital ordering of the orbitals Chappel et al. (2000b). In , charge transfer occurs 3 with an associated charge ordering Wawrzyńska et al. (2007a, b). this process removes the orbital degeneracy. In , there is no experimental evidence for long-range orbital ordering. Evidence for a dynamic JT-effect Barra et al. (1999) has been reported while an EXAFS study A.Rougier et al. (1995) at room temperature concluded rather that orbitals are occupied. More recently, this orbital occupancy with no long range orbital order has been confirmed by a neutron diffraction study Chung et al. (2005).
Magnetic ordering is affected by orbital ordering. In , a long range antiferromagnetic order is observed below K Bongers and Enz (1966); Chappel et al. (2000b); C.Darie et al. (2005); Lewis et al. (2005); Baker et al. (2005) although the proposed A type magnetic structure (ferromagnetic layers ordered antiferromagnetically) cannot account for all the observed magnetic excitations de Brion et al. (2007). shows a more complex antiferromagnetic order Wawrzyńska et al. (2007a, b); Lancaster et al. (2008), due to different charges on the nickel ions: the () sublattice is arranged in ferromagnetic rows ordered antiferromagnetically while the two other nickel sites carry a small magnetic moment (). Surprisingly, no long range magnetic order is present in . The magnetic ground state has variously been described as a frustrated antiferromagnet Hirota et al. (1991), a spin glass Yamaura et al. (1996) and a disordered quantum state Kitaoka et al. (1998).
It must be emphasized that, contrary to and , is never stoichiometric and this may affect the magnetic ground state: Núñez-Regueiro et al. Núñez-Regueiro et al. (2000) have shown that the presence of extra ions in the Li layers induces a ferromagnetic coupling between the triangular planes which competes with the main antiferromagnetic coupling leading to magnetic frustration. It may also affect the orbital order since it generates also JT-inactive ions in the layersPetit et al. (2006). So how would a pure sample behave? To address this issue, we have investigated magnesium doped , that is LiMgxNi1-xO2. Doping with magnesium is expected to stabilize the lithium ions on their crystallographic sites and thus to prevent insertion of nickel ions in lithium layers Pouillerie et al. (2000). In this paper, we discuss muon spin relaxation (SR) and electron spin resonance (ESR) measurements performed to investigate the magnetic and orbital order of magnesium-doped . A comparison with quasi stoichiometric is presented.
II Sample characterization
Powder samples were synthetized using the procedure described by Pouillerie et al. Pouillerie et al. (2000) for LiMgxNi1-xO2 and by Bianchi et al. Bianchi et al. (2001) for . X-ray diffraction patterns were collected using a Siemens 5000 diffractometer. Structural refinement using the Rietveld method was performed with the Fullprof program. All the samples crystallize in a rhombohedral structure (space group ) with ions occupying the site and ions the site. The crystal structure can be imagined as an alternating stacking of lithium and nickel slabs A.Rougier et al. (1995) with edge-sharing oxygen octahedra. Nickel ions are arranged on a triangular lattice. Oxygen ions form an octahedron around nickel sites which is responsible for lifting the orbital degeneracy via the crystal field. The Rietveld refinements confirm that the samples are deficient in lithium. In , replaces Bianchi et al. (2001). In LiMgxNi1-xO2, the detailed study by Pouillerie et al Pouillerie et al. (2000) has shown that, for , only replaces . This is in agreement with our X ray data as well as our magnetic susceptibility data (see below). The resultant non stoichiometry in the Ni layers has been described in ref.Bianchi et al. (2001) and Pouillerie et al. (2000).
| LiNiO2 | LiMgxNi1-xO2 | |||
| x=0.02 | x=0.05 | x=0.10 | ||
| cell param. | a=2.8728 | a=2.8724 | a=2.8734 | a=2.8773 |
| (Å) | c=14.184 | c=14.187 | c=14.1978 | c=14.2245 |
| +29K | +23.5K | +22K | +22K | |
| per | +29K | +24K | +23K | +24.5K |
| per Ni | 2.1 | 2.1 | 2.1 | 2.0 |
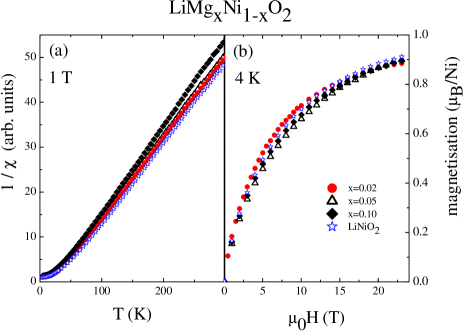
Structural and magnetic properties of the samples studied are presented in Table 1. Magnetic susceptibility measurements were performed in a 1T magnetic field in the temperature range 4K - 300K (Figure 1(a)). All samples present a Curie-Weiss behavior at high temperature with revealing dominant ferromagnetic interactions (see table 1). The effective magnetic moment deduced from the slope remains close to 2.0 per Ni ion. The Curie-Weiss temperature in Li1-xNi1+xO2 is a linear function of the off-stoichiometry Bianchi et al. (2001): it extrapolates to =+24K for =0 and can be used to determine : =0.01 in our sample. For the magnesium doped samples, the Curie-Weiss temperature is scarcely affected by the number of Mg ions. It is also quite close to the value expected for pure and reduced compared to our . This is a confirmation that the additional ferromagnetic interaction present in non-stoichiometric is absent in magnesium doped . This makes these samples particularly interesting to determine the orbital and magnetic ground states of pure .
Magnetization measurements were performed at 4.2 K in magnetic fields up to 23 T (Figure 1(b)). Here also a common behavior for all the samples is observed: a smooth increase of the magnetization and absence of saturation as in a spin glass. This is the same behavior as in quasi stoichiometric . In the following, we will present SR and ESR results obtained on Mg doped sample with those on quasi stoichiometric .
III SR results
Our muon-spin relaxation (SR) experiments Blundell (1999) were carried out using the GPS instrument at the Paul Scherrer Institute (PSI), Villigen, Switzerland. Spin-polarized positive muons (, mean lifetime s, momentum MeV, gyromagnetic ratio MHz T-1) were implanted into the bulk of our polycrystalline samples. Dipole field calculations carried out for the structurally similar compound suggest that the muon stopping sites are near the oxygen ions that form the octahedra around the ions Baker et al. (2005). The muons stop quickly in the samples (within ns) without significant loss of spin polarization, and their average spin polarization is measured as a function of time using the asymmetry, , of positrons emitted by muons decaying within the sample.
The measured positron asymmetry, , was corrected for the non-relaxing background signal resulting from muons stopping in the cryostat and sample holder and normalized to unity. The corrected asymmetry, , is plotted in Fig. 2 for both compounds. It is clear that in both samples there is no spin precession of the implanted muons, which would give rise to coherent oscillations in the asymmetry spectra. Together with the fact that the high and low temperature spectra relax to the same background asymmetry, this is strong evidence for a lack of long range magnetic order in either sample, as already suggested by the magnetization data (Fig. 1). The form of is sensitive to spin fluctuations on timescales between approximately and s.
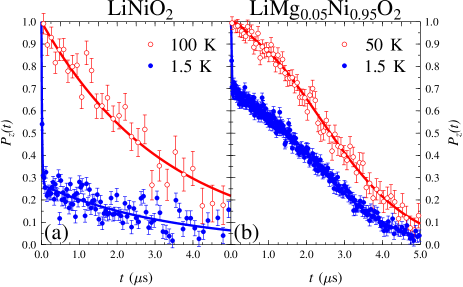
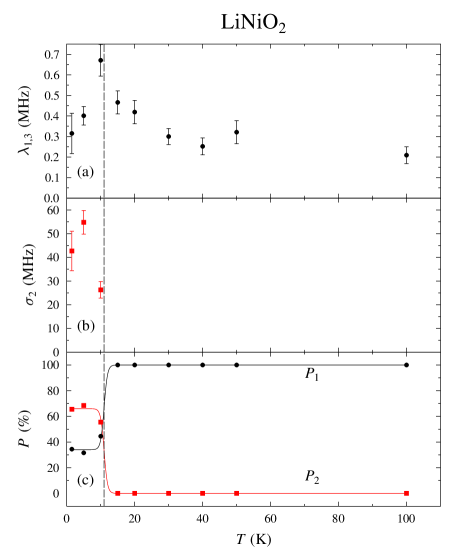
Examining the data plotted in Figure 2, we see that in both compounds the low temperature data is composed of two relaxing components, one with a much higher relaxation rate than the other. The previous SR study of used a stretched exponential to describe the asymmetry data Chatterji et al. (2005), but this parametrization was not able to describe our data for either compound over the entire measured temperature range. Two relaxing components were used by Baker et al. (2005) to describe the muon spin relaxation at temperatures just above in , with the amplitude of the fast relaxing component increasing as was approached. Coupled with ac susceptibility measurements, this was taken to be evidence for coalescing magnetic clusters preceding the onset of long range magnetic order. In both of the present samples such long range magnetic order never sets in. The form of the slower relaxing component in each sample is distinguishable, as can be seen in Figure 2, and is the same at high and low temperature. We can also see that there is a significant difference in the proportion of the fast and slow relaxing components of the asymmetry between the two samples. This is due to a difference in the quasistatic magnetic volume fraction (see below).We now go on to discuss the results from each sample in turn.
Below approximately K, the asymmetry signal in quasi-stoichiometric is well described by the function:
| (1) |
where the exponential component describes the slow relaxing component of the signal and the Gaussian component describes the fast relaxation seen at short times (Figure 2). It is difficult to resolve the exact form of the fast relaxing component, in either sample, because the relaxation rate is so large.
At low temperature and , which is the form expected for the relaxation observed in a powder sample in the slow fluctuation (quasistatic) limit. If the sample exhibited long range magnetic order would be multiplied by an oscillating function, as seen in Baker et al. (2005) or Lancaster et al. (2008). The ratio of and and the lack of muon precession suggests that at low temperature we have quasistatically disordered magnetic moments throughout the sample. The disorder in the magnetic moments prevents the observation of coherent muon precession. From the size of the Gaussian relaxation rate () we can estimate that the distribution of magnetic fields is approximately T.
It is possible to describe the asymmetry data successfully with equation 1 up to around K, where we observe a sharp crossover to a regime where the muon spin relaxation is well described by a single exponential , typical of paramagnetic spin fluctuations when the fluctuation rate is fast compared with the width of the magnetic field distribution. The crossover is accompanied by a peak in , seen in Figure 3, associated with the slowing down of the electronic fluctuations. Chatterji et al. (2005) found a similar peak in their measured relaxation rate in an applied longitudinal field of T, as would be expected if the field has decoupled the muon relaxation due to the quasistatic moments. Their zero field results Chatterji et al. (2005) show a sharp increase in the relaxation rate of the stretched exponential used to parametrize the data below K. The magnitude of the relaxation rate found at low temperature is similar to the value of we find. Parametrizing our data in terms of two separate components (Equation 1) allows us to separate these contributions to the muon relaxation in zero applied field. From the magnitude of at high temperature, we can estimate the electronic fluctuation rate in the paramagnetic phase to be ps.
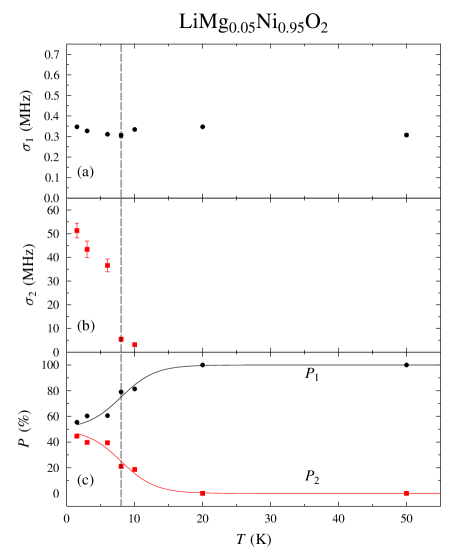
In the behavior observed is quite similar to the quasi-stoichiometric case. Again we see two separate components to the muon spin relaxation at low temperature, but in this sample both components take a Gaussian form. This can be described as:
| (2) |
where we take . We must consider why the slow relaxing component is Gaussian rather than exponential in this case, as it is also at high temperature. This appears to be due to the motional narrowing of the electronic fluctuations, which are sufficiently fast to leave the muon time window, so that the muon is sensitive to the Gaussian distribution of magnetic fields due to randomly orientated nuclear dipoles. This is consistent with the small and almost temperature independent slow Gaussian relaxation , plotted in Figure 4(a). Below K we do not observe a ratio in the amplitudes of the two components, so the slowly fluctuating region of the sample is not occupying the full sample volume. From the ratio we can estimate that slowly fluctuating moments occupy approximately three-quarters of the sample volume. The SR measurements suggest that the electronic moments in the rest of the sample fluctuate sufficiently fast that the slow, temperature-independent relaxation is due to the nuclear moments. The magnitude of is similar to that observed in the quasi-stoichiometric sample, so the distribution of magnetic fields at the muon stopping site is similar, T.
From the SR data we can conclude that Mg-doping has a significant effect on the spin dynamics of . While neither sample shows long-ranged magnetic order, as the magnetization data confirms (Fig. 1), the low-temperature state is affected by the presence of the ions. The quasi-stoichiometric sample shows a sharp crossover to a disordered and slowly fluctuating state throughout the sample volume below K. This is accompanied by a peak in the relaxation rate , associated with the slowing down of electronic fluctuations. The 5 % Mg-doped sample enters a similar ground state at low temperature, but one that only occupies around three-quarters of the sample volume, the remaining part fluctuates too fast to be detectable, and only the nuclear origin of the muon depolarization is observable. Despite the different parametrization, the results of the previous SR study Chatterji et al. (2005) of appear to be intermediate between those of our doped and undoped samples. Their sample’s almost Gaussian high-temperature relaxation is quite similar to that in our Mg-doped sample, and the magnitude of the low-temperature relaxation rate is similar to that of the fast relaxing components observed in both of our samples. The 0.6T longitudinal field measurements give a relaxation rate with a temperature dependence quite similar to the slow relaxing component in our sample. This is in agreement with our assignment of the slow relaxing component to fast fluctuating moments that would not be decoupled by such a field. These comparisons suggest that Chatterji et al’s sample is likely to have had a slightly higher concentration of substitutional defects than our sample, but lower than our Mg-doped sample.
IV ESR results
ESR measurements of magnetic ions were carried out over a temperature range of 4 to 200 K and at three different frequencies, that is, 210, 314 and 420 GHz, using a quasi optical bridge and a 14 T superconducting magnet. A field modulation was used so that the derivative of the ESR absorption is recorded (Fig.5).
In highly correlated systems ESR absorption presents a large linewidth; measuring at high frequencies provides better resolution and also makes it possible to follow magnetic modes up to high magnetic fields. Both the quasi-stoichiometric and Mg-doped samples exhibit a similar ESR response. Three different temperature regimes are observed (see Figs. 5-7). Above about 100 K, the ESR absorption has a Lorentzian lineshape, in particular the recorded derivative spectrum is symmetric and its linewidth remains nearly constant for all three frequencies. Below K, the ESR signal becomes asymmetric and widens with increasing frequency, reflecting some kind of anisotropy, crystalline or magnetic in origin. This anisotropy increases dramatically as the temperature is lowered. This is particularly clear in Fig. 6 and 7 where the ESR spectrum total linewidth is plotted as a function of temperature for the three different frequencies. A third temperature regime occurs below about 30 K where the linewidth levels off. Note that the ESR spectra are always wider in the Mg doped sample than in the quasi stoichiometric one. Their lineshapes at low temperature differ slightly. We will concentrate on the extremal features (peaks P1 and P2) which are similar in both powdered samples.
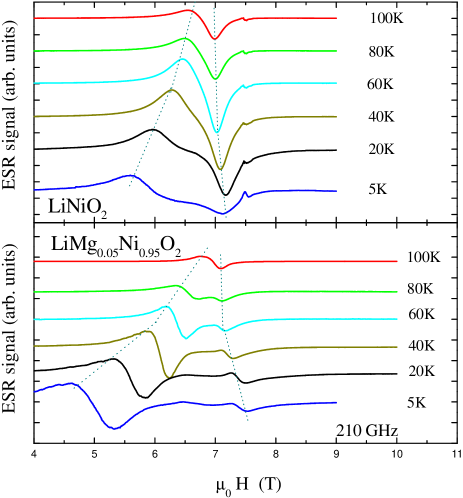
The question now is to determine the origin of the broadening of the ESR signals with temperature. There are two possibilities. Either it arises from spin-orbital coupling causing an anisotropy of the -factor when the expected JT effect occurs as observed in Chappel et al. (2000b), or it arises from magnetic excitations when some magnetic order is present. Both processes may occur simultaneously. To go further into the analysis, we use a frequency ()/magnetic field () diagram where the extrema of the ESR spectra are plotted. This procedure enables us to determine the main ESR absorption processes which occur in the powdered samples. Using a linear approximation, we can calculate the corresponding -factors from the high field slope and the zero field gaps due to magnetic excitations. This approximation is valid at high fields (see for instance Ref. de Brion et al., 2007).The corresponding frequency/field diagram and linear fit are shown at 5 K on Fig. 6 for quasi stoichiometric and on Fig. 7 for Mg doped . The light-blue line in the middle is the one calculated for the paramagnetic -factor of free electrons (, no gap). This linear procedure is then done for several temperatures. As the quality of spectra may vary from one frequency to another error bars may be wide. Above 100 K, the -factor is unique with the same value for both samples quite close to the one derived for the purest : Chappel et al. (2002). While spectra are broadening below 100 K, two distinguishable branches are observed with different -factor and zero field gap. Below 30 K both -factors stay almost constant while the zero field gaps continue to vary, at least for Mg doped . From this analysis, it is clear that two processes occur simultaneously, in both samples: the factor becomes anisotropic and, at the same time, magnetic excitations develop with a significant zero field gap for one branch (30-50 GHz at 5K).
If one assumes a crystallographic origin for the anisotropy, one can calculate the effective -factor of the spin hamiltonian within perturbation theory applied to the symmetry considered Ibers and Swalen (1962). For an elongation of the oxygen octahedra (occupied orbitals ) :
| (3) | ||||
| (4) |
whereas for a flattening of the octahedra (occupied orbitals ):
| (5) | ||||
| (6) |
where is the spin-orbit coupling and the crystal field splitting. Since for a more than half filled ion as Ni3+, we expect for elongated octahedra and for flattened octahedra. In a powder spectrum, all the orientations are equally probable giving rise to a wide spectrum with a particular lineshape for each case. It was previously shown that in , a powdered spectrum with is observed at 200 K while a single value of is observed in Chappel et al. (2002) . This is confirmed here for our sample as well as the Mg doped sample above 100 K with the same unique value .
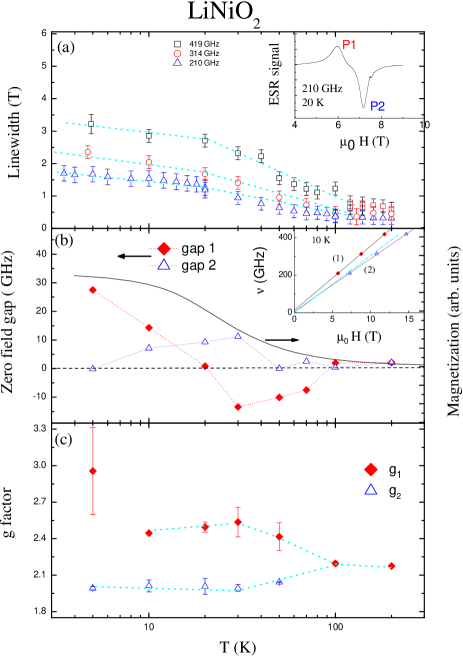
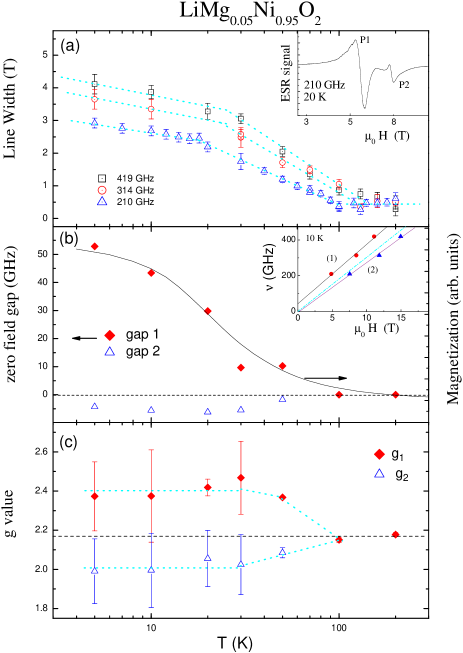
Below , two different values of are observed: and . Since is equal to , as in the model with occupied ) orbitals, our results are slightly in favor of this model. This is the same orbital occupancy as in Chappel et al. (2000b). However, in the orbital sector, the Li compounds differs from that in the Na compound in at least two ways. First, in , there is a ferro-orbital ordering (cooperative JT effect) below 480 K leading to a monoclinic unit cell. In Li compounds, no long range orbital order is observed: the unit cell remains orthorhombic. Second, for the local orbital occupancy, it is clear experimentally in that the orbitals are occupied at low temperature Chappel et al. (2000b). In Li compounds, the situation is more controversial. An ESR study Barra et al. (1999) suggests that a dynamical Jahn-Teller effect exists that becomes static with at low temperature and high magnetic field, which means orbital occupancy. An EXAFS study A.Rougier et al. (1995) at room temperature implies the presence of elongated oxygen octahedra around the Ni ions, in agreement with the orbital occupancy. More recently, a neutron diffraction and pair density function analysis Chung et al. (2005) concludes that local orbital order occurs below 375 K with the orbitals organized in trimers with no long range order. How can we reconcile all these different results? Note first that our ESR spectra are similar to those observed by Barra et al: a single line at high temperature and a splitted spectrum at low temperature. Our more detailed frequency study shows that the associated g-anisotropy corresponds rather to the orbital occupancy and that there is also an opening of a zero field gap, which reveals the presence of magnons. Then our results at low temperature are in agreement with the EXAFS and neutron measurements. The single line observed at 200K arises then from an exchange or a motional mechanism which narrows the g factor anisotropy. For the time scale of the ESR measurements, at the highest frequency, the g anisotropy linewidth can be evaluated at 1.7 T, which corresponds to a characteristic time for the measurement of ps. We conclude that the electronic fluctuation time is temperature dependent with a value smaller than 20ps above 100K while below 100K, it increases to a value longer than 20ps. From SR data in the paramagnetic regime, the electronic fluctuation time is estimated at ps for at 100K; it is outside the muon time window for the Mg doped sample at 50K. These results are quite consistent with those of ESR, assuming that the Mg doped sample has a higher fluctuating rate. In EXAFS the time scale of the measurement is much shorter, typically s so that no narrowing process is observed at room temperature. As for the neutron diffraction measurements in refChung et al. (2005), we do not know the time scale of the experiment so we cannot conclude further. We propose then the following mechanism: the electrons occupy the orbitals but the z axis moves. This mechanism is reduced at low temperature at the same time when magnetic excitations are developing (opening of a zero field gap).
These magnetic excitations are clearly observed in the Mg doped sample as the progressive opening of a gap for both extremal branches which follows the sample magnetization (measured at 1T). The importance of the gap in branch 1 (51 GHz at 4K) rules out an interpretation with a ferromagnetic origin. both branches look rather like what is observed in an antiferromagnet. However no long range magnetic order occurs in this sample as seen from the magnetization and muon measurements. This means that the time scale on which the sample is probed in ESR is sufficiently short to excite collective magnons. Looking at the lineshift due to these magnons at 5K for instance in , 50GHz for one branch, 5 GHz for the other branch, we get a characteristic time at s and s respectively. This means that the correlation time of the spin fluctuations is longer than these values for magnons to be observed in ESR. In SR, if we assume the same dipolar field created by the Ni ions as in , a precession at -s is expected if the spin correlation time is longer. This is not the case in our samples.
If we now compare the ESR spectra for each sample, we see that they have the same intrinsic line width, around 0.5 T, as observed with SR. The different magnon branches are better defined in the Mg sample (the total lineshape takes the form of two, quite well separated, modes) than in (the lineshape appears more like a continuous distribution of modes). This may be related to the differences observed in the SR data: the quasistatic glassy state in gives rise to a large distribution of magnetic modes; the different relaxing phases in the Mg doped sample may be related to the two main magnetic modes observed in ESR: one is associated with the value, and has the larger ESR signal. It corresponds to the 2/3 statistical weight of the contribution in a powder. It gives the quasistatic signal in SR. The second one is associated with the value and corresponds to the 1/3 contribution. It fluctuates two quickly to give a contribution in SR. At high temperature, the spins in the parallel and perpendicular directions are coupled via an exchange mechanism which narrows the ESR line and, at the same time, pushes the spin fluctuation rate outside de SR time window. In LiNiO2, this same exchange mechanism occurs at high temperature, although probably at a slower rate since the spin contribution is visible in SR. At low temperature, the quasi static state concerns the whole sample as seen in SR.
V Conclusion
In conclusion, we have studied a Mg doped sample without interplane Ni ions compared it to a quasi stoichiometric sample. Both the magnetization and SR data clearly show that the samples do not undergo a transition to long-ranged magnetic order while the ESR data demonstrate the presence of magnetic excitations with a correlation time longer than -s. This low-temperature state does, however, change with Mg-doping. In our quasi-stoichiometric sample a disordered, slowly fluctuating state develops in the whole sample volume below K. The corresponding antiferromagnetic magnons excited in ESR have a large frequency distribution with a complex temperature dependence. Mg-doping leads to faster electronic fluctuations and smaller slowly fluctuating volume for SR. The antiferromagnetic magnons in ESR are better defined and the largest spin gap follows the macroscopic magnetization. In the low temperate state, both compounds present an anisotropy of the g factor in agreement with the orbital occupancy with and . A motional narrowing process occurs at the same time when the magnetic excitations disappear, independent of the Mg doping. From this study, it is clear that interplane Ni ions alter the magnetic properties of but its removal and replacement by Mg is not sufficient to allow the establishment of long range magnetic order. In addition, we have shown that both compounds have a single orbital occupancy, as in NaNiO2, but an exchange mechanism correlated with the magnetic interactions produces dynamical effects above 100K.
Acknowledgements.
Part of this work was performed at the Swiss Muon Source, Paul Scherrer Institute, Villigen, Switzerland. We thank Alex Amato for technical assistance. T.L. acknowledges support from the Royal Commission of 1851. We wish to acknowledge Bálint Náfrádi for helping us with the ESR experiments and László Forró from the Swiss Federal Institute of Technology in Lausanne/Switzerland for gratefully providing the ESR experimental setup. The Grenoble High Magnetic Field Laboratory is associated to the Université Joseph Fourier-Grenoble I.References
- Tokura and Nagaosa (2000) Y. Tokura and N. Nagaosa, Science 288, 462 (2000).
- Goodenough et al. (1958) J. B. Goodenough, D. G. Wickham, and W. J. Croft, Journal of Physics and Chemistry of Solids 5, 107 (1958).
- de Brion et al. (2005) S. de Brion, M. D. Núñez-Regueiro, and G. Chouteau, Frontiers in magnetic materials (Springer Verlag, 2005).
- Chung et al. (2005) J.-H. Chung, T. Proffen, S. Shamoto, A. M. Ghorayeb, L. Croguennec, W. Tian, B. C. Sales, R. Jin, D. Mandrus, and T. Egami, Phys. Rev. B 71, 064410 (2005).
- Bongers and Enz (1966) P. Bongers and U. Enz, Solid states commun. 4, 153 (1966).
- Chappel et al. (2000a) E. Chappel, M. D. Núñez-Regueiro, F. Dupont, G. Chouteau, C. Darie, and A. Sulpice, Eur. Phys. J. B 17, 609 (2000a).
- Chappel et al. (2000b) E. Chappel, M. D. Núñez-Regueiro, G. Chouteau, O. Isnard, and C. Darie, Eur. Phys. J. B 17, 615 (2000b).
- Lewis et al. (2005) M. Lewis, B. Gaulin, L. Filion, C. Kallin, A. Berlinsky, H. Dabkowska, T. Qiu, and J. Copley, Phys. Rev. B 72, 014408 (2005).
- de Brion et al. (2007) S. de Brion, C. Darie, M. Holzapfel, D. Talbayev, L. Mihály, F.Simon, A. Jánossy, and G. Chouteau, Phys. Rev. B 75, 094402 (2007).
- Wawrzyńska et al. (2007a) E. Wawrzyńska, R. Coldea, E. Wheeler, I. Mazin, M. D. Johannes, T. Sörgel, R. I. M. Jansen, and P. G. Radaelli, Phys. Rev.Lett. 99, 157204 (2007a).
- Wawrzyńska et al. (2007b) E. Wawrzyńska, R. Coldea, E. Wheeler, T. Sörgel, R. I. M. Jansen, P. G. Radaelli, and M. Koza, arXiv:0710.2811 (2007b).
- Lancaster et al. (2008) T. Lancaster, S. Blundell, P. Baker, M. Brooks, W. Hayes, F. Pratt, R. Coldea, T. Sörgel, and M. Jansen, Phys. Rev. Lett. 100, 017206 (2008).
- Barra et al. (1999) A.-L. Barra, G. Chouteau, A. Stepanov, A. Rougier, and C. Delmas, Eur. Phys. J. B 7, 551 (1999).
- A.Rougier et al. (1995) A.Rougier, C.Delmas, and A. Chadwick, Solid State Commun. 94, 123 (1995).
- C.Darie et al. (2005) C.Darie, P. Bordet, S. de Brion, M. Holzapfel, O. I. Lecchi, and E. Suard, Eur. Phys. J. B 43, 159 (2005).
- Baker et al. (2005) P. J. Baker, T. Lancaster, S. J. Blundell, M. L. Brooks, W. Hayes, D. Prabhakaran, and F. L. Pratt, Phys. Rev. B 72, 104414 (2005).
- Hirota et al. (1991) K. Hirota, Y. Nakazawa, and M. Ishikawa, J. of Phys.: Condens. Matter 3, 4721 (1991).
- Yamaura et al. (1996) K. Yamaura, M. Takano, A. Hirano, and R. Kanno, Journal of solid state chemistry 127, 109 (1996).
- Kitaoka et al. (1998) Y. Kitaoka, T. Kobayashi, A. , H. Wakabayashi, Y. Niino, H. Yamakage, S. Taguchi, K.Amaya, K. Yamaura, M. Takano, et al., Journal of the Physical Society of Japan 67, 3703 (1998).
- Núñez-Regueiro et al. (2000) M. D. Núñez-Regueiro, E. Chappel, G. Chouteau, and C. Delmas, Eur. Phys. J. B 16, 37 (2000).
- Petit et al. (2006) L. Petit, G. M. Stocks, T. Egami, Z. Szotek, and W. M. Temmerman, Phys. Rev. Lett. 97, 146405 (2006).
- Pouillerie et al. (2000) C. Pouillerie, L. Croguenne, P. Biensan, P. Willmann, and C.Delmas, Journal of The Electrochemical Society 147, 2061 (2000).
- Bianchi et al. (2001) V. Bianchi, D. Caurant, N. Baffier, C. Belhomme, E. Chappel, G. Chouteau, S. Bach, J. P. Pereira-Ramos, A. Sulpice, and P. Wilmann, Solid State Ionics 140, 1 (2001).
- Blundell (1999) S. J. Blundell, Contemp. Phys. 40, 175 (1999).
- Chatterji et al. (2005) T. Chatterji, W. Henggeler, and C. Delmas, J. Phys. Condens. Matter 17, 1341 (2005).
- Chappel et al. (2002) E. Chappel, M. D. Núñez-Regueiro, S. de Brion, G. Chouteau, V. Bianchi, D. Caurant, and N. Baffier, Phys. Rev. B 66, 132412 (2002).
- Ibers and Swalen (1962) J. Ibers and J. Swalen, Phys. Rev. 6 (1962).