CLEO Collaboration
Search for Violation in the Dalitz-Plot Analysis of
Abstract
We report on a search for asymmetry in the singly Cabibbo-suppressed decay using a data sample of 818 pb-1 accumulated with the CLEO-c detector on the resonance. A Dalitz-plot analysis is used to determine the amplitudes of the intermediate states. We find no evidence for violation either in specific two-body amplitudes or integrated over the entire phase space. The asymmetry in the latter case is measured to be .
pacs:
13.25.Ft, 11.30.Er-meson decays are predicted in the Standard Model (SM) to exhibit -violating charge asymmetries smaller than SM . Measurement of a asymmetry in the system with higher rate would clearly signal new physics (NP) bigi ; nir . Singly Cabibbo-suppressed (SCS) decays via transitions are sensitive to NP contributions to the penguin process. Interestingly, such processes do not contribute to either the Cabibbo-favored () or the doubly Cabibbo-suppressed () decays. Direct violation in SCS decays could arise from interference between tree and penguin processes. A non-zero asymmetry can occur if there is both a strong and weak phase difference between the tree and penguin processes. In charged -meson decays, mixing effects are absent, allowing us to probe direct violation and consequently NP.
Weak decays of mesons are expected to be dominated by quasi two-body decays with resonant intermediate states. Dalitz-plot analysis techniques can be used to explore the resonant substructure. The intermediate structures of decay were studied by E687 e687 with a Dalitz-plot analysis and by FOCUS focus with a non-parametric technique. BABAR searched for direct asymmetries in this mode using a counting method babar . Using 281 pb-1 of data, CLEO previously measured the absolute hadronic branching fractions and the asymmetries of Cabibbo-favored -meson decay modes and the phase-space integrated asymmetry in the mode we study here cleo281 . The previous investigations of this decay were either limited by statistics, and did not search for violation, or did not study the resonant substructure.
We present the results of a search for direct asymmetry in the decay . This includes a study of the integrated decay rate, as well as decays through various intermediate states. We perform the present analysis on 818 pb-1 of collision data collected at a center-of-mass energy of 3774 MeV with the CLEO-c detector det1 ; det2 ; det3 at the Cornell Electron Storage Ring (CESR). The CLEO-c detector is a general purpose solenoidal detector that includes a tracking system for measuring momentum and specific ionization () of charged particles, a Ring Imaging Cherenkov detector (RICH) to aid in particle identification, and a CsI calorimeter for detection of electromagnetic showers.
We reconstruct , and the charge-conjugate mode . (Charge-conjugate modes are included throughout this report unless noted otherwise.) The event reconstruction criteria are the same as that used in Ref. cleo281 . Charged tracks are required to be well measured and to satisfy criteria based on the track fit quality. They must also be consistent with coming from the interaction point in three dimensions. Pions and kaons are identified using and RICH information, when available. If either or RICH information (or both) is missing we still use the track in the analysis. Detail can be found in Ref. cleo281 . We define two signal variables:
| (1) |
and
| (2) |
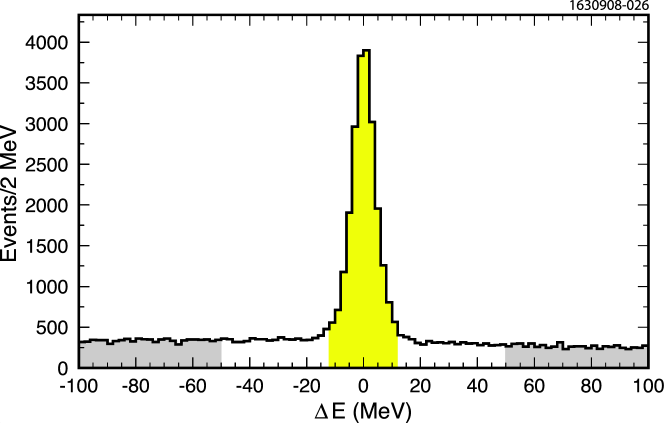
where and are the energy and momentum of each decay product, and is the energy of one of the beams. For a correct combination of particles, should be consistent with zero, and should be consistent with the mass. Fig. 1 shows distribution of data. We select candidates that have within MeV of zero, corresponding to 2.5 standard deviations (). If in any event there are multiple candidates satisfying the criterion using entirely separate combinations of tracks, we accept all of these candidates. Otherwise if there are multiple candidates sharing tracks we keep only the combination with the smallest .
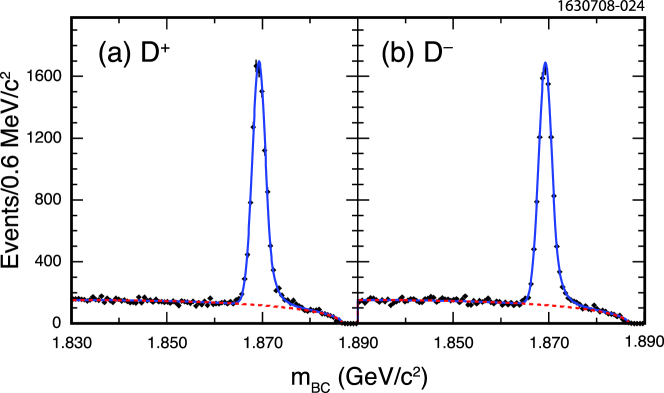
To determine the signal yields of the and samples, we simultaneously fit the distributions from the samples and require they have the same signal shape. For the signal, we use a Crystal Ball line shape function cb , whose parameters are allowed to float. For the background, an ARGUS function argus is used with shape parameters determined from the events in the sideband (50 MeV 100 MeV). We find and . Figure 2 shows the distributions of and samples with fit functions superimposed; the total is 241 for 180 degrees of freedom (d.o.f.).
We obtain the efficiency from a GEANT-based signal Monte Carlo (MC) simulation of the detector. The signal MC requires one of the two mesons in an event to decay in accordance with all known modes and the other one to decay to the signal mode. For the signal meson, we generate events that uniformly populate phase space. The average efficiency, accounting for a non-uniform population density of data, is calculated as follows. The Dalitz plot of the data is first divided into 16 bins that are approximately equally populated. The signal yields are obtained from the fits bin by bin and the corresponding efficiencies are calculated from the MC. The average efficiency is the sum of the yields divided by the sum of the efficiency-corrected yields. We find the efficiencies for the decays are and , respectively. The asymmetry, defined as
| (3) |
where are the measured yields, is measured as
| (4) |
| Magnitude | Phase (∘) | Fit Fraction (%) | |
| Fit A [d.o.f. = 898/708] | |||
| 1(fixed) | 0(fixed) | ||
| NR | |||
| Total Fit Fraction = | |||
| Fit B [d.o.f. = 895/708] | |||
| 1(fixed) | 0(fixed) | ||
| (800) | |||
| Total Fit Fraction = | |||
| Fit C [d.o.f. = 912/710] | |||
| 1(fixed) | 0(fixed) | ||
| LASS | |||
| Total Fit Fraction = | |||
For the Dalitz-plot analysis, we consider the events from the signal box (12 MeV and MeV/) corresponding to a 2.5 range in each variable. The signal purity is obtained from the fit. The Dalitz-plot distribution is parameterized using the isobar model formalism described in Ref. kopp . The decay amplitude as a function of Dalitz-plot variables is expressed as a sum of two-body decay matrix elements,
| (5) |
where each term is parameterized with a magnitude and a phase for the intermediate resonance , and ranges over all resonances. We choose and as the two independent Dalitz-plot variables. The partial amplitude is parameterized using the Breit-Wigner shape with Blatt-Weisskopf form factors in the meson and intermediate resonance vertices bwform , and angular dependence taken into account kopp .
We use an unbinned maximum likelihood fit which maximizes the function
| (6) |
where the index runs over all events. The last term is used to constrain the signal fraction to be the value within its error obtained from the fit. The first term contains the likelihood function
| (7) |
where
| (8) |
and
| (9) |
are the normalization factors, and and are efficiency and background functions. The fit parameters are , and .
We determine the efficiency using the same signal MC sample described before. The efficiency function is parameterized by a cubic polynomial in (, ) multiplied by threshold factors , where
| (10) |
, or is the maximum value of or in this decay, and are the fit parameters. The threshold factors are used to account for tracking inefficiency at the Dalitz-plot corners, where one of three particles might be produced with very low momentum and escape detection.
Figure 2 shows that the background is significant. To construct a model of the background shape , we select events from the sideband region ( MeV and MeV/). There are 12324 events, about 3.5 times the amount of background we estimate in the signal region, which is dominated by random combinations of unrelated tracks. Although the background includes and mesons combined with random tracks, these events will not interfere with each other. Thus the shape is parameterized by a two-dimensional quadratic polynomial with terms representing non-coherent contributions from and meson decays, multiplied by the threshold factors.
We consider fifteen intermediate states, , , , , , , , , , , , , , and , as well as a nonresonant (NR) contribution. The parameters of the established resonances are taken from Ref. pdg , except for the which is taken from Ref. f0 and the taken from Ref. a0 . A complex pole function is used to model the with pole position at GeV2 kappa . The nonresonant contribution is modeled as a uniform distribution over the allowed phase space. For the -wave states in the decays, we also consider the LASS amplitude as described in Ref. LASS ; BABARLASS , instead of a coherent sum of the states , and the nonresonant term.
This study is sensitive only to relative phases and magnitudes. The mode is assigned to have zero phase and unit magnitude. We choose the same phase conventions for the intermediate resonances as E687 e687 used.
We begin to fit the data by considering only the three components , , and and obtain a result consistent with E687. To present a relative goodness-of-fit estimator, we divide the Dalitz-plot region into bins with dimensions 0.05 (GeV/ 0.05 (GeV/ and calculate as
| (11) |
where () is the observed (expected) number of events in the th bin pdg . We find for d.o.f. in the “three resonances” fit, where 721 is the number of valid bins inside the kinematically allowed region.
Our twenty times larger statistics than E687 require a better model. We determine which additional resonances to include by the following procedure: starting from the three resonances and adding new resonances one at a time, we choose the best additional one at each iteration, stopping when no additional resonances have fit fractions (FF) more than from zero. The fit fraction is defined as
| (12) |

The results of our fits are presented in Table 1. We find that three fits (denoted as A-C) describe the data with similar quality. The only difference among them is in description of the -wave contribution, which is represented by the and NR in fit A, by and in fit B, and by the LASS amplitude in fit C. Figure 3 shows the Dalitz plot for the candidates and three projections of the data with the result of fit B superimposed.
We generate seven sets of GEANT-based signal MC samples with the model from fit A. Each set contains about the same size as in the data. We find that the fits can recover the input magnitudes and phases within their errors.
Fit B gives the best agreement with the data; thus we choose it to search for -violation (). The resonances in () decays are allowed to have different magnitudes, (), and phases, (), in the decay amplitude (). We perform a simultaneous fit to and samples. In the fit, the signal term in Eq. (7) is replaced by
| (13) |
for the sample and by
| (14) |
for the sample, where are efficiency functions obtained from the signal MC separately. We cannot determine the relative magnitude and phase between and directly, and assume and for the resonance. The free parameters in the fit are , , , and .
Following Ref. ks2p , we also compute the -conserving fit fraction as
| (15) |
the fit fraction as
| (16) |
and the interference fraction (IF) as
| (17) |
The -conserving fit fraction is the same for the and by construction. The fit fraction defined by Eq. (16) is sensitive to violation in the resonant decay. The interference fractions of Eq. (17) sum over the contribution proportional to so they are sensitive to violation in interference between resonances. The phases are important and allow the possibility of cancelation in this sum.
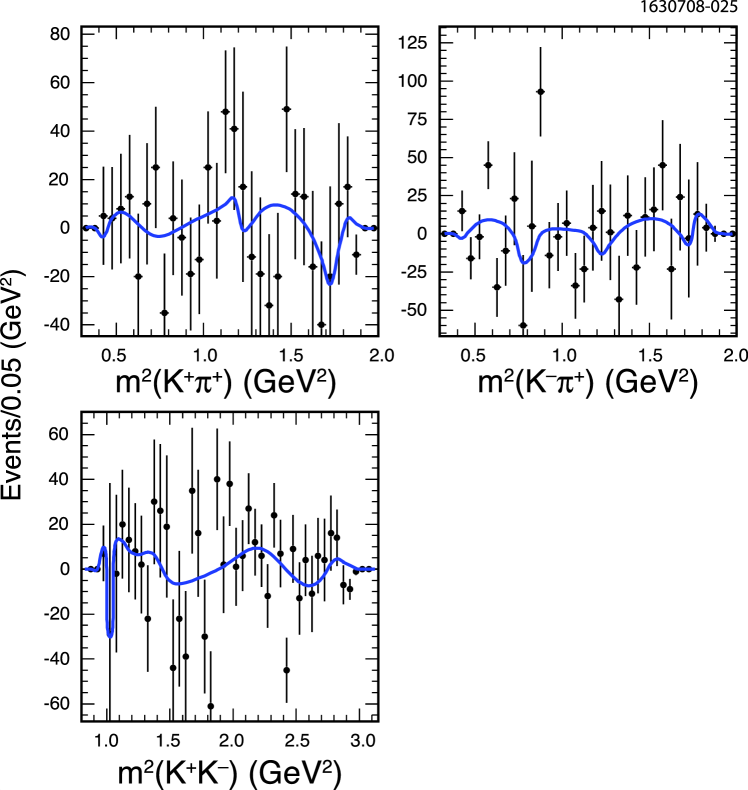
In Table 2, we report the magnitude asymmetries , phase differences and fit fraction asymmetries. The fit fraction asymmetry is computed as the difference between the and fit fractions divided by the sum. The largest fit fraction asymmetry, for the , is 1.7, and occurs because the fit fraction for the is small. The -conserving fit fractions and the 95% confidence level (C.L.) upper limits for fit fraction, interference fraction, and the ratio of interference to -conserving fit fraction are given in Table 3. We notice that the -conserving fit fractions are consistent with those of fit B in Table 1. Figure 4 shows the difference of the Dalitz-plot projections of data and fit between and decays.
| (%) | (∘) | FF asymmetry(%) | |
|---|---|---|---|
| 0(fixed) | 0(fixed) | ||
| FF() | IF | Ratio | ||
|---|---|---|---|---|
| () | () | (%) | ||
| Component | FF()(%) | (95% C.L. upper limits) | ||
| 0(fixed) | 0(fixed) | 0(fixed) | ||
We calculate an integrated asymmetry across the Dalitz plot, defined as
| (18) |
We obtain , where the errors are statistical, experimental systematic, and decay-model systematic, respectively.
Using the same counting technique as in Ref. babar , we examine asymmetries () in the and regions by requiring the and invariant mass to be within and MeV/ of the nominal and masses pdg . We find ()% and ()% for the and region, respectively.
Systematic uncertainties from experimental sources and from the decay model are considered separately. Our general procedure is to change some aspect of our fit and interpret the change in the values of the magnitudes, phases, fit fractions, , , and fit fraction asymmetries as an estimation of the systematic uncertainty.
Contributions to the experimental systematic uncertainties arise from our model of the background, the efficiency and the event selection. Our nominal fit fixes the coefficients of the background determined from a sideband region. To estimate the systematic uncertainty on this background shape, a fit is done with the coefficients allowed to float and constrained by the covariance matrix obtained from the background fit. Similarly, to estimate the systematic uncertainty on the efficiency parameters, we perform a fit with the coefficients of efficiency allowed to float constrained by their covariance matrix. To estimate the systematic uncertainty on MC simulation for the particle identification, a fit is done with new efficiency parameters obtained from the weighted MC sample by the efficiency ratios of data to MC depending on each particle’s momentum. To estimate the event selection uncertainty, we change the and selection criteria in the analysis. These variations to the standard fit are the largest contribution to our experimental systematic errors. In the asymmetry search, we take the background fractions and shapes to be the same for the and samples. To estimate the uncertainty on the supposition, we perform a fit with the background determined separately.
The systematic error due to our choice of decay model is evaluated as follows. We change the standard values of the radial parameter in the Blatt-Weisskopf form factors bwform for the intermediate resonance decay vertex (1.5 GeV-1) and the vertex (5 GeV both to 1 GeV-1. Fits with constant width in the Breit-Wigner functions are considered. To compute the uncertainty arising from our choice of resonances included in the fit, we compare the result of our standard fit to a series of fits where each of the resonances, , , , , , , and , is included one at a time. These variations to the standard fit result in the largest contribution to systematic errors associated with our decay model. The masses and widths of the intermediate resonances are allowed to vary within their known uncertainties pdg . For fit C, we vary the parameters in the LASS amplitude within their uncertainties.
We take the maximum variation of the magnitudes, phases, and fit fractions, , , and fit fraction asymmetries from the nominal fit compared to the results in this series of fits as a measure of the experimental systematic and decay-model systematic uncertainty. Table 4 shows the systematic checks on the integrated asymmetry defined in Eq. (18). Apart from the sources discussed above, we also consider different models from fit A or C; the variations are small.
| Source | Variation (%) |
|---|---|
| Background shape | |
| Efficiency parameters | |
| Particle identification | |
| Event selection criteria | |
| Background (in)dependent fit | |
| Form factors | |
| Width parameterization | |
| Choice of resonances | |
| Resonant masses and widths | |
| Fit A | |
| Fit C |
We estimate the systematic uncertainty on the asymmetry defined in Eq. (4). The contributions from various identified sources are listed in Table 5. The uncertainty due to selection criteria is estimated by doubling the signal window. We evaluate an uncertainty for the background shape by floating its parameters in the fit instead of fixing them from the values obtained form the sideband. We use the -conserved channels and as control modes to assign the systematic uncertainty on MC simulation due to possible efficiency difference on positive and negative charged kaons and pions.
| Source | Variation (%) |
|---|---|
| Selection criteria | |
| Background shape | |
| MC simulation | |
| Total |
In conclusion, we have analyzed the resonant substructure in decay and searched for violation in the decay and its intermediate resonances. We measure the overall asymmetry in decays to be . The limit is more restrictive than the one found previously by BABAR babar . We use five resonances and -wave states to model the Dalitz plot with results shown in Table 1. The -wave can be equally well described by a coherent sum of and nonresonant amplitude or and , or the LASS amplitude. Choosing the second model we measure the asymmetries for all submodes, shown in Table 2 and 3. The measured asymmetries are consistent with the absence of violation. We find defined in Eq. (18) to be . The is sensitive to an asymmetry in shape between the and samples, but does not depend on their yields.
We gratefully acknowledge the effort of the CESR staff in providing us with excellent luminosity and running conditions. D. Cronin-Hennessy and A. Ryd thank the A.P. Sloan Foundation. This work was supported by the National Science Foundation, the U.S. Department of Energy, the Natural Sciences and Engineering Research Council of Canada, and the U.K. Science and Technology Facilities Council.
References
- (1) F. Buccella, M. Lusignoli, G. Mangano, G. Miele, A. Pugliese, and P. Santorelli, Phys. Lett. B 302, 319 (1993); F. Buccella, M. Lusignoli, G. Miele, A. Pugliese, and P. Santorelli, Phys. Rev. D 51, 3478 (1995); M. Golden and B. Grinstein, Phys. Lett. B 222, 501 (1989).
- (2) S. Bianco, F. L. Fabbri, D. Benson, and I. Bigi, Riv. Nuovo Cimento 26N7, 1 (2003).
- (3) Y. Grossman, A. L. Kagan, Y. Nir, Phys. Rev. D 75, 036008 (2007).
- (4) P. L. Frabetti et al. (E687 Collaboration), Phys. Lett. B 351, 591 (1995).
- (5) J. M. Link et al. (FOCUS Collaboration), Phys. Lett. B 648, 156 (2007).
- (6) B. Aubert et al. (BABAR Collaboration), Phys. Rev. D 71, 091101(R) (2005).
- (7) S. Dobbs et al. (CLEO Collaboration), Phys. Rev. D 76, 112001 (2007).
- (8) Y. Kubota et al., Nucl. Instrum. Methods Phys. Res., Sect. A 320, 66 (1992).
- (9) D. Peterson et al., Nucl. Instrum. Methods Phys. Res., Sect. A 478, 142 (2002).
- (10) M. Artuso et al., Nucl. Instrum. Methods Phys. Res., Sect. A 554, 147 (2005).
- (11) T. Skwarnicki, Ph.D thesis, Institute for Nuclear Physics, Krakow, Poland (1986).
- (12) H. Albrecht et al. (ARGUS Collaboration), Phys. Lett. B 229, 304 (1989).
- (13) S. Kopp et al. (CLEO Collaboration), Phys. Rev. D 63, 092001 (2001).
- (14) J. Blatt and V. Weisskopf, Theoretical Nuclear Physics (Wiley, New York, 1952).
- (15) W.-M. Yao et al. (Particle Data Group), Journal of Physics G 33, 1 (2006).
- (16) M. Ablikim et al. (BES Collaboration), Phys. Lett. B 607, 243 (2005).
- (17) A. Abele et al. (Crystal Barrel Collaboration), Phys. Rev. D 57, 3860 (1998).
- (18) J. A. Oller, Phys. Rev. D 71, 054030 (2005).
- (19) D. Aston et al. (LASS Collaboration), Nucl. Phys. B 296, 493 (1988).
- (20) B. Aubert et al. (BABAR Collaboration), Phys. Rev. D 76, 011102(R) (2007).
- (21) D. M. Asner et al. (CLEO Collaboration), Phys. Rev. D 70, 091101(R) (2004).