Thermal fluctuations in moderately damped Josephson junctions: Multiple escape and retrapping, switching- and return-current distributions and hysteresis
Abstract
A crossover at a temperature in the temperature dependence of the width of the distribution of switching currents of moderately damped Josephson junctions has been reported in a number of recent publications, with positive and characteristics associated with underdamped behaviour for lower temperatures , and negative and characteristics resembling overdamped behaviour for higher temperatures . We have investigated in detail the behaviour of Josephson junctions around the temperature by using Monte Carlo simulations including retrapping from the running state into the supercurrent state as given by the model of Ben-Jacob et al. We develop discussion of the important role of multiple escape and retrapping events in the moderate-damping regime, in particular considering the behaviour in the region close to . We show that the behaviour is more fully understood by considering two crossover temperatures, and that the shape of the distribution and around , as well as at lower , are largely determined by the shape of the conventional thermally activated switching distribution. We show that the characteristic temperatures are not unique for a particular Josephson junction, but have some dependence on the ramp rate of the applied bias current. We also consider hysteresis in moderately damped Josephson junctions and discuss the less commonly measured distribution of return currents for a decreasing current ramp. We find that some hysteresis should be expected to persist above and we highlight the importance, even well below , of accounting properly for thermal fluctuations when determining the damping parameter .
[Accepted for publication in PRB; ©American Physical Society 2008]
pacs:
74.40.+k, 74.50.+rI Introduction
The Josephson junction system has been extensively studied both theoretically and experimentally. Theoretically it has been considered a model system for studying escape from a metastable potential well. Experimentally, Josephson junctions have found numerous applications and are presently being used in several quantum bit implementations. In such experiments, an understanding of the influence of thermal fluctuations is crucial in developing applications. Josephson junctions can be characterised by a damping parameter . The majority of the large body of previous work in the literature has concentrated on junctions in either the underdamped () or overdamped ( limits. In this paper, we focus on the intermediate “moderately damped” () limit, where thermal fluctuations lead to interesting physical effects.
For strongly underdamped Josephson junctions under the influence of thermal fluctuations, the characteristics are hysteretic and the dynamics of switching from the zero-voltage supercurrent state to the finite-voltage resistive phase-slip state are well described by the analysis of Fulton and DunklebergerFulton and Dunkleberger (1974), with a distribution in switching currents as a result of thermal fluctuations. In contrast, overdamped junctions show non-hysteretic behaviour, with a finite voltage on the supercurrent branch of the characteristic, associated with thermally activated phase diffusion, and thermal fluctuations leading to very much smaller variations in the switching behaviour. Phase diffusion in junctions with hysteretic characteristics has been discussed by Kautz and MartinisKautz and Martinis (1990) and is associated with frequency-dependent damping, such that junctions are underdamped at low frequencies, but in the overdamped limit at high frequency.
The temperature dependence of the switching current and the width of its distribution are experimental parameters of much recent interest. Experimental evidence of a crossover in the temperature dependence of the switching current was reported first by Franz et al.Franz et al. (2004) in experiments on small “intrinsic” Josephson junctions (IJJs). They obtained curves characteristic of underdamped junctions below a crossover temperature and curves characteristic of overdamping above that temperature. More recent experimental papers have reported a crossover in the temperature dependence of the width of the switching currentKivioja et al. (2005); Männik et al. (2005); Krasnov et al. (2005) at a temperature , with positive d below and negative d above . This was associated with a regime of moderate damping. The negative d region was associated with retrapping of the phase following escape. The low-temperature behaviour fits the expectations for underdamped junctions, and the high-temperature behaviour resembles previous observations for overdamped junctions with phase diffusion. One might simply explain the crossover from underdamped to overdamped behaviour by a temperature-dependent damping and this was indeed the suggestion of Franz et al. However, it was demonstrated by Krasnov et al.Krasnov et al. (2005) that such a crossover should also be expected even for temperature-independent if the junctions are in the moderately damped regime (). Krasnov et al. derived an approximate quantitative formula with , implying that is a measure of the damping.
Several theoretical treatments of the retrapping process have been presentedBen-Jacob et al. (1982); Chen et al. (1988); Cristiano and Silvestrini (1986) and the analysis of retrapping was conducted in various ways in the experimental reports of a crossover in . In the analysis of Ref. Kivioja et al., 2005, retrapping was assumed to be determined purely by energetic considerations: retrapping is certain to occur where it is energetically expected, below a current , where is the (fluctuation-free) critical current of the Josephson junction. For there is an energy cost to retrapping — in Ref. Kivioja et al., 2005, retrapping was neglected for . Krasnov et al.Krasnov et al. (2005) treated retrapping above as a thermally activated process, with an energy barrier , using the model of Ben-Jacob et al.Ben-Jacob et al. (1982) M\a”annik et al.Männik et al. (2005) used Monte Carlo simulations with an RCSJ model including frequency-dependent damping to determine the probability of thermally induced retrapping following escape.
In this article, in order to conduct a semi-analytic analysis of the multiple escape and retrapping processes, we have adopted the model of Ben-Jacob et al. We also include the effects of frequency-dependent damping (see Section IV.1). We develop discussion of the important role of multiple escape and retrapping events in the moderate-damping regime and present results of Monte Carlo simulations showing the variation with experimental parameters of the mean and width of the switching-current distribution.Fenton et al. (2008) We consider the crossover between the lower-temperature conventional underdamped regime and the higher-temperature overdamped regime. Although previous studies have considered a single crossover temperature, we show that, in detail, the change occurs in two stages, with a lower-temperature transition from underdamped behaviour to behaviour in the crossover regime, and a higher temperature transition from the crossover regime to the higher-temperature overdamped regime. We demonstrate a significant change in the shape of the switching current distribution around the crossover and study this quantitatively through the skewness parameter.
The process of return from the resistive state in a hysteretic junction is a much less well-studied phenomenon than that of escape. Here we also consider the process of return from the resistive state to the supercurrent state as the current is ramped down, and the resulting variation in hysteresis around . We compare our findings with previous reports in the literature.
In our Monte Carlo simulations, for a current , the probability in a short time interval of a transition between the metastable and running states is given by for escape from the metastable state (with given below by Eqn. 2) or for retrapping from the running state (with given below by Eqn. 3). A bias current is ramped up (or down) at a constant rate in order to generate distributions of switching (or return) currents for junctions with a number of different parameters. We neglect the temperature dependence of the critical current and in order to emphasize effects due to thermal fluctuations in the junctions. As a bias current is ramped up, a switch is counted when the junction spends more than half the time in the running state over some time period .111This period would be set by the details of an experiment — see Section IV.1. Throughout this article, we use the term “escape” to describe any (possibly short-lived) escape from the instantaneous zero-voltage state, and reserve the term “switch” to describe an experimentally measured switch to the running state. Similarly, when describing the behaviour as an applied current is ramped down from the critical current, we reserve the term “retrapping” to describe a (possibly short-lived) change from the voltage state to the zero-voltage state, and use the term “return” to describe an experimentally measured change from the voltage state to the zero-voltage state.
I.1 The RCSJ model - the underdamped regime
For a resistively shunted Josephson junction in the absence of fluctuations, escape from the supercurrent state to a state of finite voltage characterized by the junction resistance occurs when the current bias applied to the junction reaches the junction critical current . At finite temperatures, thermal fluctuations lead to switching at currents below , and there arises experimentally a distribution in possible values of the switching current. A common experimental configuration is to ramp the current up from zero at a constant rate . In that case, the probability of a switch in the current range to is , withFulton and Dunkleberger (1974)
| (1) |
where is the rate, at current , of escape from the supercurrent state.
A mechanical analog for the resistively and capacitively shunted Josephson junction (RCSJ) is that of a particle in a washboard potential; it is often used in discussing the dynamics of such junctions. Tinkham The height of the corrugations in the untilted washboard is set by the Josephson energy. The current bias corresponds to a tilt of the washboard, and position of the particle along the washboard corresponds to the phase difference across the junction, so that the speed of the particle as it moves in the washboard potential corresponds to the voltage across the junction. As it moves along the washboard, the particle is subject to a viscous damping force which is inversely proportional to the resistance shunting the junction. The strength of the damping can be characterized by a quality factor parameter222The McCumber parameter is also sometimes used to characterize the damping. , where and are the resistance and capacitance shunting the junction and is the angular frequency of small oscillations at the bottom of the potential well at zero bias. Hysteretic characteristics are obtained for and phase diffusion obtained for .
I.2 Characteristic rates
The rate of thermally activated escape from a minimum in the washboard potential is given by Kramers (1940)
| (2) |
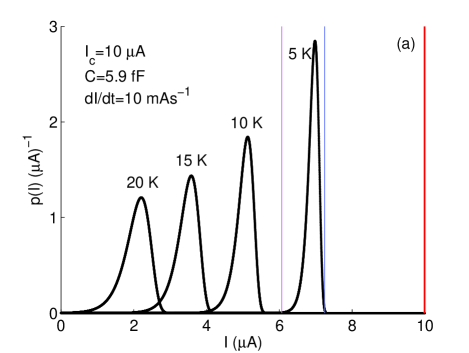
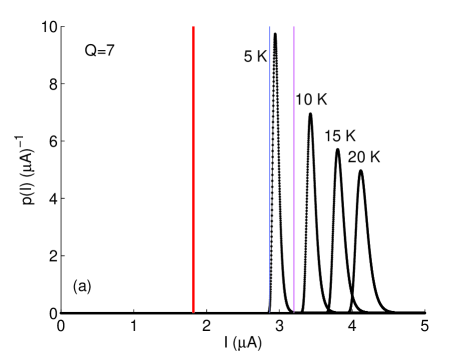
where is the height of the energy barrier from a washboard potential minimum to the adjacent maximum, is a damping-dependent pre-factor and the quantities and are all current dependent, with and, close to , where the Josephson energy . Combining Eqns. 1 and 2 gives a characteristic asymmetric distribution of switching currents for such junctions, as shown in Fig. 1a.
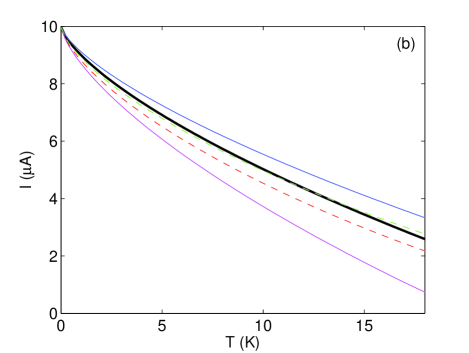
In the underdamped regime, the mean switching current decreases as the temperature increases (Fig. 1b) because larger thermal fluctuations enable escape from the washboard minimum at a lower current. The width of the switching current distribution may be shown to depend on temperature as .
Thermal fluctuations can also cause retrapping of a particle which has escaped from a potential well. Ben-Jacob et al. Ben-Jacob et al. (1982) obtained an analytic formula for the rate of this retrapping in the limit . The retrapping rate is strongly dependent on the damping through , and is given by
| (3) |
where . Rewriting this in the form defines an energy barrier for retrapping.Krasnov et al. (2005) Eqn. 3 has been applied in the literatureKrasnov et al. (2005) in the regime of moderate damping , and we consider here in further detail application of the model in that regime.
It is instructive to define a normalised current-ramp rate . Eqn. 1 can then be rewritten
| (4) |
For small currents, , so is small. As the current is increased towards the current , at which , the first quotient in Eqn. 4 increases and therefore, as the current increases further, the numerator of the second quotient333Note that the numerator is the total probability of there having been no switch as the current ramps from 0 to , so that the quotient represents the average probability per unit current of there having been no switch. begins to reduce from 1 to zero. The maximum in therefore occurs for . The dashed lines in Fig. 1b show the currents at which and . The exact ratio at the maximum in is temperature dependent: at 5 K, the peak in the switching current lies at a higher current than the current at which , whereas at 15 K, the peak in the switching current lies at a lower current than the current at which .
II The multiple switch-retrapping regime
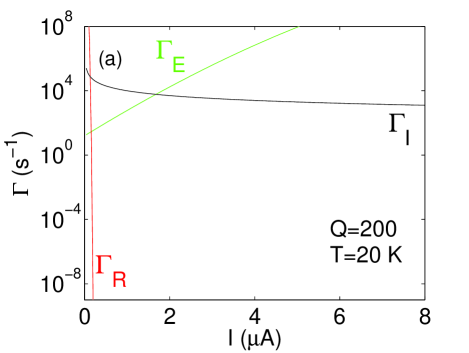
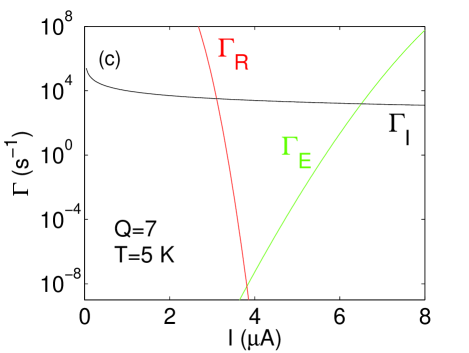
As the current is increased from zero, the three characteristic rates , and vary. Fig. 2a shows the variation of these three rates when , i.e., for an underdamped junction. At very low currents, the retrapping rate is much larger than and . Also, since , no escape events occur. When the current is increased to around , an escape event becomes likely, but for the retrapping rate is very much smaller than the escape rate. Therefore retrapping is negligible in the case illustrated in Fig. 2a. As we will see, an important current is the current at which . In Fig. 2a, A and .
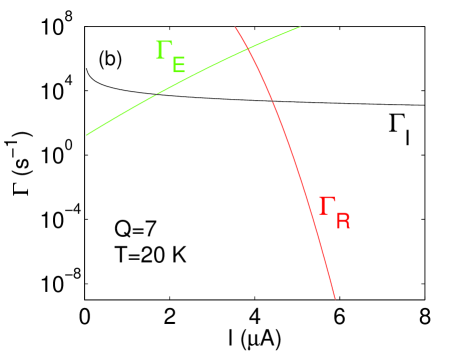
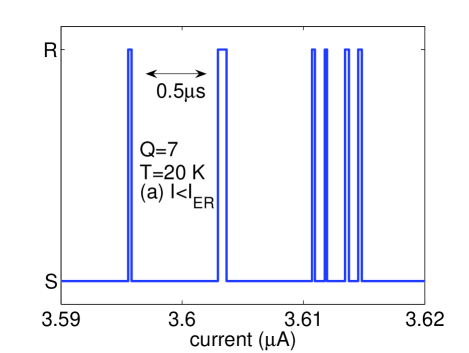
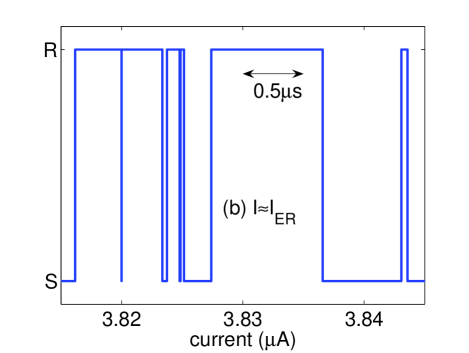
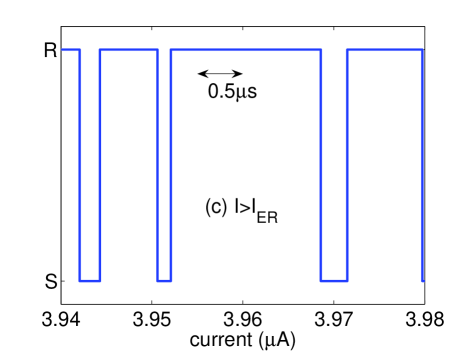
Fig. 2b shows the variation of the three characteristic rates for a more heavily damped junction. The escape rate is only weakly dependent on through the pre-factor (Eqn. 2). The retrapping rate is exponentially dependent on (Eqn. 3); it is much larger in Fig. 2b than in Fig. 2a and . For currents , the retrapping rate is now much larger than . Escape events occur for , but retrapping occurs shortly afterwards; the particle moves down the washboard in fits and starts and the time-averaged voltage across the junction is non-zero — this state can be called a region of phase diffusion.444See also the discussion in Section III. As the current increases, the escape and retrapping rates become more and more similar, so there is a gradual increase in the time-averaged voltage. Fig. 3 shows, for the same values of and as Fig. 2b, a simulation of jumps between the supercurrent (zero voltage) and running (resistive) states at three currents close to . In Fig. 3a, and the junction spends most of the time in the zero-voltage state. At (Fig. 3b), escape events and retrapping events are expected in similar proportion and the junction spends a similar amount of time in the zero-voltage and escaped states. The time-averaged voltage across the junction becomes a significant fraction of the fully switched voltage, so an experiment is likely to measure a switch event. As the current is increased further above , any retrap event will be followed quickly by an escape event, so the junction spends almost all its time in the running state, as Fig. 3c shows.
For the junction parameters corresponding to Fig. 2b, the junction switches around , so the switching current is greater than the switching current in the underdamped case. In other words, counter-intuitively, thermal fluctuations suppress the switching current less in the multiple switching-retrapping regime than in the conventional underdamped thermally-activated switching regime.555The counter-intuitive nature of the accompanying decrease in the width with increasing temperature has previously been highlighted by Krasnov et al. in Refs. Krasnov et al., 2005 and Krasnov et al., 2007.
III Temperature dependence, the crossover regime and
Figs. 2b and c show the variation in the characteristic rates for two different temperatures with . At the lower temperature, 5 K, (Fig. 2c) so, for , the retrapping rate is smaller than the escape rate. Therefore, retrapping after escape does not occur, and the conventional underdamped thermal activation behaviour is obtained. Conversely, at a higher temperature, 20 K, (Fig. 2b), , and so there are multiple escape and retrapping events, as described earlier. Note that is approximately unchanged as temperature varies at constant . This is expected by inspection of Eqns. 2 and 3. Ignoring corrections of logarithmic order, determines , where and are both independent of temperature and hence is independent of temperature too.
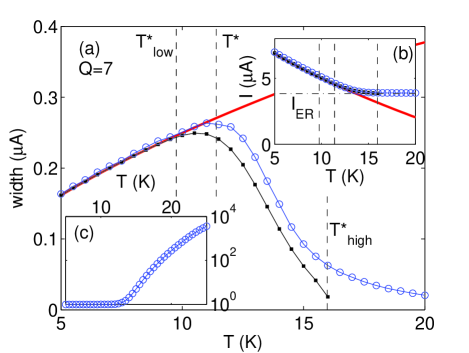
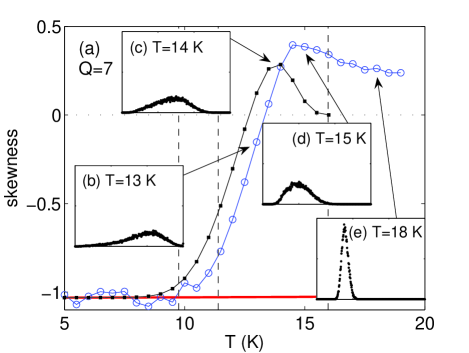
The results of simulations of these dynamics over a broader range of temperatures are shown in Fig. 4. In Fig. 4a, the width of the distribution follows the conventional underdamped thermal behaviour () at lower temperatures, passes through a maximum and then falls at higher temperatures, matching experimental observations. In the previous experimental reports,Kivioja et al. (2005); Männik et al. (2005); Krasnov et al. (2005) a characteristic temperature was defined as the temperature at which the maximum in occurs. At low temperatures, a single escape event results in a switch being counted (Fig. 4c) and the mean of the distribution follows the conventional underdamped thermal behaviour (Fig. 4b). At around , the mean switching current flattens out and reaches an approximately constant value well above . For higher temperatures a significant number ( above 25 K) of escape events occurs before a switch is counted. The shape of the switching distribution also changes as the temperature is increased. Fig. 5b–e shows that the shape departs from that shown in Fig. 1. The skewness (the ratio of the third moment about the mean to the standard deviation) gives a simple one-parameter description of the shape of the distribution; a symmetrical distribution has zero skewness. The skewness of the underdamped thermal distribution is around over the range of temperature shown in Fig. 4. Fig. 5a shows the variation of the skewness of the simulated distribution around . The skewness of the distribution begins to depart from its thermal value somewhat below , becoming progressively less negatively skewed and then positively skewed, passing through a maximum and then beginning to level out at around the same temperature as the width begins to level out and as the mean switching current levels off.
From these simulations, we identify three different regimes of behaviour. At low temperatures, conventional thermal underdamped behaviour is observed. At some higher temperature below , the skewness of the distribution, and in detail also the width and the mean, depart from the underdamped thermal values. Above this temperature, the skewness and width vary rapidly. At a higher temperature, there is a crossover to a different regime in which the mean switching current is approximately constant and the skewness and width are slowly decreasing as the temperature is increased. To describe this behaviour, we label the two boundaries between these three regimes and , where .
To arrive at a quantitative definition for , we note that retrapping only has a significant effect on the dynamics when there are escapes at currents . Therefore, for parameters where there are no escapes for , the switching distribution does not depart from the conventional underdamped thermal distribution; we define quantitatively as the temperature at which coincides with the bottom of the conventional thermally activated underdamped switching distribution (see also the lower line (pink online) in Fig. 1), where we define the bottom and top of the distribution by and , where , with . Fig. 6a shows a simulated switching-current distribution at and a comparison of , and as a function of current.
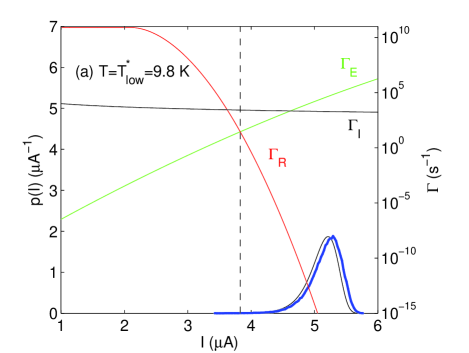
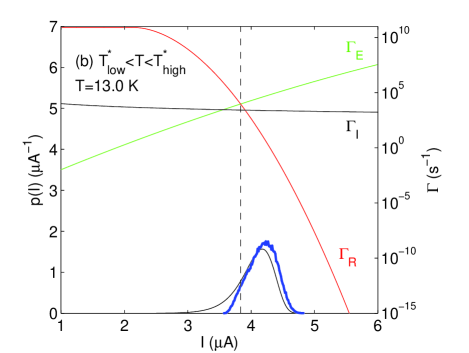
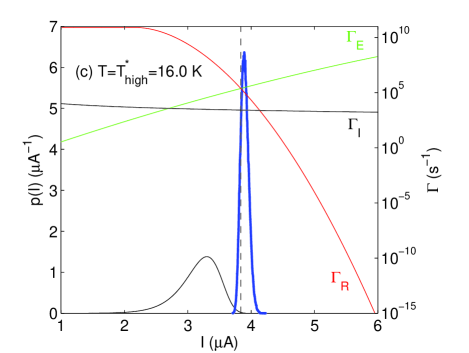
As the temperature increases, the current decreases. For temperatures , escape events occur for and are followed by retrapping events; they do not result in the count of a switch. Fig. 6b shows, for a temperature , a comparison of the characteristic rates and also shows that the simulated switching distribution begins to depart from the conventional underdamped thermally activated switching distribution.
For , escape events leading to switching only occur at currents . When a part of the underdamped thermal distribution lies at , one might naïvely expect that the width, mean and shape of the switching distribution would be approximately the same as the width, mean and shape of the part of the underdamped thermal distribution lying at . The mean, width and skewness of the part of the underdamped thermal distribution lying above (“the truncated distribution”) are shown in Fig. 4 and Fig. 5. The mean in the simulations closely matches the mean of the truncated underdamped thermal distribution, and the temperature dependence of the width and the skewness in the simulations also follow the respective variations in the width of the truncated distribution, up to temperatures approaching the temperature at which coincides with the top of the conventional thermally activated underdamped switching distribution (see also the upper line (blue online) in Fig. 1). We define this latter temperature as (see Fig. 6c). The shape of the part of the underdamped thermal distribution with largely determines the shape of the switching distribution for ,i.e., the conventional thermal behaviour is only followed below , but the variations in the mean and width of the distributions remain analytically determinable for temperatures up to .
The departure of from the conventional thermal activated behaviour above and the approach to an asymptotic value is in agreement with experimental results reported by Franz et al., in which a plateau in is observed above a crossover temperature, followed by a fall at higher temperatures. In one sample, however, they observe an increase in above the crossover temperature. These observations may be explained by considering temperature variation in and . The Ambegaokar–Baratoff relationAmbegaokar and Baratoff (1963) suggests a significant decrease in for . A reduction in as increases would lead to a fall in the switching current, whereas a decrease in could lead to an increase in the switching current. One might expect a reduction in at higher temperatures as quasiparticle conductivity increases. This change will be sample dependent; for a typical IJJ sample, the resistance may fall by a third from low temperature to . However, if the shunt resistance is dominated by the environmental impedance, is expected to be approximately -independent.
Since, as the temperature increases above , the simulated distribution becomes progressively less negatively skewed and becomes positively skewed around , the temperature variation of the skewness provides a straightforward experimental way to determine and . As far as we are aware, no systematic experiments investigating variations in the shape of the switching distribution around have yet been reported.
For , the behaviour is not associated with the underdamped thermal distribution; we will not discuss this behaviour in detail. Fig. 4b shows that, for , the mean switching current approaches . Since is a function of and , determination of from the switching current at provides an additional experimental probe for the determination of and , and a consistency check for derivation of from either or from a ratio of the switching and return currents. In addition, the expectation that the mean of the switching distribution at temperatures above does not vary with temperature for constant means that this measurement might be used as an experimental probe for whether is varying with temperature. We return later to discuss how the presence of frequency-dependent damping affects this plateau.
For , the behaviour shows some similarities to the extensively studied phenomenon of phase diffusion, but also some differences. The time-averaged voltage across the junction is finite below the switching current, as expected for conventional phase diffusion. However, for , the time-averaged voltage across the junction is identically zero with a high probability. 666Note that, even above , zero voltage is expected for and so the low-bias phase-diffusion voltage remains zero. This behaviour contrasts with a phase-diffusion regime considered by Ivanchenko and Zil’bermanIvanchenko and Zil’berman (1969) and others in which a finite phase-diffusion resistance persists even at currents . For , the time-averaged junction voltage is finite, but this phase-diffusion regime also differs physically from that analysed by Ivanchenko and Zil’bermanIvanchenko and Zil’berman (1969). Ivanchenko and Zil’berman considered that each escape would lead to a phase shift of only , whereas in our model the phase shifts are of order — Kautz and Martinis previously showed that the presence of multiple- phase shift–escape events has an appreciable effect on the phase-diffusion voltage.Kautz and Martinis (1990) This is associated with the time needed after the energy barrier is exceeded for the instantaneous voltage to increase from zero to its steady value. In previous experiments on moderately damped junctions, Krasnov et al.Krasnov et al. (2005) did not observe any phase-diffusion voltage above until well above . This appears to conflict with our understanding from our analysis. However, the explanation might simply be that the phase-diffusion voltage was too small to be measurable.
III.1 Ramp-rate dependence
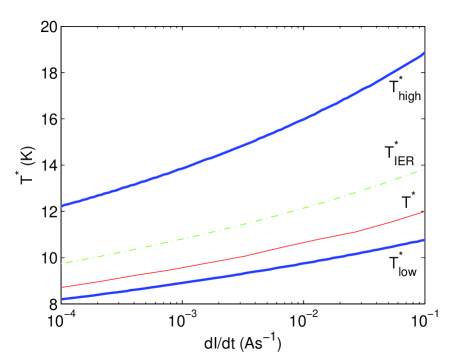
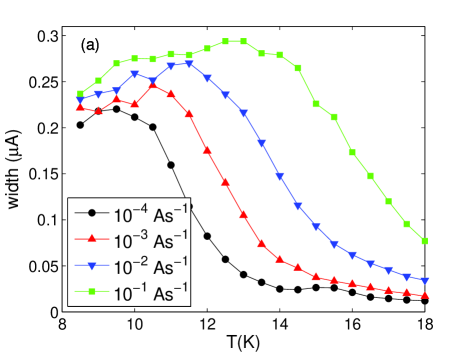
Since the crossover temperatures are dependent on the shape of the thermal distribution, and the shape of the thermal distribution is dependent on the current-ramp rate, the crossover temperatures are also dependent on the current-ramp rate. Figure 7 shows the variation with current-ramp rate of calculated values of and and the temperature at which the maximum in the width occurs. All these values were determined from the truncated thermal distribution. Also shown is , the temperature at which , in this analysis the most natural definition for a single crossover temperature. For a ramp rate As-1, we find K and K, whereas for a ramp rate As-1, we find K and K. Thus, as the simulations reported in Fig. 8 show, varying the ramp-rate can have a significant effect on ; this dependence was not recognised in previous reports of the crossover. Fig. 8a shows simulations of the variation in the width of the switching distribution with temperature for a number of current-ramp rates. In the range shown, for As-1 the temperature is above , whereas for As-1 the temperature ranges from below to above . This difference between the two ramp rates leads to a marked difference in the temperature variation of the width.
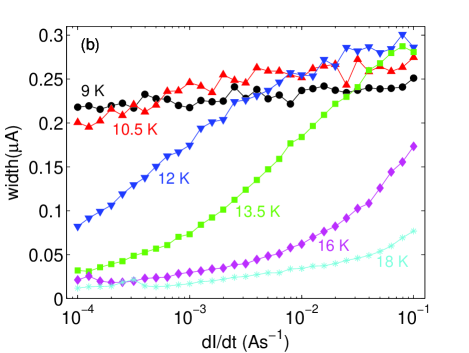
Experimentally, probably the most straightforward measurement to make to investigate these effects would be to keep fixed and vary . Fig. 8b shows a simulation of this procedure — there may be a marked difference in the variation of the width with ramp rate depending on the temperature of the measurement. For K, the temperature is at or below for the whole range of ramp rates, whereas for K, the temperature is at or above for the whole range of ramp rates. For intermediate temperatures, increasing the ramp rate from As-1 to As-1 moves the values so that the temperature is close to at the lowest ramp rate and close to at the highest ramp rate. This ramp-rate dependence of the width could be used to determine . As the ramp-rate is varied at a constant temperature, remains fixed, but varies and so the width of the distribution varies, particularly when becomes close to the experimental temperature. This allows to be determined, at each experimental temperature, by fitting to simulations.
IV The return current , hysteresis and frequency-dependent damping

In previous publicationsKrasnov et al. (2005); Franz et al. (2004) it was noted that, although the temperature at which the hysteresis in the characteristic disappeared was around , there was some difference between the two values. Motivated by this discrepancy, we consider here in more detail the variation of hysteresis around .
In the RCSJ model in the absence of fluctuations, as an applied current is ramped down from towards zero, return from the quasiparticle branch occurs at a current for .Zappe (1973) Thermal fluctuations lead to retrapping when , at currents . As Fig. 9 shows, there is some distribution in the value at which return occurs, and the mean and peak of the distribution lie below the current at which . The width of the return distribution may be shown to vary with as .777Additionally, in a theoretical article, Chen et al.Chen et al. (1988) showed that, close to the fluctuation-free return current, the voltage departs from , but we neglect that dependence here. Experimentally, measurements of return distributions are more likely than switching-distribution measurements to be affected by heating and this complicates analysis of the temperature dependence. To our knowledge, the only report in the literature of an experiment in which the distribution of return currents was measured has been given by Castellano et al.Castellano et al. (1999)
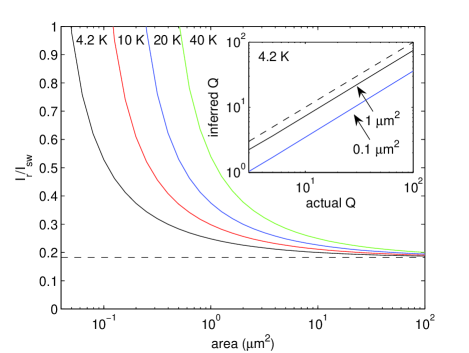
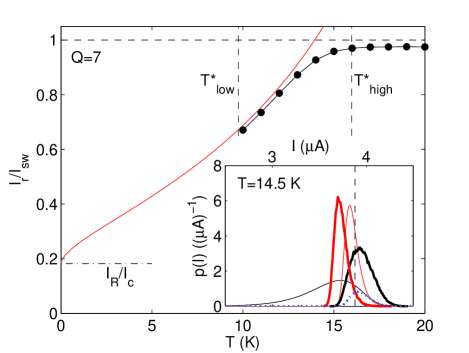
A measure of the hysteresis of the junction is given by and, experimentallyKrasnov et al. (2005), is sometimes used to infer through the approximation . However, for moderately damped Josephson junctions, the ratio is often sufficiently small that thermal fluctuations cause significant departures of from and from . Fig. 10 shows the variation of with area at selected temperatures, assuming junctions remain in the underdamped regime. The junction parameters chosen might be appropriate for intrinsic Josephson junctions. For large-area junctions, . For junctions with area m2, is significantly larger than and so in this case identifying with to infer will give a significant underestimate of . The inset in Fig. 10 shows the difference between the crudely inferred and the true at 4.2 K: the crudely inferred is less than the actual . If measurements at higher temperatures were used, the discrepancy would be larger. Therefore it is important to account for the reduction by thermal fluctuations of the switching and return currents. We emphasize that, since we are treating as a temperature-independent quantity, this reduction in the hysteresis is purely a thermal effect. For junctions with area 0.1 m2, it can be seen by comparing Figs. 1 and 9 that the underdamped return current and underdamped switching current become similar around 14 K, and at higher temperatures the underdamped return current exceeds the underdamped switching current. This would imply that there is a current range where neither the zero-voltage branch nor the resistive branch is stable — this is indeed a feature of the behaviour we are describing in the temperature range (for example, see Fig. 3). Above , as we have discussed, it is necessary to consider, in addition, the effects of multiple escape and retrapping. Fig. 11 shows the variation with temperature in the ratio of these mean values. This ratio was obtained from simulations including the effects of both escape and retrapping as the current is ramped in either direction. At low temperatures we find . As the temperature is increased, even well below , departs significantly from . Around , the distribution departs from its conventional thermally activated behaviour. Hysteresis is still present for , but to a decreasing extent as is increased. The inset of Fig. 11 shows the switching and return distributions for a temperature 14.5 K where . The thick black curve shows that the mean and peak of the switching distribution lie above . The thick gray curve (red online) shows that the mean and peak of the return distribution lie below (its width is related to the shape of the conventional return distribution). A difference in the mean switching and return currents, and so some hysteresis, persists even though the underdamped return current exceeds the underdamped switching current, which might be thought to imply the absence of hysteresis. The persistence in hysteresis above in the experiments of Refs. Krasnov et al., 2005 and Franz et al., 2004 is likely to be attributable to the distinction between and — we expect hysteresis to persist up to . For , both escape and retrapping occur close to , so that and hysteresis in the IV characteristic is small.
We would like to note that the probability of a switch being counted is not the same as the probability of a single escape not followed by a retrapping event, since a switch may be preceded by many escape-retrapping events. This difference was not appreciated in the quantitative analysis in Ref. Krasnov et al., 2005, in which the latter quantity — although much smaller than the total probability of a switch — was evaluated as a function of the current of the initial escape (compare the dotted curve and the thick black line in the inset of Fig. 11) and then rescaled888The distribution was scaled by dividing by the total probability of a switch following a single escape event. and fitted to experimental data.
IV.1 Frequency-dependent damping
In our treatment so far, we have been assuming that the damping is frequency independent. Different retrapping and return behaviour may arise when the damping is frequency dependent and we now turn to discuss these differences. If the damping of the system is frequency-dependent — as is likely to be the case unless isolation resistors close to the junction are included or the shunt resistance is much less than the free-space impedance — the system will be characterized by much stronger damping shortly after escape than in the steady running state. This means that overdamped behaviour at escape might lead to multiple escape-retrapping behaviour shortly after an initial escape but, once the junction has been in the running state for some time, it becomes much less strongly damped and might be characterized by the conventional underdamped dynamics and so unlikely to be retrapped.
In their simulations, Kautz and MartinisKautz and Martinis (1990) consider a crossover to low-frequency damping once the junction has been mostly in the running state over a timescale , where is a characteristic frequency, a factor of smaller than the plasma frequency. In their simple model, which captures the qualitative features of the frequency-dependent–damping behaviour, well above the damping is and well below the damping is .
In the simulations presented here so far, we counted a switching event if the junction was mostly in the running state over a certain time period. Experimentally, that time period might be determined by the response time of the measurement electronics. In the case of frequency-dependent damping, the time period is set instead by , since once the junction has been mostly in the running state for the characteristic time and becomes characterized by the much lighter damping , falls and retrapping becomes unlikely. This time is likely to be much shorter than the response time of the electronics.
To model, through simulations, the effect of a decrease in the damping at low frequencies, we neglect retrapping once the junction has been in the running state for a time .
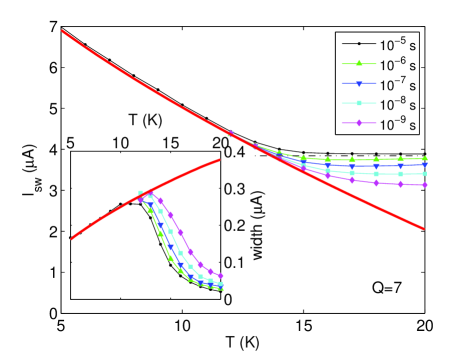
Fig. 12 shows the variation in the mean and width of the switching distribution around as the characteristic time varies. Note that the crossover temperatures and are essentially independent of the measurement time period, since they are set by the crossover between the extremes of the conventional underdamped distribution and by , all of which are essentially independent of the measurement time period. Fig. 12 shows that a decrease in the characteristic timescale leads to a decrease in the mean switching current and to an increase in the width above . The width and mean of the switching distribution for therefore provide an indication of the crossover frequency .
This variation with may be understood by considering the relative sizes of and , in comparison to , around the current at which switching occurs. In the multiple escape-retrap regime, for small such that , the fraction of time in the running state is to a very good approximation and so switching is likely for , i.e., for . (For the simulations presented in Section III, the same approximation holds for the temperatures of interest , since the time-period s — compare Fig. 6.) However for larger such that , large fluctuations of away from occur. These fluctuations make switching likely at and also increase the width of the switching distribution. The larger is, the smaller is likely to be. For example, in Fig. 3a, for s, the escape to the running state at around 3.603 A would last long enough to cause a switch, although A.
The presence of frequency-dependent damping also has a marked effect on the hysteresis of measurements. For an initial escape as the current is ramped up from 0, the system is characterized by the high-frequency damping . In contrast, when the current is ramped down from , the system is characterized by the low-frequency damping . The more underdamped behaviour for return means that hysteresis persists to much higher temperatures than for a system with frequency-independent damping .
IV.1.1 Application to previous work
We now briefly discuss previous work in relation to frequency-dependent damping. The work of Krasnov et al.Krasnov et al. (2005, 2007) is largely on samples with resistances which are therefore likely to be characterized by approximately frequency-independent damping, although the larger resistance of the IJJ samples suggests they may be affected by frequency-dependent damping, so that the damping characterizing retrapping soon after escape is not the same as the damping extracted from the hysteresis in the characteristics.
In their paper, Kivioja et al.Kivioja et al. (2005) were considering mostly the switching dynamics, which are determined by the high-frequency damping, although the retrapping current is determined by the low-frequency damping. They did not include frequency-dependent damping in their modelling and they used the high-frequency as a fitting parameter. They expect that the maximum in the width of the distribution to occur at , when corresponds to their experimental timescale, essentially equivalent to our . This contrasts with our expectation for frequency-independent damping that, at , . Since , the crossover temperature . Kivioja et al. extracted a value for from their experimental results which is therefore larger than would be extracted if thermally activated retrapping had been included. This may explain the discrepancy between their extracted and the suggested by the nominal values of their experimental parameters.
M\a”annik et al.Männik et al. (2005) obtained values for the probability of retrapping from numerical Monte Carlo simulations and included frequency-dependent damping. This model has the advantage that it is able to account for the presumably initially increased rate of retrapping as, in the washboard analog, the particle first accelerates after escape. However, the results are less straightforward to analyse. The authors expressed the net escape rate as a sum of the probabilities of multiple escape-retrap events, related to the thermal escape rate (our Eqn. 2) and the calculated retrapping probability. Although in detail the assessment of individual escape probabilities, a nontrivial problem, is oversimplified and relies on strictly inconsistent approximations,999For an escape event involving retraps before eventual escape in a time , the average time for each escape is , implying an equal probability of each escape event in that average time. However, the probabilities of the 1st escapes were setMännik (2007) to 1, with the th escape being assigned the probability . More rigorously, the escape rate could have been expressed by integrating over all possible values of the time for each escape, subject to the constraint . the model captures at least qualitatively well the effect of retrapping on the switching current statistics. M\a”annik et al. found good agreement between their model for the net escape rate and their experimental results. Their treatment of the probability of retrapping after escape as a time-independent quantity contrasts with the model of Ben-Jacob et al.Ben-Jacob et al. (1982), in which retrapping is modelled by a rate (Eqn. 3) and so with a probability increasing linearly with time spent in the running state. The treatment of this probability as time-independent by M\a”annik et al.Männik et al. (2005) is successful because, in the model of frequency-dependent damping which they used, the time over which retrapping can occur is . Once the particle has been in the running state for a time , low-frequency (under)damping applies and retrapping is unlikely. This expectation is borne out by their simulations, in which they observed retrapping events only times after escape.Männik (2007)
V Conclusions
In summary, we have presented discussion and simulations of the switching and return dynamics of moderately damped Josephson junctions. We emphasized that there is a regime in which the junction repeatedly escapes to and retraps from the running state and demonstrated through the use of simulations that for some choices of parameters, the number of escapes and retraps during a single current ramp to an eventual switch into the running state may be very large (10000). The multiple escape-retrapping regime, with a large number of escapes of duration , is intermediate between the underdamped regime in which a single escape leads to switching, and the overdamped phase-diffusion regime in which a very large number of escapes of very short duration may occur.
By examining the region around the crossover in the temperature dependence of the width in more detail, we showed that the crossover is, in detail, described by not one but two crossover temperatures and . The variations in the mean and width of the switching distribution (in the intermediate regime between the two crossovers) are largely determined by the shape of the thermally activated switching distribution and this shape therefore also determines the temperature of the maximum in the width, the quantity usually identified as the single crossover temperature. We showed that the shape of the switching distribution, parametrized by the skewness, indicates and . We introduced a pertinent rate for understanding the dynamics; we showed that the details of the frequency dependence of the junction damping should affect measured values of the mean and width of switching distribution and weakly affect the crossover temperatures.
We showed that the characteristic temperatures , and are all dependent on the current ramp-rate and therefore are not uniquely determined by measurements at a particular ramp rate, and in addition that there is some dependence of the behaviour around and above on any frequency dependence of the damping.
We also considered the process of return to the supercurrent state as the current is ramped down in the presence of thermally activated retrapping events and the implications for measurements of hysteresis in moderately damped Josephson junctions. We found that some hysteresis is expected to persist above , to , even in junctions with frequency-independent damping. This suggests a resolution of the issue of hysteresis somewhat above in previous reports.
Acknowledgements.
The authors gratefully acknowledge financial support from the UK EPSRC.References
- Ambegaokar and Baratoff [1963] V. Ambegaokar and A. Baratoff Phys. Rev. Lett., 11:104, 1963.
- Ben-Jacob et al. [1982] E. Ben-Jacob, D. Bergman, B. Matkowsky, and Z. Schuss. Phys. Rev. A, 26:2805, 1982.
- Castellano et al. [1999] M. Castellano, G. Torrioli, F. Chiarello, C. Cosmelli, and P. Carelli. J. Appl. Phys., 86:6405, 1999.
- Chen et al. [1988] Y. Chen, M. Fisher, and A. Leggett. J. Appl. Phys., 64:3119, 1988.
- Cristiano and Silvestrini [1986] R. Cristiano and P. Silvestrini. J. Appl. Phys., 59:1401, 1986.
- Fenton et al. [2007] J. Fenton, M. Korsah, C. Grovenor, and P. Warburton. Physica C, 460:1470, 2007.
- Fenton et al. [2008] J. Fenton and P. Warburton. J. Phys. Conf. Series, submitted, 2008.
- Franz et al. [2004] A. Franz, Y. Koval, D. Vasyukov, P. Müller, H. Schneidewind, D. Ryndyk, J. Keller, and C. Helm. Phys. Rev. B, 69:014506, 2004.
- Fulton and Dunkleberger [1974] T. Fulton and L. Dunkleberger. Phys. Rev. B, 9:4760, 1974.
- Ivanchenko and Zil’berman [1969] Y. Ivanchenko and L. Zil’berman. Soviet Physics JETP, 28:1272, 1969.
- Kautz and Martinis [1990] R. Kautz and J. Martinis. Phys. Rev. B, 42:9903, 1990.
- Kivioja et al. [2005] J. Kivioja, T. Nieminen, J. Claudon, O. Buisson, F. Hekking, and J. Pekola. Phys. Rev. Lett., 94:247002, 2005.
- Kramers [1940] H. Kramers. Physica, 7:284, 1940.
- Krasnov et al. [2005] V. Krasnov, T. Bauch, S. Intiso, E. Hürfeld, T. Akazaki, H. Takayanagi, and P. Delsing. Phys. Rev. Lett., 95:157002, 2005.
- Krasnov et al. [2007] V. Krasnov, T. Golod, T. Bauch, and P. Delsing. Phys. Rev. B, 76:224517, 2007.
- Männik [2007] J. Männik. Private communication, 2007.
- Männik et al. [2005] J. Männik, S. Li, W. Qiu, Q. Chen, V. Patel, S. Han, and J. Lukens. Phys. Rev. B, 71:220509, 2005.
- [18] M. Tinkham. Introduction to superconductivity.
- Zappe [1973] H. Zappe. J. Appl. Phys., 44:1371, 1973.