2- INAF-Osservatorio Astronomico di Palermo, Piazza del Parlamento 1, I-90134, Palermo, Italy.
3- AF Smithsonian Astrophysical Observatory, 60 Garden St., Cambridge, MA 02138, USA.
11email: albacete@fcaglp.unlp.edu.ar
An X-ray survey of low-mass stars in Trumpler 16 with Chandra
Abstract
Aims. We identify and characterize low-mass stars in the 3 Myr old Trumpler 16 region by means of a deep Chandra X-ray observation, and study their optical and near-IR properties. We compare X-ray activity of Trumpler 16 stars with known characteristics of Orion and Cygnus OB2 stars.
Methods. We analyzed a 88.4 ksec Chandra ACIS-I observation pointed at the center of Trumpler 16 . Because of diffuse X-ray emission, source detection was performed using the PWDetect code for two different energy ranges: 0.5-8.0 keV and 0.9-8.0 keV. Results were merged into a single final list. We positionally correlate X-ray sources with optical and 2MASS catalogues. Source events were extracted with the IDL-based routine ACIS-Extract. X-ray variability was characterized using the Kolmogorov-Smirnov test and spectra were fitted by using XSPEC. X-ray spectra of early-type, massive stars were analyzed individually.
Results. Our list of X-ray sources consists of 1035 entries, 660 of which have near-IR counterparts and are probably associated with Trumpler 16 members. From near-IR color-color and color-magnitudes diagrams we compute individual masses of stars and their A values. The cluster median extinction is A =3.6 mag, while OB-type stars appear less absorbed, having A =2.0 mag. About 15% of the near-IR counterparts show disk-induced excesses. X-ray variability is found in 77 sources, and typical X-ray spectral parameters are N5.3710 cm and kT1.95 keV, with 1 dispersions of 0.45 dex and 0.8 keV, respectively. OB stars appear, softer with a median kT0.65 keV. The median X-ray luminosity is 6.310 , while variable sources show a larger median L value of 1310 . OB-stars have an even higher median L of 8010 , about 10 times that of the low-mass stars.
Conclusions. The Trumpler 16 region has a very rich population of low-mass X-ray emitting stars. An important fraction of its circumstellar disks survive the intense radiation field of its massive stars. Stars with masses 1.5-2.5 M display X-ray activity similar to that of stars in Cyg OB2 but much less intense than observed for Orion Nebula Cluster members.
Key Words.:
stars: formation – stars: early-type – stars: pre-main-sequence individual: Trumpler 16 – X-rays: surveys – X-rays: stars.On-line material: machine readable tables, color figures.
1 Introduction
The Carina nebula region (NGC 3372) is one of the most massive star
formation regions of the Galaxy. It is associated with a giant Hii region spanning about 4 deg of the sky and being bisected by a
prominent V-shaped dark gas and dusty lane. This prominent young
structure is not as compact as some of the other young galactic
clusters, but seemingly related to a spiral feature. In this
direction, we are looking almost tangentially to the now recognized
Carina-Sagittarius spiral arm, at the edge of a giant molecular cloud
extending over about 130 pc and with a content in excess of
510 solar masses (1988ApJ...331..181G). The
concentration of massive stars (i.e. M20 M) interacts
with the parent giant molecular cloud of the region, leading to
triggered star formation events on intermediate to lower masses
(e.g. 2004MNRAS.351.1457S).
This region harbors several open
clusters and/or star concentrations (Trumpler 14, 15 and 16; Collinder
228 and 232; Bochum 10 and 11) containing more than 60 known O-type
stars (1995RMxAC...2...57F). Large cavities within the giant
molecular cloud are supposed to be carved out by the Tr 14 and 16
open clusters, which contain most of massive stars of the region. In
particular Tr 16 includes three rare main-sequence O3 stars, the
Wolf-Rayet (WR) star HD93162 and the famous luminous blue variable
(LBV) Carinae . There is a historical controversy about the distance
and age of Tr 14 and Tr 16 (1995RMxAC...2...51W). For
instance, from extensive spectroscopy and photometry
1993AJ....105..980M find 3.2 kpc for both clusters. However,
photometric studies are strongly affected by differential extinction
in the region and peculiar reddening, and so the derived distance are
different. An example is the 2004A&A...418..525C work, who for
different R=A /E(B-V) values (3.48 and 4.16 for Tr 16 and Tr 14
regions), compute distances of 4.0 kpc and 2.5 kpc, respectively. A
more reliable distance (2250180 pc), was derived from proper
motion and Doppler velocities of the expanding Carinae Homunculus
using HST-STIS111Data from Hubble Space Telescope (HST) with
the Space Telescope Imaging Spectrograph (STIS) observations
(1997ARA&A..35....1D). Recent work (2003MNRAS.339...44T)
derives a common distance DM=12.14 (2.7 kpc) and an age between
1 Myr and 3 Myr, for Tr14 and Tr16, respectively. For this
study, we adopt for Trumpler 16 a distance of 2250 pc and an age of 3 Myr.
This young age agrees with the 2000ApJ...532L.145S results, who
report the existence of several embedded IR sources where star
formation might be active. Also, 2001ApJ...549..578D confirm
clear evidence of pre-main sequence (PMS) stars in the region, while
2001MNRAS.327...46B have identified two compact Hii
regions possibly linked to very young O-type stars. Finally,
2004MNRAS.355.1237H report a compact cluster of infrared
PMS-stars in Tr 16.
Of the existing methods to identify young stellar populations, the use of X-ray emission is perhaps the least biased (2002ApJ...574..258F). While in main-sequence (MS) stars, from late A to M dwarfs, X-rays are believed to originate from the hot coronal gas that is heated by stellar dynamo magnetic fields (1987ApJ...315..687M), for late type Pre-MS stars (T-Tauri stars (TTSs)) X-ray emission is attributed to solar-like coronal activity but elevated by a factor of 10-10 (1999ARA&A..37..363F). Several authors suggested the possibility of detecting early pre-main sequence (PMS) objects through their hard X-ray emission escaping the highly obscured regions (see 1992AJ....104..758W; 1997PASJ...49..461K; 1997ApJ...486L..39H; 2002ApJ...579L..95H). Recently, X–ray surveys have been successful in identifying the young and pre-MS population in star-forming regions, including: deeply embedded Class I young stellar objects (YSOs), low-mass T-Tauri PMS stars, intermediate-mass Herbig Ae/Be PMS stars, zero-age MS stars. Moreover, X-ray emission from low-mass pre-MS stars usually exhibits a strong variability that helps to confirm membership.
On last decade, X-ray observations of young stars on star-forming regions were intensified thanks to the high spatial resolution and the improved broad-band ([0.2-12.0] and [0.5-10.0] keV) effective area of the XMM-Newton and Chandra satellites. A first X-ray survey in the Carina region by 2003MNRAS.346..704C was performed on the basis of two early XMM-Newton observations (rev #115 and #116) centered on Carinae . Because of the spatial resolution of the EPIC222European Photon Image Camera has about six times less spatial resolution than Chandra ACIS-I camera. camera and relatively short exposure time of the observations (35 ksec), they detected only 80 X-ray sources, most of them related to the massive OB-type stars with L 10-10 . Before the observation used here, three Chandra observations were obtained on this region, two (obsId 50 and 1249) in the timed exposure mode, and the third (obsId 51) in the continuous clocking mode, which produces no image. Using only observation obsId 1249, 2003ApJ...589..509E presented luminosities and hardness ratios of the hot stars in Tr 16, and part of Tr 14. Low-resolution X-ray spectra of luminous sources were discussed by 2004ApJ...612.1065E. However the short exposure time of such observation ( 9.5 ksec) was a serious limitation for the study of intermediate- and low mass stellar population of the region. This limitation exists even if obsId. 50 and obsId. 1249 are combined (2007ApJ...656..462S), reaching completeness just at X-ray luminosity (L ) of 710 , i.e. the X-ray emission level typical of single O- and early B-type stars.
In this paper we present results of the analysis of the deepest X-ray observation ever done in this region (90 ksec). Section 2 gives details on the observation and data reduction procedures. Section 3 explains the method used to detect the sources, photon extraction and the construction of the catalog. In section 4 we present results of the cross-correlation with existing near-IR and optical catalogs of objects and their characterization based on their color-color (CC) and color-magnitude (CM) diagrams. Section 5 presents a statistical study of variability in the X-ray domain. Section 6 is dealing with results of the analysis of extracted X-ray spectra. In section 7 we discuss X-ray luminosities of stars and compare them statistically with the X-ray source population of ONC and Cygnus OB2 star forming regions. In section 8 we discuss X-ray and stellar parameter of O- and early B- type stars. Finally, in section 9 we give a summary and draw conclusions of the paper.
2 X-ray observations
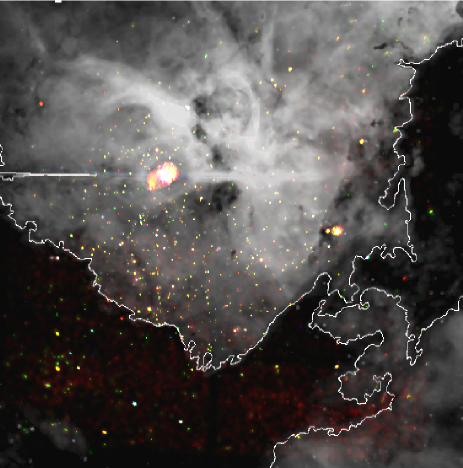
Trumpler 16 was observed with the ACIS detector on board the Chandra X-ray Observatory (CXO) (2002PASP..114....1W) on 2006 August 31333Observation start date is JD 273350372.4528. (obsId 6402), as part of the Guaranteed Time Observation (GTO) Chandra program. The total effective exposure time was 88.4 ksec. The data were acquired in very faint mode, to ease filtering of non-X-ray events, with six CCD turned on, the four comprising the ACIS-I array [0,1,2,3], plus CCDs 6 and 7, part of ACIS-S. However, data from the latter two CCDs will not be used in the following because of the much degraded point spread function (PSF) and reduced effective area resulting from their large distance from the optical axis. The ACIS-I 17’17’ field of view (FOV) is covered by 4 chips each with 10241024 pixels (scale 0.49” px). The observation was pointed toward R.A.=10 44 47.93 and DEC=-59 43’ 54.21”, chosen to maximize the number of stars in the FOV and close to the optical axis, but also including most of the OB stars of the cluster. Figure 1-left shows Trumpler 16 as seen in X-rays by our ACIS-I observation.
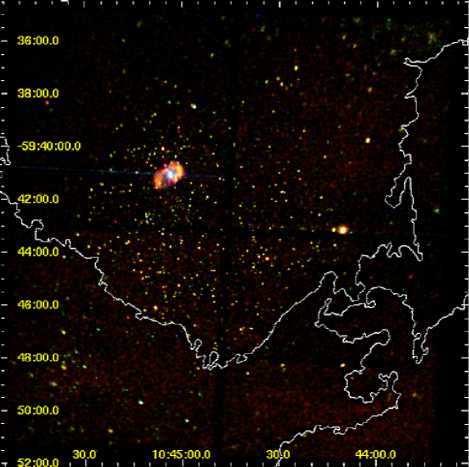
Most of the observed X-ray sources in Fig.1-left are likely located toward the central part of Trumpler 16 , spatially constrained by the dark V-shaped dust lane of the Carina region (1998PASA...15..202B). However, note the small X-ray source concentration inside this dark structure, located towards the South-East part of Fig 1. Deep near-IR observation are needed to reveal counterparts of such population. We defer to a forthcoming paper the use of some public HST - WFPCII444Hubble Space Telescope - Wide Filed Planetary Camera 2 observations to find signatures of star-environment interactions for some of the X-ray sources.
2.1 Data reduction
Data reduction, starting with the Level 1 event list provided by the pipeline processing at the CXO, was performed using CIAO 3.3.0.1555http://cxc.harvard.edu/ciao/ and the CALDB 3.1.0 set of calibration files. We produced a level 2 event file using the acis_process_event CIAO task, taking advantage of the VF-mode enhanced background filtering, and retaining only events with grades = 0,2,3,4,6 and status=0. Photon energies were corrected for the time dependence of the energy gain using the corr_tgain CIAO task. Intervals of background flaring were searched for, but none were found. We will hereafter assume a non-variable background. To improve the sensitivity to faint sources, given the spectrum of the background and that of typical sources, we filtered out events outside the [500:8000] eV energy band.
3 Data analysis
We built images in the three band-passes 0.5-1.5 keV (soft), 1.5-2.2 keV (medium) and 2.2-8.0 keV (hard). Before the color-coded image combination, we corrected single band-images by variations in exposure, sensitivity and vignetting, by computing and dividing by its respective exposure maps. We construct a color-coded X-ray image of the region by composition of the three soft (red), medium (green) and hard (blue) images (see Fig. 1). This image is a 1717 arcmin field which comprises the center of Tr 16 and marginally the southeast part of Tr 14. In addition to revealing a huge number of X-ray point-like sources with different color-energies, inspection of Fig. 1 suggests the presence of soft diffuse X-ray emission in the region. In particular, 2006astro.ph..8173T use a 57 ksec ACIS-I observation centered on Tr 14 to study the diffuse X-ray emission in such a region and in the North-West part of Tr 16. They explain the diffuse X-ray emission as likely arising from the fast O-star winds that shock and thermalize the surrounding medium. Because homogeneous data analysis techniques are required to do justice to a comparison of diffuse X-ray emission in this data-set with that of Tr 14, this study will be presented in a forthcoming paper.
3.1 X-ray source detection
Source detection was performed with the Palermo Wavelet Detection code, PWDetect666See http://www.astropa.unipa.it/progetti_ricerca/PWDetect (1997ApJ...483..370D). It analyzes the data at different spatial scales, allowing the detection of both point-like and moderately extended sources, and efficiently resolving close source pairs. The most important input parameter is the detection threshold (SNR), which we establish from the relationship between background level of the observation and expected number of spurious detections due to Poisson noise777This last quantity was determined from extensive simulations of source-free fields (see. 1997ApJ...483..350D).
Diffuse soft (0.2-1.2 keV) X-ray emission has already been identified in this region (1995RMxAC...2...97C; 2006astro.ph..8173T) and causes different (non-uniform) X-ray background levels across the FOV of our observation. The best way to reduce the diffuse emission contribution is to discard soft photons in the detection procedure. We compute background (BKG) levels in four different energy ranges: 0.5-8.0 keV, 0.7-8.0 keV, 0.9-8.0 keV and 1.1-8.0 keV. Since exposure maps are needed by the source detection algorithm, we used event files in these energy bands as input to the CIAO tool mkexpmap and assumed a monochromatic spectrum (kT=2.0 keV)888http://asc.harvard.edu/ciao/download/doc/expmap_intro.ps. The background level for each energy band was computed as the average of values measured in three circular regions free of sources. If we accept 10 spurious detections in the ACIS FOV999See reasons of this choice in 2007A&A...464..211A., mean computed background levels can be translated into different SNR thresholds for each energy band, i.e.: 4.7, 4.65, 4.6 and 4.55, respectively. These input parameters for PWDetect result in different numbers of detected sources in each energy band, for instance, 1266 sources in the 0.9-8.0 keV band, greater than detected in the ”canonical” 0.5-8.0 keV band (1214 sources). This is consistent with the effect of diffuse soft X-ray emission in masking weak sources.
A careful visual inspection was performed on the 0.5-8.0 keV and 0.9-8.0 keV source lists. We manually rejected respectively 242 and 271 detections, considered spurious either because they were produced by different instrumental artifacts (e.g. CCD gaps, detector edges, false detections along the read out trails), or since they resulted from the “fragmentation” into discrete sources of the extended emission making a toroidal ring around the LBV star Carinae (Fig. 1). Furthermore examination of afterglow101010Afterglow is defined as the residual charge from the interaction of a cosmic ray with the CCD. If afterglow events are not removed from the data, they can result in the spurious ”detection” of faint sources. contamination led us to discard 29 and 20 false detections, respectively. The final source list was constructed by merging both catalogues: the list of 943 sources detected in the 0.5-8.0 keV band and the 1004 sources detected in the 0.9-8.0 keV band. Merging was performed using a criterion of maximum detection significance. The two catalogues coincide in 798 sources, consisting of 322 sources with SigSig, while for the remaining 476 sources SigSig (where Sig is the detection significance in the energy band). Sixty-one sources were detected only in the 0.5-8.0 keV band, while 176 are exclusive to the 0.9-8.0 keV band and would have otherwise remained hidden because of the diffuse emission. This procedure led to a total number of 1035 X-ray sources in the entire field, which we analyze here.
3.2 Photon extraction
| N | NAME | R.A | DEC. | Error | Sig. | Area | PSF | Cts | Count Rates (10 cnt s) | Quantiles | Var. | flag. | ||||||
|---|---|---|---|---|---|---|---|---|---|---|---|---|---|---|---|---|---|---|
| # | CXO J+ | [h:m:s] | [d:m:s] | (”) | () | () | (px.) | (%) | (ph.) | Tot. | Soft | Hard | Q | Q | Q | (keV) | log(P) | id |
| 1 | 104338.73-593832.7 | 10:43:38.74 | -59:38:32.74 | 0.57 | 10.24 | 4.62 | 1757 | 0.90 | 30 | 0.392 | 0.311 | 0.081 | 0.12 | 0.10 | 1.28 | -0.38 | -1 | |
| 2 | 104341.39-594538.8 | 10:43:41.39 | -59:45:38.81 | 0.53 | 8.56 | 6.03 | 1024 | 0.90 | 36 | 0.458 | 0.372 | 0.086 | 0.08 | 0.10 | 0.58 | 1.22 | -0.16 | -1 |
| 3 | 104341.41-594224.5 | 10:43:41.41 | -59:42:24.52 | 0.28 | 8.52 | 16.38 | 964 | 0.91 | 208 | 2.626 | 1.533 | 1.093 | 0.13 | 0.17 | 0.37 | 1.74 | -0.39 | -2 |
| 4 | 104341.48-594102.2 | 10:43:41.49 | -59:41: 2.26 | 0.43 | 8.86 | 6.15 | 997 | 0.90 | 55 | 0.704 | 0.448 | 0.256 | 0.07 | 0.10 | 0.38 | 1.25 | -1.31 | -2 |
| 5 | 104343.14-594409.0 | 10:43:43.15 | -59:44: 9.02 | 0.46 | 8.17 | 5.88 | 726 | 0.90 | 28 | 0.361 | 0.052 | 0.309 | 0.23 | 0.24 | 2.31 | -0.39 | -1 | |
| 6 | 104343.98-594655.9 | 10:43:43.99 | -59:46:55.93 | 0.43 | 8.60 | 4.83 | 843 | 0.90 | 41 | 0.532 | 0.483 | 0.049 | 0.11 | 0.09 | 0.55 | 1.19 | -0.76 | -4 |
| 7 | 104344.11-594817.9 | 10:43:44.11 | -59:48:17.95 | 0.46 | 9.16 | 5.29 | 1042 | 0.90 | 47 | 0.602 | 0.550 | 0.052 | 0.08 | 0.07 | 0.56 | 1.01 | -1.05 | -1 |
| 8 | 104345.36-593948.7 | 10:43:45.37 | -59:39:48.78 | 0.36 | 8.89 | 7.30 | 731 | 0.89 | 54 | 0.699 | 0.498 | 0.201 | 0.11 | 0.10 | 0.31 | 1.25 | -0.34 | -2 |
| 9 | 104345.37-593847.5 | 10:43:45.37 | -59:38:47.54 | 0.40 | 9.40 | 5.83 | 970 | 0.91 | 45 | 0.580 | 0.227 | 0.353 | 0.14 | 0.11 | 0.49 | 1.36 | -2.29 | -1 |
| 10 | 104345.44-594158.9 | 10:43:45.44 | -59:41:58.95 | 0.44 | 8.11 | 5.31 | 564 | 0.90 | 25 | 0.321 | 0.150 | 0.171 | 0.14 | 0.15 | 0.43 | 1.63 | -0.11 | -1 |
| 11 | 104346.39-594929.8 | 10:43:46.39 | -59:49:29.82 | 0.37 | 9.55 | 4.72 | 474 | 0.74 | 41 | 0.634 | 0.550 | 0.084 | 0.11 | 0.10 | 0.35 | 1.22 | -0.74 | -1 |
| 12 | 104348.15-594924.4 | 10:43:48.15 | -59:49:24.41 | 0.29 | 9.32 | 12.27 | 927 | 0.91 | 132 | 1.677 | 1.276 | 0.402 | 0.12 | 0.10 | 0.35 | 1.28 | -1.24 | -2 |
| 13 | 104349.40-594456.3 | 10:43:49.41 | -59:44:56.36 | 0.28 | 7.45 | 13.68 | 418 | 0.90 | 89 | 1.138 | 1.118 | 0.020 | 0.06 | 0.06 | 0.56 | 0.98 | -0.96 | -3 |
| 14 | 104350.13-594552.6 | 10:43:50.14 | -59:45:52.69 | 0.47 | 7.54 | 5.11 | 427 | 0.90 | 15 | 0.203 | 0.248 | 0.044 | 0.08 | 0.07 | 1.01 | -0.36 | -1 | |
| 15 | 104350.71-593744.4 | 10:43:50.71 | -59:37:44.45 | 0.42 | 9.49 | 5.21 | 905 | 0.89 | 41 | 0.539 | 0.414 | 0.125 | 0.12 | 0.11 | 0.47 | 1.33 | -0.78 | -4 |
| 16 | 104350.89-595031.2 | 10:43:50.90 | -59:50:31.25 | 0.39 | 9.76 | 5.26 | 1073 | 0.90 | 23 | 0.302 | 0.164 | 0.138 | 0.16 | 0.09 | 0.68 | 1.15 | -2.67 | -4 |
| 17 | 104351.09-594024.6 | 10:43:51.10 | -59:40:24.67 | 0.38 | 7.97 | 5.42 | 479 | 0.89 | 28 | 0.361 | 0.239 | 0.122 | 0.11 | 0.09 | 0.36 | 1.20 | -0.31 | -1 |
| 18 | 104351.64-594525.1 | 10:43:51.64 | -59:45:25.10 | 0.40 | 7.25 | 7.05 | 376 | 0.90 | 31 | 0.400 | 0.253 | 0.147 | 0.14 | 0.16 | 0.39 | 1.72 | -3.15 | -2 |
| 19 | 104351.87-594035.6 | 10:43:51.88 | -59:40:35.60 | 0.43 | 7.81 | 5.87 | 443 | 0.89 | 7 | 0.102 | 0.102 | 0.001 | 0.13 | 0.09 | 1.21 | -0.34 | -2 | |
| 20 | 104352.13-594802.0 | 10:43:52.13 | -59:48: 2.00 | 0.40 | 8.15 | 5.23 | 528 | 0.90 | 30 | 0.388 | 0.239 | 0.149 | 0.12 | 0.09 | 0.37 | 1.16 | -0.46 | -4 |
| 21 | 104352.25-594157.6 | 10:43:52.25 | -59:41:57.68 | 0.39 | 7.28 | 5.31 | 357 | 0.89 | 25 | 0.325 | 0.301 | 0.023 | 0.07 | 0.08 | 0.93 | 1.07 | -0.16 | -4 |
| 22 | 104352.48-593920.9 | 10:43:52.48 | -59:39:20.96 | 0.23 | 8.35 | 19.14 | 592 | 0.90 | 176 | 2.250 | 1.401 | 0.849 | 0.13 | 0.16 | 0.39 | 1.70 | -0.50 | -2 |
| 23 | 104354.13-594145.2 | 10:43:54.14 | -59:41:45.24 | 0.37 | 7.11 | 4.81 | 357 | 0.90 | 25 | 0.325 | 0.101 | 0.224 | 0.09 | 0.15 | 0.38 | 1.63 | -0.17 | -1 |
| 24 | 104354.20-593805.2 | 10:43:54.21 | -59:38: 5.24 | 0.41 | 8.93 | 5.21 | 737 | 0.89 | 22 | 0.290 | 0.196 | 0.094 | 0.15 | 0.12 | 0.72 | 1.43 | -0.52 | -1 |
| 25 | 104355.11-593624.2 | 10:43:55.11 | -59:36:24.23 | 0.30 | 10.04 | 13.22 | 1205 | 0.90 | 177 | 2.246 | 1.378 | 0.869 | 0.13 | 0.15 | 0.37 | 1.59 | -4.00 | -2 |
| 26 | 104355.14-594750.4 | 10:43:55.14 | -59:47:50.42 | 0.35 | 7.72 | 7.89 | 451 | 0.90 | 44 | 0.567 | 0.470 | 0.097 | 0.07 | 0.08 | 0.50 | 1.07 | -1.07 | -3 |
| 27 | 104355.47-594253.5 | 10:43:55.48 | -59:42:53.59 | 0.29 | 6.69 | 13.04 | 278 | 0.89 | 51 | 0.664 | 0.357 | 0.306 | 0.14 | 0.17 | 0.53 | 1.74 | -3.51 | -2 |
| 28 | 104355.56-594923.0 | 10:43:55.57 | -59:49:23.07 | 0.30 | 8.57 | 8.43 | 629 | 0.90 | 77 | 0.989 | 0.807 | 0.182 | 0.09 | 0.08 | 0.35 | 1.13 | -0.50 | -2 |
| 29 | 104356.25-594936.4 | 10:43:56.25 | -59:49:36.48 | 0.33 | 8.65 | 5.36 | 648 | 0.89 | 36 | 0.471 | 0.335 | 0.136 | 0.14 | 0.09 | 0.39 | 1.21 | -0.41 | -1 |
| 30 | 104356.82-594236.0 | 10:43:56.82 | -59:42:36.03 | 0.46 | 6.57 | 4.90 | 257 | 0.89 | 12 | 0.158 | 0.139 | 0.019 | 0.12 | 0.12 | 1.41 | -0.41 | -1 | |
Notes: Column labeled with refers to the off-axis angle measured in arcmin from the aim point of the observation. Sig. is the significance of the source in number of sigma over background. Flag Id = -1: sources detected only in the 0.9-8.0 keV band. flag Id = -2 and -3 correspond to sources detected in both bands, but Sig Sig and Sig Sig, respectively. Flag Id = -4 refers to sources detected only in the 0.5-8.0 keV band.
Even with the high spatial resolution of the Chandra ACIS-I camera, the high source density in Trumpler 16 , source photon extraction is not an easy task. Although circular regions would contain a relatively large fraction of the PSF for almost all source photons, the extended wings of the PSF mean that very large regions would be needed, incurring in the risk of contamination from nearby sources. Moreover, the resulting inclusion of a large number of background events would reduce the signal to noise of weak sources. On the other hand, extraction from regions that are too small may reduce the photon statistics for further spectral and timing analysis. To address these issues, we decided to use ACIS Extract (AE) v3.79 (acisextract), an IDL based package that makes use of TARA111111http://www.astro.psu.edu/xray/docs/TARA/, CIAO and FTOOLS121212http://heasarc.gsfc.nasa.gov/docs/software/ftools/ software.
This task reduces the problem of accounting for non-Gaussian shapes of the local PSF by calculating the shape of the PSF model at each individual source’s position. For some sources the background level is affected by the extended PSF wings of the bright sources ( Carinae and WR25) in the FOV. AE computes source background locally, by defining background extraction regions as circular annuli with inner radii 1.1 times the maximum distance between the source and the 99% PSF contour, and outer radii defined so that the regions contain more than 100 “background” events. In order to exclude contamination of the regions by nearby sources, background events are taken from a “Swiss cheese” image that excludes events within the inner annuli radii of all the 1035 sources.
AE source extraction was performed using a PSF model that contains a specified fraction of source events (f). Generally, we choose f=90%, and computed the contours from the PSF for a mono-energetic source with E = 1.49 keV. For 9.9% of the sources in the denser parts of the Trumpler 16 field this fraction was reduced to avoid contamination with other nearby sources, in the most extreme cases down to f50% (just 3 sources).
Following AE science hints, we then refine the initial source positions computed by PWDetect131313PWDetect assumes a symmetric PSF. by correlating the source images with the model of local PSF computed by AE libraries. This procedure was only used for those sources lying at off-axis larger than 5 arcmin (316 sources), while for the rest of the source (719 sources) we simply adopt mean photon positions141414Please follow Acis-Extract technical procedures at website http://www.astro.psu.edu/xray/docs/TARA/ae_users_guide. AE also estimates local background spectra, computes redistribution matrix files (RMFs) and auxiliary response files (ARFs), constructs light curves, performs Kolmogorov-Smirnov variability tests, and computes photometry in 14 different energy bands. Results of AE procedure appears in Table1, which lists source number in column (1), name according to CXC naming convention151515http://cxc.harvard.edu/cdo/scipubs.html (2), sky position (R.A. and Dec. J2000) (3,4) with relative uncertainty (5), off-axis angle () (6), significance of the detection (Sig.) from PWDetect analysis (7), the source extraction area (8); the PSF fraction within the extraction area, assuming E=1.49 keV (9); the background-corrected extracted source counts in the 0.5-8.0 keV band (NetCnts) (10); the count rates (CR = NetCnts/Exptime/PSF) in three spectral bands: 0.5-8.0 keV, 0.5-2.0 keV and 2.0-8.0 keV, (11-13); source photon quantiles at 25, 50 and 75% percent in columns 14 to 16 (see sub-section 3.3), the median photon energy () in (17). Column 18 is the log(P) Kolmogorov-Smirnov probability of non-variability (see section § 5), and in (19) are flags from PWDetect detection code.
3.3 X-ray hardness ratios
A commonly used tool to explore the spectral properties of sources with low photon statistics is the hardness ratio (e.g. 1989A&A...225...48S; 2003ApJ...595..719P). In this conventional method, the full energy range is divided into two or three sub-bands and the detected source photons are counted separately in each band. Most popular definitions for a single hardness ratio (HR) exists on basis of only two energy sub-bands: HR=H/S or HR=(H-S)/(H+S). By these definitions, HR is very sensitive to small changes (i.e. statistical fluctuations) in the number of photons falling in each band. The requirement of total counts in the full energy band is at least 40 photons (just 36% of our sources satisfy this constraint). Above this limit HR becomes a ”reliable method” to estimate the real hardness of sources (2007A&A...464..211A).
An improved method to resolve this limitation is based on the quantile analysis (2004ApJ...614..508H). Instead of working with predetermined energy bands, we determine the energy E below which the net counts is x% of the total counts of the source. We define quantile Q as: , where in our study E=0.5 keV and E=8.0 keV. We compute median Q values and quartiles Q and Q and give values in Table 1. A minor inconvenience of this method is that for a given spectrum, various quantiles cannot be considered independent variables, unlike the counts in different energy bands. However, 2004ApJ...614..508H overcome this problem by considering the log(Q/(1-Q)) vs. 3(Q/Q) plane. Based on an extensive set of simulated spectra, they predict loci of models in this plane. We use a set of absorbed thermal models with plasma temperatures of 0.2, 0.5, 1, 2, 4, 10 keV and N equal to 10, 10, 0.410, 10, 410 and 10 cm. Note that the spectrum changes from soft to hard as one goes from left to right in the diagram (see Fig.2).
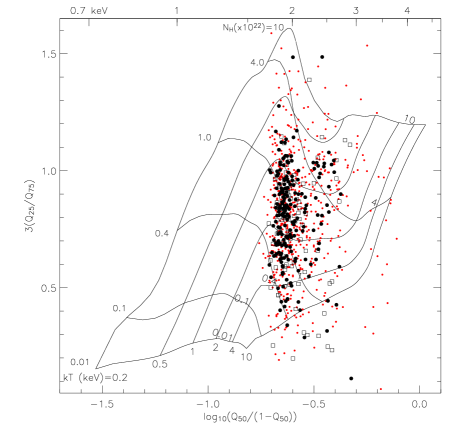
In a statistical sense, a comparison between sources in the grid models suggest typical N and kT values distributed around 0.810 cm and 1.5 keV, but dispersed within grid models of N=0.4-1.010 cm and kT=1-3 keV, respectively. The absence of a systematic difference between the position of sources with and without a 2MASS identification on the hardness-ratio plane is likely to a combination of two observational bias: related to the limiting magnitude of the 2MASS photometry (K 14.3 mag.); the X-ray sensitivity of the Chandra data (f 10 erg s cm). However is not clear, from the observational point of view, i.e. throgouh the near-IR and X-ray flux source distributions, that a fraction of faint stellar X-rays sources would not have 2MASS counterparts. Deeper near-IR and X-ray observations are needed to unveil this issue.
4 Optical and near-IR analysis
4.1 Counterparts
The large amounts of gas, dust and selective extinction of the region, combined with the absence of available deep (V 19 mag) optical photometry, prevent finding optical counterparts for most of our X-ray sources. We consider it appropriate only to use optical data to identify the massive star population (typical V 12, 1993AJ....105..980M) of the region (i.e. Wolf-Rayet, O- and early B-types). We use a recent compendium of massive stars in the Carina Nebula presented by 2006MNRAS.367..763S. Out of a total of 60 stars, 44 lie within the 0.0823 deg FOV of our X-ray observation. We added the binary (O5.5V + O9.5V) FO 15 (2006MNRAS.367.1450N), not included in the list of 2006MNRAS.367..763S. Our final list of 45 hot massive stars is comprised of: 1 LBV, 1 Wolf-Rayet, 21 O-type stars and 22 early B-type stars. With a cross-identification radius of 3 arcsec, a total of 28 X-ray sources were identified. All the O-type stars were identified as X-ray emitters, while just 7/22 (31%) of early B-type (SpT. between B0V to B1.5V) have detectable X-ray emission. The list of massive stars with X-ray counterparts and the discussion of their X-ray properties is presented in § LABEL:obstars.
Apart from the massive stars, our X-ray population is essentially composed of low-mass stars. In such a young cluster like Tr 16, low-mass stars are often optically invisible, being embedded and/or obscured by high amounts of gas and dust. We partially solve this problem by use of the near-IR observations, on which the impact of dust extinction is reduced. We adopt J (1.25 m), H (1.65 m) and K (2.17 m) photometry from the Two Micron All Sky Survey (2MASS) Point Source Catalog (PSC)161616See http://www.ipac.caltech.edu/2mass. 2MASS is complete to magnitudes of 15.8, 15.1 and 14.3 mag in the J, H and K bands, respectively. We restricted our photometry analysis to 2MASS sources with flag quality A, B, C or D in at least one of the three magnitudes (see explanation in the 2MASS All-Sky Data Release User’s Guide). With this restriction 20 sources were removed from our initial list of 5938 sources in the ACIS FOV of our observation. This leaves a total of 5918 2MASS objects171717We note that the 2MASS catalog appears to have a “hole” around Carinae ( 1.5 arcmin radius)..
We began by cross-identifying our X-ray source list with the 2MASS catalog. Identification radii, R, were chosen to limit the number of spurious identifications due to chance alignments, N, and at the same time to include a large number of the true physical associations, N. Identification radii used were 1.0, 1.5, 2.1, and 2.7 arcsec adopted for the four different off-axis angle ranges: [0-2), [2-4), [4-7) and 7 arcmin, respectively181818The adopted radii were computed following technical procedures presented in 2007A&A...464..211A. Results of the final identification are presented in § 4.3 and shown in Table 2. The first seven columns are: X-ray source number; 2MASS nomenclature for identified sources; the offset between the two positions; J, H, K magnitudes; photometry quality flag (Ph.Q); confusion flag (Cont). A total of 660 X-ray sources out of the 1035 in our list were identified with 665 2MASS objects. Five X-ray sources (#96, #382, #401, #816 and #1034) were identified with two 2MASS counterparts each. After a visual inspection, we kept only the closer counterparts. Thus the final list of near-IR counterparts consists of 660 entries.
| N | 2MASS J+ | Offset (”) | J mag. | H mag. | K mag. | Ph.Q | Cont. | A | Mass | Notes |
| 1 | 10433859-5938306 | 2.33 | 14.570.03 | 13.210.04 | 12.630.03 | AAA | 000 | 7.93 | 2.05 | |
| 2 | ||||||||||
| 3 | 10434145-5942245 | 0.30 | 14.180.03 | 13.200.02 | 12.820.02 | AAA | 000 | 4.59 | 2.24 | |
| 4 | 10434126-5941002 | 2.62 | 15.47 | 15.310.14 | 14.600.14 | UBB | 000 | |||
| 5 | 10434295-5944080 | 1.77 | 15.630.08 | 14.310.06 | 13.270.04 | AAA | 000 | 15.27 | 1.25 | K-excess |
| 6 | ||||||||||
| 7 | 10434401-5948177 | 0.76 | 8.700.02 | 8.510.04 | 8.470.02 | AAA | 000 | 1.38 | 19.2 | O9.5V |
| 8 | 10434538-5939468 | 1.92 | 15.90 | 14.88 | 14.900.16 | UUC | 000 | |||
| 9 | 10434536-5938471 | 0.36 | 16.020.10 | 14.040.04 | 13.020.04 | AAA | 000 | 14.90 | 1.01 | |
| 10 | 10434525-5941567 | 2.61 | 14.370.06 | 12.990.05 | 12.180.04 | AAA | 000 | 12.05 | 2.16 | K-excess |
| 11 | 10434659-5949292 | 1.68 | 13.690.05 | 12.680.05 | 12.250.04 | AEA | c0c | 2.38 | ||
| 12 | 10434809-5949246 | 0.50 | 13.51 | 13.090.07 | 12.850.05 | UAA | 0cc | |||
| 13 | 10434937-5944549 | 1.45 | 12.670.02 | 12.200.03 | 12.060.03 | AAA | 000 | 0.82 | 4.89 | |
| 14 | 10435007-5945530 | 0.59 | 15.560.05 | 14.590.03 | 14.190.07 | AAA | 000 | 4.31 | 1.30 | |
| 15 | 10435085-5937437 | 1.28 | 14.860.05 | 13.740.05 | 13.400.05 | AAA | 000 | 3.76 | 1.86 | |
| 16 | 10435088-5950307 | 0.47 | 12.200.02 | 11.990.03 | 11.880.02 | AAA | 000 | 0.28 | 6.22 | |
| 17 | 10435123-5940243 | 1.06 | 14.600.05 | 13.380.04 | 12.880.04 | AAA | 000 | 6.57 | 2.03 | |
| 18 | 10435132-5945239 | 2.64 | 15.540.08 | 14.06 | 13.55 | AUU | cpp | 1.31 | ||
| 19 | 10435191-5940353 | 0.40 | 16.490.16 | 15.150.09 | 14.630.11 | CAA | 000 | 0.70 | ||
| 20 | 10435186-5948017 | 2.02 | 14.490.05 | 13.460.06 | 12.950.05 | AAA | 000 | 6.60 | 2.09 | |
| 21 | 10435223-5941574 | 0.29 | 14.830.05 | 14.460.08 | 14.350.11 | AAA | 000 | 1.88 | ||
| 22 | 10435230-5939222 | 1.87 | 13.030.04 | 11.900.06 | 11.200.04 | AEE | 000 | 3.55 | Mass-deg. | |
| 23 | 10435408-5941463 | 1.19 | 15.400.07 | 14.240.05 | 13.790.05 | AAA | 000 | 5.47 | 1.40 | |
| 24 | 10435419-5938073 | 2.13 | 13.03 | 13.700.06 | 13.530.07 | UAA | 0cc | |||
| 25 | 10435501-5936242 | 0.75 | 11.640.02 | 11.480.03 | 11.370.03 | AAA | 000 | 0.42 | 8.28 | |
| 26 | 10435505-5947505 | 0.70 | 14.180.03 | 13.810.04 | 13.700.06 | AAA | 000 | 2.24 | ||
| 27 | 10435545-5942531 | 0.50 | 14.930.05 | 14.110.05 | 13.840.06 | AAA | 000 | 2.37 | 1.81 | |
| 28 | 10435557-5949226 | 0.39 | 13.440.03 | 12.650.03 | 12.240.03 | AAA | 000 | 5.08 | 2.45 | |
| 29 | 10435606-5949351 | 1.97 | 14.530.05 | 13.830.05 | 13.600.06 | AAA | 000 | 1.87 | 2.07 | |
| 30 | 10435684-5942364 | 0.45 | 14.700.05 | 13.570.03 | 12.880.04 | AAA | 000 | 9.63 | 1.97 | K-excess |
Column 3 (”Offset”) is the offset between X-ray and near-IR counterpart. Ph.Q refers to the 2MASS photometric quality flags for the J, H and, K bands: “A” to “D” indicate decreasing quality of the measurements, “U” that the value is an upper limit. The next column refers to the contamination and confusion flag: For further analysis we considered only sources unaffected by known artifacts, i.e. Cont. = 000 (see 2MASS documentation for details). Masses are given in solar units, and the last column contains information presented in § 4. Note: the ”Mass-deg.” flag indicates mass degeneracy according to a Siess-based Jmag-Mass calibration.
We estimate the expected number of extragalactic sources in our detection list by following 2006A&A...455..903F procedure. We consider the ACIS count-rates of non-stellar sources in the Chandra Deep Field North (CDFN, 2003AJ....126..539A; 2003AJ....126..632B) and estimate absorption corrected count-rates assuming N = 5 cm (from A 3.6, see § 4.3) using PIMMS and assuming power-law spectra with index 1 and 2 (2001MmSAI..72..831G). We then compare these count rates with upper limits taken at random positions in the ACIS FOV. For between 1 and 2 we obtain 72 to 95 expected extragalactic sources. Given the intrinsic near-IR fluxes of these sources and the absorption toward Trumpler 16 , they are expected to be among the 385 without NIR counterparts (cf. Flaccomio et al. 2006). This means that no more than 18 to 24% of the unidentified X-ray population is related to extragalactic sources.
4.2 Unidentified X-ray sources
A large population of young stars, proto-stars, deeply embedded in dense circumstellar gas and dust should be present in the Carina Nebula (2003ApJ...587L.105S). However optical and near-IR counterparts of YSOs are difficult to detect. Fortunately, X-ray emission is expected in young stellar objects along all their initial phases (2000ApJ...532.1097M). X-ray photons easily escape from dense circumstellar material, where absorption process becomes important mainly for energies below 1.2 keV (1983ApJ...270.119M). This makes hard X-ray energies the most appropriate ”window” to detect counterparts of deeply embedded young sources.
Of the 375 X-rays sources without near-IR counterparts, just a small fraction (20%) is expected to be extra-galactic contamination (see §4.1). We are thus dealing with about 300 candidate young (first stage) low-mass stars, highly obscured by circumstellar material. In our data these sources typically have lower X-ray photon statistics than those with near-IR counterpart, i.e. 8 vs. 28 average photons, respectively. In X–rays, no quantitative differences in the median energy and spectral quantiles were found for the X–ray sources with and without near-IR counterparts.
4.3 Near-IR properties of identified X-ray sources
We now investigate the near-IR properties of the X-ray sources. For this purpose we restrict our analysis to sources with high quality photometry (Ph.Q=) and no confusion (Cont.=000). With these requirements the total number of IR sources in the ACIS FOV is reduced from 5918 to 2178. We have also set a further requirement on near-IR counterparts of X-ray sources, that their J, H, and K magnitude errors be all 0.1 mag. All these requirements yield 367 X-ray sources with good near-IR counterparts, out of the original 660.
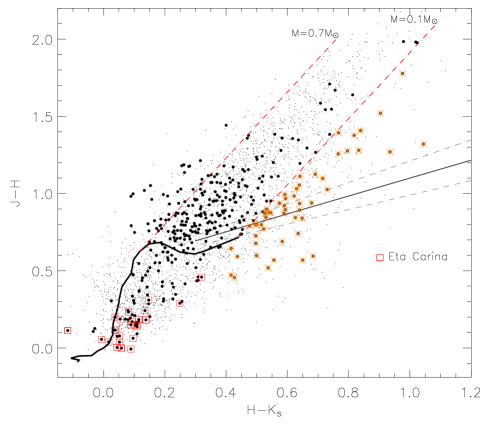
Figure 3 shows the J-H vs. H-K color-color (CC) diagram for these AAA-flagged sources. We also plot for comparison the MS (1995ApJS..101..117K), the Classical T-Tauri Stars (CTTS) locus of 1997AJ....114..288M, and reddening vectors starting from these loci and with slope (=0.125) corresponding to the extinction law given by 2003ApJ...597..957H. Trumpler 16 members with purely photospheric emission should lie in this reddening band. Otherwise, Young stellar objects (YSOs), such as Classical T Tauri and Herbig Ae/Be stars, because of the NIR excess emission originating in the inner parts of their circumstellar disks, are often found to the right of this band, i.e. in the CTTS locus. Fifty-one (out of 367) X-ray sources, i.e. likely Trumpler 16 members, have colors consistent with the (reddened) CTTS locus. This means a fraction of 51/339 (28 OB stars were discarded) 15% of all (low-mass) identified X-ray sources in the CC diagram. Of all 51 sources with intrinsic K-excess i.e. disk-star systems, eleven (Src-Id: 36, 41, 209, 230, 773, 966, 993, 996, 1002, 1003 and 1009) appears below the CTTS vectors, but with intrinsic bright K magnitudes, as is shown in both panles of Fig 4. They are probably intermediate- to high-mass young stars with an intrinsic K-band excess that would be produced by massive accretion disks and/or extended envelopes surrounding massive YSOs. If confirmed, they will contribute for about 40% of the total massive star population of the Trumpler 16 region.
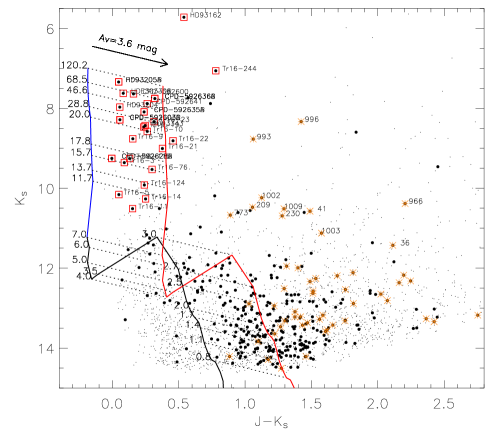
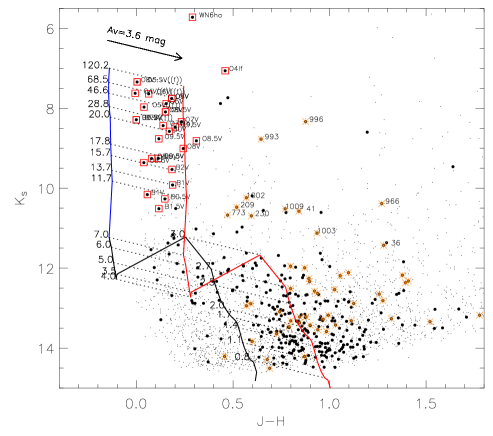
Figure 4-left shows the K vs. J-K color magnitude (CM) diagram for the same stars plotted in Fig. 3. We also show for reference the expected cluster locus: the intrinsic K magnitudes and J-K colors for stars earlier than B5V were taken from the MS calibration of 2000A&A...360..539K and 1989LNP...341...61B. For later spectral types (masses between 0.1 and 7 M), we adopted the 3 Myr isochrone from 2000A&A...358..593S, converted to the observational plane using the calibration given by 1995ApJS..101..117K. The adopted MS and 3 Myr isochrone overlap satisfactorily.
In order to estimate the typical visual absorption of cluster members, we computed the distance of each X-ray source from the cluster locus along the reddening direction on the K vs J-H plane (see Fig. 4-right). Resulting A values for individual sources191919Individual photometric errors of up to 0.1 mag at K and J-H color errors of 0.14, could results for A errors up to 0.7 mag. are listed in column 9 of Table 2. Note that for 11.2K12.8 the absorption cannot be constrained because the reddening vector intersects the cluster locus more than once. In both CM diagrams, some X-ray sources, of the order of 20, lie to the left of or relatively close to the unreddened cluster loci. These are likely to be foreground MS stars and thus their A values either cannot be computed or are close to zero. In a statistical sense, the median A value of OB stars (A =2.00.8 mag.) is lower than that computed for low-mass stars (A =3.62.4 mag., considered to be the typical absorption of the cluster). Obviously, the above estimates depend on the reliability of the assumed cluster locus and on the assumption that disk-induced excesses do not significantly affect the J and H magnitudes. To caution of possible contamination and/or anomalous J magnitude, but in particular for the H-band, the median A for the low-mass star population was estimated by discarding sources with intrinsic K excesses (i.e. labeled with asterisks in figures 3 and 4). We must note that: the dispersion along the J-K axis (see Fig 4-left) indicates differential absorption of the region, and translates in a broad A distribution, with a spread 12.4 mag. the difference between median A values of low-mass and OB stars suggests a clearing effect of strong winds and radiation field of massive stars on their surrounding environment. This conclusion was also reached by 2007A&A...464..211A for massive stars of the Cyg OB2 region. However, compared to the Cyg OB2 region, the fraction of disk-stars members in the Trumpler 16 region is about four times larger.
Finally, we use the 2MASS J-band magnitudes to obtain an estimate of stellar masses for 510 counterparts (of a total 660 identified stars) with J-band Phot.Qual.=’A’ to ’D’. We compute the mass vs. J mag relationship appropriate for the cluster mean age (3 Myr), distance (DM=11.78 mag) and extinction (A =3.6 mag), this latter obtained as described above for the cluster locus in the CM diagrams202020The choice of the J band is justified because (i) in the presence of disk excesses the J-band is the most representative of the photospheric emission i.e. least affected and (ii) the mass ranges in which the mass-luminosity relationship is degenerate are narrower than for a similar relationship in the H and K bands.. We use 2000A&A...358..593S models to compute PMS tracks of low- and intermediate-mass stars (masses 7 M). We interpolated the J mag - mass relation, using the J magnitude vs. mass relationship at 3 Myr (see column 10 of Table 2), to compute individual masses of stars212121This method suffers of photometry inaccuracy, distance and age spread. Mass values should be adopted carefully and should not be considered to measure the slope of the mass function.. Unfortunately, the relation mass-J mag degenerates in the mass ranges 0.2-0.65 M (3 sources) and 2.7-4.52 M (21 sources). We indicate these sources with ”Mass-deg.” flag in column 11 of Table 2, and give mean mass values for sources lying in these two ranges, i.e. 0.42 and 3.55, respectively. Computed masses over 7 M are potentially affected by large uncertainties in the extrapolated J mag - mass relation, and these values were excluded from further analysis. In Table 2 we give masses for a total of 510 stars, of which 410 range between 0.65 and 2.52 M.
5 X-ray variability


PMS stars have high levels of X-ray activity that are commonly attributed to a ”scaled up” solar-like corona formed by active regions. X-ray variability over a wide range of time scales is common in all magnetically active stars (e.g. 1999ARA&A..37..363F; 2003SSRv..108..577F; 2004A&ARv..12...71G). On long time scales, this includes rotational modulation of active regions, their emergence and evolution and magnetic cycles (e.g. 2003A&A...407L..63M; 2005ApJS..160..450F). Most of the observed variations have short time-scales ( hours), however, and can be attributed to small scale flares triggered by magnetic reconnection events.
We first investigated X-ray variability in our sources using the non-binned one-sample Kolmogorov-Smirnov (KS) test (1992nrfa.book.....P). This test compares the distribution of photon arrival times with that expected for a constant source. The test was applied to photons in the source extraction regions, which also contain background photons. Given that the background was found to be constant with time (§2.1), the results, i.e. the confidence with which we can reject the hypothesis that the flux was constant during our observation, can be attributed to the source photons. Table 1, column 18, reports the logarithm of the KS-test significance with values -4 truncated at that value: sources with log(P) -3.0 can be considered almost definitely variable as we expect at most one of the 1035 sources (i.e. 0.1%) to be erroneously classified as variable. Seventy-seven X-ray sources (7.4% of the total) fall in this category. Fifty-five sources with -2.0 log(P) -3.0 can be considered as likely variable, although about half of them suffers of low photon statistics. These numbers of sources are lower limits to the total number of variable sources in the region for several reasons: i) most of the observed variability is in the form of flares, i.e. events that are shorter than our observation and with a duty-cycle that may be considerably longer (2005ApJS..160..423W); ii) the sensitivity of statistical tests to time variability of a given relative amplitude depends critically on photon statistics (see 2007A&A...464..211A). Hereafter, we consider variable those 77 sources with log(P)-3 .
To get a more accurate description of the detected variability, we extracted binned light-curves for each of the 77 variable sources in the region. We adopt a bin length of 900 seconds, a compromise between bins that are long enough to reach a good signal-to-noise ratio per bin for most sources and sufficiently short to resolve the decay phase of typical flares. Since the background of our observation is both low (negligible for many sources) and constant in time, we did not apply any background subtraction to the presented light-curves. In Fig 5 we show examples of the different behavior among the light-curves of variable sources. Source #254 like others (#35, #270, #438, #468, #480, #596, #761 and #975) experience “impulsive” flares with very quick rises and decay phases of only a few hours. Others (sources #503 (#36, #41, #136, #164, #260, #489, #523, #731 and #811) show longer (2 to 10 hours) flares. In several instances a second impulsive event is visible during the exponential decay of a previous flare (e.g. sources #36, #52, #87, #196, #564, #600, #620 and #623). The case of source #696 is a combination of both variability types, with two consecutive flares. Other sources like #714 and #651 (e.g. #27, #251, #271, #793, #839, #890, #904 and #980) show light-curves that, instead of showing typical flares, are characterized by slow continuous rises or decays that might be explained by rotational modulation of non-homogeneously distributed plasma (2005ApJS..160..450F). Finally, light-curves, like those observed for sources #524, #71 and #933, seem to be related to a combination of flare like activity and rotational modulation.
5.1 Variability in massive stars
Because X-ray emission from O stars, which is believed to be unrelated to solar-like magnetic activity, comes from the integrated emission from a large number of small shocks randomly occurring in their strong winds (1997A&A...322..878F; 1999ApJ...520..833O), on average, global X-ray variability is not expected to occur. However, it is surprising that three (out of 28) massive stars, namely Tr 16-11 (B1.5 V, source #136), Tr 16-5 (B1 V, source #489) and the binary HD 93205 (O3.5V((f))+O8V, source #242), are significantly variable, with log(P) values lower than -3. The origin of the observed flare-like variability in the first two sources (B-type stars) is probably coronal activity of unresolved late-type companions. This hypothesis was also proposed for Tr16-11 itself by 2003ApJ...589..509E.

Fig 6 shows the X-ray light-curve of the HD 93205 binary system. Two different processes may be acting simultaneously to explain the observed variability:
-
The decrement of count rate agrees with phase-locked X-ray variability reported by 2001MNRAS.326...85M. The X-ray count rate decreases from 0.055 to 0.033 cts/s (about 35%) in about 88 ksec (1 day) of continuous observation, i.e. about 16% of the orbital period. This is in agreement with X-ray emission from colliding winds contributing most of the total detected emission. However, we cannot discard that magnetically channeled wind streams, at the O3.5 V((f)) primary, collide with the cool and dense postshock plasma at the magnetic equator (e.g. Orionis-C, 2005ApJ...628..986G). A detailed spectral and time (phase-resolved) study should be follow to discern between these two possibilities.
-
The observed short time X-ray variability (log(P)=-3.07). While dynamical instabilities (1990ApJ...362..267L)222222Whenever the wind velocities of two stars are not equal, shocked CWR should be subject to the rapid growth of dynamical (Kelvin-Helmholtz) instabilities, reaching the radiative cooling state. This limit becomes important for massive binaries with typical orbital periods 20 days (2004ApJ...611..434A) in the Colliding Wind Region (CWR) seems to be more appropiate, the magnetic reconnection from an unknown low-mass tertiary companion232323Variability like HD 93205’s has been seen also on theta 2 Ori-A and has been interpreted by 2006ApJ...653..636S as evidence of binary-induced reconnection. However, Image reconstruction shows that hard, short-term variations are from an intermediate-mass tertiary companion at 0.3 arcsec (2002ApJ...565.1216H). cannot be rule out.
We remark that the origin of X-ray variability in high mass stars is out of the scope of this work, it needs for a large X-ray data-set. We leave this subject to a further investigation.
6 Spectral analysis
In order to characterize the hot plasma responsible for the X-ray emission of Trumpler 16 stars, and to estimate their intrinsic X-ray luminosities, we analyzed the ACIS spectra of the 615 (out of all 1035) sources with more than 20 net photons (NET_CNTS), i.e. corrected for local background. Spectral parameters for sources with less than 20 net photons are too much ill-constrained (2007A&A...464..211A), and thus were not determined. Moreover, high local background could affect the reliability of computed spectral parameters. We define the fraction f as the ratio between BKG_CNTS (number of background counts in the source extraction region) and NET_CNTS. We accepted spectral fits for sources with f1 and NET_CNTS20 photons. Of all 1035 sources, only 563 satisfy both conditions above, while 119 show f1 and 353 lie in the low statistics regime (i.e. NET_CNTS20 ph).
Source and background spectra in the 0.5-8.0 keV band were produced with AE (see §3.2), along with individual “redistribution matrices files” (RMF) and “ancillary response files” (ARF). For model fitting, spectra were grouped so to have a specified number of events in each energy bin. Grouping was tuned to the source statistics and we chose 2, 5, 7, 10, and 60 counts per channel for sources with net-counts in the following ranges: [20-40], [40-100], [100-200], [200-500], and [500-**]. Spectral fitting of background-subtracted spectra was performed with XSPEC v12.0 (2004HEAD....8.1629A) and our own shell and TCL scripts to automate the process as described in 2006A&A...455..903F. Because background corrected spectra are not appropriately handled by C-statistics (2005ApJS..160..319G), best-fit parameters for the chosen models were computed by means of the Chi-Squared () minimization.
We fit our spectra assuming emission by a thermal plasma, in collisional ionization equilibrium, as modeled by the APEC code (2001ApJ...556L..91S). Elemental abundances are not easily constrained with low-statistics spectra and were fixed at Z=0.3 Z, with solar abundance ratios taken from 1989GeCoA..53..197A. The choice of sub-solar abundances is suggested by several X-ray studies of star forming regions (e.g. 2002ApJ...574..258F; 2003A&A...401..543P). Absorption was accounted for using the WABS model, parameterized by the hydrogen column density, N (1983ApJ...270..119M). In Table 3 we give best-fit parameters (, N, kT and L ) of the sources.
| N | Cnts. | Stat. | log(N) | kT | log(L) | flag |
|---|---|---|---|---|---|---|
| # | (ph) | () | (cm) | (keV) | (erg/s) | |
| 1 | 30 | 30.51 | no-fit | |||
| 2 | 36 | 30.58 | no-fit | |||
| 3 | 208 | 0.66 | 22.010.16 | 2.070.56 | 31.58 | fitted |
| 4 | 55 | 0.94 | 21.900.31 | 2.962.61 | 30.50 | fitted |
| 5 | 28 | 30.48 | no-fit | |||
| 6 | 41 | 30.64 | no-fit | |||
| 7 | 47 | 31.29 | Tr16-19 | |||
| 8 | 54 | 30.76 | no-fit | |||
| 9 | 45 | 30.68 | no-fit | |||
| 10 | 25 | 30.42 | no-fit | |||
| 11 | 41 | 30.72 | no-fit | |||
| 12 | 132 | 1.50 | 21.230.62 | 2.650.94 | 31.08 | fitted |
| 13 | 89 | 0.40 | 21.640.14 | 0.670.93 | 30.83 | fitted |
| 14 | 15 | 30.23 | no-fit | |||
| 15 | 41 | 30.65 | no-fit | |||
| 16 | 23 | 30.40 | no-fit | |||
| 17 | 28 | 30.48 | no-fit | |||
| 18 | 31 | 0.80 | 22.320.32 | 1.360.88 | 31.04 | fitted |
| 19 | 7 | 29.93 | no-fit | |||
| 20 | 30 | 30.51 | no-fit | |||
| 21 | 25 | 1.21 | 21.970.65 | 0.290.18 | 30.02 | fitted |
| 22 | 176 | 0.94 | 21.810.22 | 3.321.45 | 31.46 | fitted |
| 23 | 25 | 30.43 | no-fit | |||
| 24 | 22 | 30.38 | no-fit | |||
| 25 | 177 | 1.87 | 22.000.18 | 2.170.74 | 31.52 | fitted |
| 26 | 44 | 0.90 | 21.700.27 | 1.490.54 | 30.38 | fitted |
| 27 | 51 | 0.50 | 22.060.32 | 2.111.27 | 31.03 | fitted |
| 28 | 77 | 0.47 | 21.280.72 | 1.490.44 | 30.83 | fitted |
| 29 | 36 | 30.59 | no-fit | |||
| 30 | 12 | 30.12 | no-fit |
Notes: last column flag: Sources with no spectral information (no-fit) have their X-ray luminosities computed by using an average count-rate to L conversion factor (see § LABEL:lx). ”Hard tail” flag refers to the need of more components in the spectral models. Spectral fit parameters for OB-type stars are not listed here as they are presented in Table LABEL:ob.