11email: rlcs1@star.le.ac.uk
Examining the evidence for dust destruction in GRB 980703
The effects that gamma-ray bursts have on their environments is an important and outstanding issue. Dust destruction in particular has long been predicted while observational evidence is difficult to obtain. We examine the evidence for dust destruction by GRB 980703, in which various inconsistent measurements of the host galaxy extinction have been made using the GRB afterglow emission. We construct a spectral energy distribution from nIR to X-ray to measure the extinction at early times and compare this with previous findings. We also construct nIR/optical SEDs at intermediate epochs to examine a previously reported decrease in extinction. The extinction is very high for a GRB host galaxy. The earliest extinction measurement is likely to be lower than previously estimated, and consistent with most later measurements. In a series of SEDs we do not find any evidence of variable extinction. We therefore conclude that there is no clear evidence of dust destruction in this case.
Key Words.:
Gamma rays: bursts1 Introduction
The search for the predicted effects of gamma-ray bursts (GRBs) on their environments is key to understanding the properties of their host galaxies, found both nearby and in the early Universe. Ionisation by the powerful GRB and afterglow emission has now been seen in the form of optical absorption line variability (e.g. GRB 020813, Dessauges-Zavadsky et al., 2006; GRB 060418, Vreeswijk et al., 2007) and hinted at from several reports of low significance variations in X-ray column density for some GRBs, for example GRB 011121 (Piro et al., 2005), GRB 050730 (Starling et al., 2005), GRB 050904 (Boër et al., 2006; Campana et al., 2007; Gendre et al., 2007) and GRB 060729 (Grupe et al., 2007) and from comparison of optical and X-ray hydrogen column densities (Watson et al., 2007).
Optical extinction should also decrease as we expect dust to be destroyed by the GRB jet out to 10–30 pc (Draine & Salpeter, 1979; Waxman & Draine, 2000; Fruchter et al., 2001; Perna & Lazzati, 2002). This should occur very shortly after the onset of the GRB, but so far only one such GRB had potentially shown this effect, GRB 980703, and the decrease in extinction would have occurred from approximately 1 day after the GRB onwards (e.g. Vreeswijk et al., 1999; Holland et al., 2001; Starling et al., 2007). The evidence of this comes from two sources. Firstly the suggestion by Castro-Tirado et al. (1999) that the spectral slope estimated from their - and -band photometric data from around 1 day after the burst indicated a redder value than would normally be expected for GRBs, translating into 2.2. This is large when compared with the average value of found from afterglow studies at later times. Secondly, Vreeswijk et al. (1999) compiled spectral energy distributions (SEDs) at four epochs covering 2.2–5.2 days after the burst and derive a potential decrease in the intrinsic optical extinction at the 2–3 level.
There have been optical extinction measurements of GRB 980703 by five groups using a number of different methods and instrumentation, and measurements of at different times are far from consistent (Figure 1; Table 1). There is, therefore, a need to return to the apparent variability of in GRB 980703, which if confirmed would be the first observational evidence of this kind. We do this via broadband spectral energy distributions, where possible combining an X-ray spectrum with early near-infrared (nIR) and optical data, and thereby discuss the observational manifestations of dust destruction by GRBs. This issue is particularly important to re-examine in the current era of rapid follow-up by the Swift satellite (Gehrels et al., 2004), robotic telescopes (e.g. Liverpool Telescope and Faulkes Telescopes, 2m in diameter) and rapid response mode on larger ground-based telescopes such as the 4m William Herschel Telescope and the 8m Very Large Telescopes.

| Time since burst (days) | Method | Reference | |
|---|---|---|---|
| 0.94 | 2.2 | nIR/optical colour | Castro-Tirado et al. 1999 |
| 1.22 | 1.50.1 | nIR/optical/X-ray SED continuum | Vreeswijk et al. 1999 |
| 1.33 | 0.90.1 | nIR/optical/X-ray SED continuum | Starling et al. 2007 |
| 3.22 | 1.380.35 | nIR/optical SED continuum | Vreeswijk et al. 1999 |
| 4.4 | 0.30.3 | host spectrum Balmer decrement111We note that this method probes a different volume than the other, line-of-sight, methods listed and should therefore not be directly compared. For a discussion on methods of estimating extinction see e.g. Mathis (1983), Savaglio & Fall (2004) and Starling et al. (2007). | Djorgovski et al. 1998 |
| 4.42 | 0.840.29 | nIR/optical SED continuum | Vreeswijk et al. 1999 |
| 5.22 | 0.900.25 | nIR/optical SED continuum | Vreeswijk et al. 1999 |
| 5.3 | 0.90.2 | nIR/optical SED continuum | Bloom et al. 1998 |
2 Re-evaluating the earliest estimate
2.1 Method
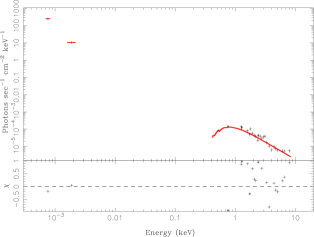
We use a broadband dataset to create a spectral energy distribution at early times when a high value of is reported from optical data. We took the earliest magnitudes reported in Castro-Tirado et al. (1999) ( and band) which were taken at 0.94 days since burst (and used for their estimates of ). We converted the observed magnitudes into fluxes assuming the Johnson filters, after applying a correction for the Galactic extinction of (Schlegel, Finkbeiner & Davis, 1998). The Lyman- Forest correction (e.g. Madau, 1995), due to the redshift of (Djorgovski et al., 1998; Vreeswijk et al., 1999), is negligible for these red bands.
We then calculated the required end-time for the BeppoSAX (Boella et al., 1997) X-ray observations in order to obtain a log observation mid-time of 0.94 days, given that the observations began on 0.827 days (Low Energy Concentrator Spectrometer, LECS, covering keV) and 0.844 days (Medium Energy Concentrator Spectrometer, MECS, covering keV). We extracted a MECS spectrum with these time intervals (up to 0.96 days) and found that only of order 80 counts were present. This did not allow us to create a spectrum of sufficient quality. The observed keV X-ray flux at 1 day is derived from the light curve in Gendre & Boër (2005) to be (4.80.07) 10-13 erg cm-2 s-1 with a decay index of = 0.90.2, (where ). We note that the early optical decay index of = 0.85 0.84 given in Zeh, Klose & Kann (2006) is consistent with this (though note the large associated error). We used this information to transform the full BeppoSAX LECS and MECS X-ray spectra presented in Starling et al. (2007) (log observation mid-time 1.33 days) to the time of the early optical photometry.
We fitted the optical and X-ray data together in a count space fit following the method outlined in Starling et al. (2007). The underlying continuum is fit with an absorbed power law. Previously, when taking into account consistency with the fireball model (Mészáros & Rees, 1992, 1997; Wijers et al., 1998; Wijers & Galama, 1999; Mészáros & Rees, 1999), several authors could estimate the position of the cooling break, . This break appears to move to lower frequencies with time (Vreeswijk et al., 1999; Bloom et al., 1998; Starling et al., 2008). It follows from these results that at 0.9 days since burst we expect a single power law shaped spectrum spanning the nIR/optical to X-ray regime. Galactic absorption is taken into account using cm-2 (Kalberla et al., 2005). Galactic extinction is fixed at (Schlegel, Finkbeiner & Davis, 1998). We modelled the extinction in the nIR/optical bands using the three most well-known extinction curves of the Milky Way (MW), Large Magellanic Cloud (LMC) and Small Magellanic Cloud (SMC), as parametrised by Pei (1992).
2.2 Results
| Model | /dof | |||
|---|---|---|---|---|
| 1022 cm-2 | ||||
| PL+MW | 2.050.02 | 1.24 | 0.8 | 32/24 |
| PL+LMC | 2.050.02 | 1.140.10 | 0.8 | 32/24 |
| PL+SMC | 2.040.02 | 1.08 | 0.7 | 33/24 |
The results of SED fits are given in Table 2. A single absorbed power law is a statistically acceptable fit to these data with power law photon index , X-ray absorption of order 71021 cm-2 and optical extinction of (approximately equivalent to ). Comparing Table 2 with Table 1 shows that the extinction values are consistent at the 1 level with those derived from fits at 3.22, 4.42 and 5.22 days since burst (Vreeswijk et al., 1999), 1.33 days since burst (Starling et al., 2007) and at 5.3 days since burst (Bloom et al., 1998). At this confidence level the result is inconsistent with previous estimates at 0.94 days (Castro-Tirado et al., 1999), 1.22 days (Vreeswijk et al., 1999) and 4.4 days (Djorgovski et al., 1998, host galaxy measurement). MW, LMC and SMC extinction curves are indistinguishable for these data; this is partially because we do not have data in the bluer bands where the 2175Å bump characteristic of only the MW curve would occur at this redshift. The SMC extinction curve is generally the best approximation to GRB host galaxy extinction laws of the three aforementioned curves, as shown in many studies and most likely following the low metallicity pattern of GRB hosts (e.g. Galama & Wijers, 2001; Stratta et al., 2004; Kann, Klose & Zeh, 2006; Schady et al., 2007; Starling et al., 2007).
3 Re-evaluating variability claims
3.1 Method
At four later epochs spanning days since burst Vreeswijk et al. (1999) created nIR/optical SEDs and find a decrease in the intrinsic optical extinction of . In order to test the possible decreasing extinction proposed by these authors we recreated the nIR/optical SEDs at the epochs 3.2, 4.4 and 5.2 days since trigger. We do not reproduce the SED at 1.2 days because this epoch (optical data from 1.2 days extrapolated to 1.3 days) has been covered using the same SED method and models in Starling et al. (2007) and we will use the results from that fit. Likewise, the previously reported epochs of 5.2 and 5.3 days (Vreeswijk et al., 1999; Bloom et al., 1998, respectively) are close in time so are treated here with a single SED. We gathered all available data (Vreeswijk et al., 1999; Castro-Tirado et al., 1999, and references therein) to create light curves in seven photometric bands, (the band was not included in the SEDs of Vreeswijk et al. (1999)), interpolating from the six nearest points in time to find the magnitude per epoch. We corrected for the host galaxy contribution to each band using the host magnitudes from Sokolov et al. (2001) ( band) and Vreeswijk et al. (1999) () and errors on the host magnitude determinations were combined with the datapoint and fit errors.
3.2 Results
The SEDs are shown in Fig. 3 and fit results are presented in Table 3. Fitting a model consisting of a power law plus fixed Galactic extinction and variable (SMC- or MW-like) host extinction, we find we cannot constrain both the power law slope and the host extinction simultaneously. We derive upper limits on which are consistent with each other for these three epochs, and with most previous measurements.

| Epoch | Model | /dof | ||
|---|---|---|---|---|
| 3.22 | PL+SMC | 2.6 | 1.1 | 9.4/4 |
| PL+MW | 2.7 | 1.2 | 9.4/4 | |
| PL+SMC | 2.013 | 0.82 | 9.7/5 | |
| PL+MW | 2.013 | 0.87 | 10.2/5 | |
| PL+SMC | 1.87 | 0.94 | 9.9/5 | |
| PL+MW | 1.88 | 0.99 | 10.4/5 | |
| 4.42 | PL+SMC | 2.1 | 2.2 | 8.1/4 |
| PL+MW | 3.00.3 | 2.3 | 8.7/4 | |
| PL+SMC | 2.013 | 0.97 | 8.1/5 | |
| PL+MW | 2.013 | 1.05 | 9.2/5 | |
| PL+SMC | 1.87 | 1.08 | 8.1/5 | |
| PL+MW | 1.88 | 1.180.28 | 9.3/5 | |
| 5.22 | PL+SMC | 3.00.4 | 1.8 | 1.5/4 |
| PL+MW | 3.0 | 1.9 | 1.55/4 | |
| PL+SMC | 2.013 | 0.88 | 1.9/5 | |
| PL+MW | 2.013 | 0.96 | 2.7/5 | |
| PL+SMC | 1.87 | 1.00 | 1.99/5 | |
| PL+MW | 1.88 | 1.09 | 2.8/5 |
We may hope to reproduce the decrease in if we keep the power law slope fixed, as done by Vreeswijk et al. (1999). They fixed (or ) which they measured from a single power law fit to their optical–X-ray SED at 1.2 days since trigger. At a similar time, 1.3 days, Starling et al. (2007) measured (SMC) and 0.88 (MW) (or ) from a broken power law fit to an optical–X-ray SED, so we tested both fixed values for the power law slope. Making this assumption, that the power law slope does not change in the optical regime over this time period, we consistently find values of , in agreement with the values reported in the initial study for the final two epochs but lower than those of the first two epochs (Vreeswijk et al., 1999). Of those tested, no one extinction model is preferred.
4 Discussion: is there evidence for dust destruction in GRB 980703?
Construction of a broadband SED at early times (0.9 days) results in a lower value for the optical extinction than previously found using the optical colour, bringing this first extinction estimate into line with all later afterglow measurements at the 2 level or better (Fig. 1). We then addressed the possible decrease in extinction claimed for several later epochs by creating new SEDs at these times with both increased wavelength coverage and fitting with a wider range of extinction models. It appears that given the substantial errors on most afterglow-derived measurements they are all consistent when the SEDs are recreated in a consistent manner and fit with the same models. We have tested the need for decreasing extinction across all our newly derived measurements spanning days since trigger by performing a linear fit to the five values and their 1 errors. We adopted the SMC extinction curve in all cases, with the power law photon index in the optical regime as measured at 0.9 and 1.2 days and fixed at 2.013 at 3.2, 4.4 and 5.2 days (all consistent with ). Throughout this time period the optical spectral slope should be well described by a single power law. The cooling break is proposed to lie in the medium energy X-ray band early on (e.g. at 81017 Hz at 1.3 days (Starling et al., 2008)) to account for the X-ray temporal slope within the fireball model (hence a broken power law model was adopted for the broadband SED at this time) and in the soft X-ray band or UV five days since trigger (Bloom et al., 1998). In a homogeneous circumburst medium the cooling break would move to lower frequencies with time approximately as t0.5 up until the onset of any jet break, and would remain within the X-ray band throughout the epochs covered by this study.
We find that a single value of = 0.960.07 is an acceptable description of the data, with a fit statistic of /dof = 2.13/4. This is shown in Figure 4. A fit to the data using a polynomial of degree 1 (allowing for an increase or decrease in the extinction) returned a fit statistic of /dof = 1.62/3, which does not significantly improve the fit; the F-Test probability for inclusion of the additional free parameter is 0.4, i.e. there is a 40% chance probability of obtaining this result. While the lack of broadband (X-ray and UV) data at these epochs prevents us from definitively ruling out variable , the results strongly suggest that a decreasing extinction is not required. This may be due to a combination of the additional data used in our study, application of the SMC extinction curve and a different fitting procedure. We cannot identify the preferred extinction model in any of our fits, again because more optical bands, particularly towards the UV where the curves deviate most significantly, are needed. This also means that where the extinction curves applied to estimate the previous values differ, this is unlikely to affect the overall results. Kann, Klose & Zeh (2006) have shown that it is difficult to distinguish between optical extinction models for of which GRB 980703 () is an example.
Most models predict some form of ionisation and dust destruction by the GRB on its immediate surroundings. To observe this we need to probe distances of perhaps up to parsec from the GRB (Waxman & Draine, 2000). Decreasing X-ray column densities, while not yet measured at a highly significant level, suggest ionisation by the GRB is taking place. Comparison of H I column densities from optical spectra with equivalent hydrogen columns measured from X-ray spectra concluded that the optical and X-ray gas are likely not co-located, and the wide spread in measured values implies that ionisation plays a role (Watson et al., 2007). These authors estimate a maximum distance out to which most of the hydrogen has been ionized by the GRB of 3 parsec. Time resolved optical spectroscopy has now revealed compelling evidence of UV pumping, seen as variations in optical absorption line properties, most evident in GRB 060418 (Vreeswijk et al., 2007). These results suggest that the optical regime is probing gas that lies 1.7 kiloparsec from the GRB site, further than the distance out to which dust is thought to be destroyed.
Dust destruction will also only take place as the GRB ionising flux reaches the cloud, perhaps only minutes or seconds (in the observer frame) after the GRB has occurred depending on the distance to the cloud and the number and energy of ionising photons, and should be temporally coincident with the ionisation. To return to the example of GRB 060418, we note that observations began 11 minutes after the burst. Changes in the X-ray column density thought to be due to ionisation by the GRB are on similar timescales, for example in GRB 050730 this occurred over the first 8 minutes since trigger. In the case of GRB 980703 accurate localisation occurred only 20 hours after the burst when an X-ray afterglow was found using the BeppoSAX narrow field instruments (Galama et al., 1998). It seems unlikely, therefore, that we would be able to detect any observational manifestation of either ionisation or dust destruction by the GRB jet in this source. Swift observations of GRBs have revealed later time X-ray flaring (observed up to 73 hours after the onset of the GRB in rare cases Curran et al., 2008) which may also have an effect on the GRB surroundings and at later times than the GRB jet itself. The X-ray light curve for GRB 980703 is, however, not well sampled enough to allow flares to be clearly recognised (Gendre & Boër, 2005).
The lower average optical extinction value we have derived for GRB 980703 remains the highest of all the extinction values found in the BeppoSAX GRB afterglow sample (Starling et al., 2007). In the Swift era even higher extinction values have been proposed for so-called ‘dark’ bursts (e.g. Jakobsson et al., 2004; Rol et al., 2005) at similar redshifts to GRB 980703, such as GRB 051022 located at in which our line-of-sight to the GRB may pass through a dusty region of the host galaxy unrelated to the GRB location (Rol et al., 2007).

5 Conclusions
The optical extinction measurements in the literature for GRB 980703 are inconsistent, and suggested a decrease in extinction with time indicative of dust destruction which is predicted to occur in GRBs. We have re-examined the greatest outlier in these measurements, using broadband SED fits rather than optical colour, to estimate the extinction. We find a lower value than previously estimated, in line with most of the later measurements. We have also investigated the apparent decrease in extinction by recreating the nIR/optical SEDs at these epochs with extended wavelength coverage and a wider range of models for the extinction law. Both from our new SED fit results and given that the extinction measurements begin as late as 0.9 days after the burst, we conclude that there is no evidence of dust destruction by this GRB. In the current era of rapid accurate GRB localisations and follow-up we now have an opportunity to observe some of the effects of GRBs on their environments, and studies such as this using multiple early-time SEDs will be of great value.
Acknowledgements.
RLCS acknowledges financial support from STFC and useful discussions with A.J. van der Horst, P.M. Vreeswijk, K. Wiersema and R.A.M.J. Wijers. We thank the referee for constructive comments that have improved this manuscript. This research has made use of SAXDAS linearized and cleaned event files produced at the BeppoSAX Science Data Center, and the software packages ISIS, Xspec and IDL.References
- Bloom et al. (1998) Bloom J. S. et al. 1998, ApJ, 508, L21
- Boella et al. (1997) Boella G., Butler R. C., Perola G. C., Piro L., Scarsi L., Bleeker J. A. M., 1997, A&AS, 122, 299
- Boër et al. (2006) Boër M., Atteia J. L., Damerdji Y., Gendre B., Klotz A., Stratta G., 2006, ApJ, 638, L71
- Campana et al. (2007) Campana S. et al., 2007, ApJ, 654, L17
- Castro-Tirado et al. (1999) Castro-Tirado A. J. et al., 1999, ApJ, 511, L85
- Curran et al. (2008) Curran P. A., Starling R. L. C., O’Brien P. T., Godet O., van der Horst A. J., Wijers R. A. M. J., 2008, A&A , in press, arXiv:0802.3803
- Dessauges-Zavadsky et al. (2006) Dessauges-Zavadsky M., Chen H.-W., Prochaska J. X., Bloom J. S., Barth A. J., 2006, ApJ, 648, L89
- Djorgovski et al. (1998) Djorgovski S. G., Kulkarni S. R., Bloom J. S., Goodrich R., Frail D. A., Piro L., Palazzi E., 1998, ApJ, 508, L17
- Draine & Salpeter (1979) Draine B. T., Salpeter E. E., 1979, ApJ, 231, 438
- Fruchter et al. (2001) Fruchter A. S., Krolik J. H., Rhoads J. E., 2001, ApJ, 563, 597
- Galama et al. (1998) Galama T. J., van Paradijs J., Antonelli A., Vreeswijk P., Kouveliotou C., Torroni V., Pastor C., 1998, GCN Circulars 127
- Galama & Wijers (2001) Galama T. J., Wijers R. A. M. J., 2001, ApJ, 549, L209
- Gehrels et al. (2004) Gehrels N. et al., 2004, ApJ, 611, 1005
- Gendre & Boër (2005) Gendre B., Boër M., 2005, A&A , 430, 465
- Gendre et al. (2007) Gendre B., Galli A., Corsi A., Klotz A., Piro L., Stratta G., Boër M., Damerdji Y., 2007, A&A , 462, 565
- Grupe et al. (2007) Grupe D. et al., 2007, ApJ, 662, 443
- Holland et al. (2001) Holland S. et al., 2001, A&A , 371, 52
- Jakobsson et al. (2004) Jakobsson P., Hjorth J., Fynbo J. P. U., Watson D., Pedersen K., Björnsson G., Gorosabel J., 2004, ApJ, 617, L21
- Kalberla et al. (2005) Kalberla P. M. W., Burton W. B., Hartmann D., Arnal E. M., Bajaja E., Morras R., Poppel W. G. L., 2005, A&A, 440, 775
- Kann, Klose & Zeh (2006) Kann D. A., Klose S., Zeh A., 2006, ApJ, 641, 993
- Madau (1995) Madau P., 1995, ApJ, 441, 18
- Mathis (1983) Mathis J. S., 1983, ApJ, 267, 119
- Mészáros & Rees (1992) Mészáros P., Rees M. J., 1992, MNRAS, 257, 29
- Mészáros & Rees (1997) Mészáros P., Rees M. J., 1997, ApJ, 476, 232
- Mészáros & Rees (1999) Mészáros P., Rees M. J., 1999, MNRAS, 306, L39
- Pei (1992) Pei Y. C., 1992, ApJ, 395, 130
- Perna & Lazzati (2002) Perna R., Lazzati D., 2002, ApJ, 580, 261
- Piro et al. (2005) Piro L. et al., 2005, ApJ, 623, 314
- Rol et al. (2005) Rol E., Wijers R. A. M. J., Kouveliotou C., Kaper L., Kaneko Y., 2005, ApJ, 624, 868
- Rol et al. (2007) Rol E. et al., 2007, ApJ, 669, 1098
- Savaglio & Fall (2004) Savaglio S., Fall M. S., 2004, ApJ, 614, 293
- Schady et al. (2007) Schady P. et al., 2007, MNRAS, 377, 273
- Schlegel, Finkbeiner & Davis (1998) Schlegel D. J., Finkbeiner D. P., Davis M., 1998, ApJ, 500, 525
- Sokolov et al. (2001) Sokolov, V. V. et al., 2001, A&A, 372, 438
- Starling et al. (2005) Starling R. L. C. et al., 2005, A&A , 442, L21
- Starling et al. (2007) Starling R. L. C., Wijers R. A. M. J., Wiersema K., Rol E., Curran P. A., Kouveliotou C., van der Horst A. J., Heemskerk M. H. M., 2007, ApJ, 661, 787
- Starling et al. (2008) Starling R. L. C., van der Horst A. J., Rol E., Wijers R. A. M. J., Kouveliotou C., Wiersema K., Curran P. A., Weltevrede P., 2008, ApJ, 672, 433
- Stratta et al. (2004) Stratta G., Fiore F., Antonelli L. A., Piro L., De Pasquale M., 2004, ApJ, 608, 846
- Vreeswijk et al. (1999) Vreeswijk P. M. et al., 1999, ApJ, 523, 171
- Vreeswijk et al. (2007) Vreeswijk P. M. et al., 2007, A&A, 468, 83
- Watson et al. (2007) Watson D. et al., 2007, ApJ, 660, L101
- Waxman & Draine (2000) Waxman E., Draine B. T., 2000, ApJ, 537, 796
- Wijers et al. (1998) Wijers R. A. M. J., Bloom J. S., Bagla J. S., Natarajan P., 1998, MNRAS, 294, L13
- Wijers & Galama (1999) Wijers R. A. M. J., Galama T. J., 1999, ApJ, 523, 177
- Zeh, Klose & Kann (2006) Zeh A., Klose S., Kann D. A., 2006, ApJ, 637, 889