Anomalous microwave emission from the Hii region RCW175
Abstract
We present evidence for anomalous microwave emission in the RCW175 Hii region. Motivated by 33 GHz resolution data from the Very Small Array (VSA), we observed RCW175 at 31 GHz with the Cosmic Background Imager (CBI) at a resolution of . The region consists of two distinct components, G29.0-0.6 and G29.1-0.7, which are detected at high signal-to-noise ratio. The integrated flux density is Jy at 31 GHz, in good agreement with the VSA. The 31 GHz flux density is Jy () above the expected value from optically thin free-free emission based on lower frequency radio data and thermal dust constrained by IRAS and WMAP data. Conventional emission mechanisms such as optically thick emission from ultracompact Hii regions cannot easily account for this excess. We interpret the excess as evidence for electric dipole emission from small spinning dust grains, which does provide an adequate fit to the data.
1 Introduction
In recent years there has been mounting observational evidence for a new diffuse component emitting at frequencies GHz. The anomalous microwave emission was first detected at 14 and 32 GHz by Leitch et al. (1997). Since then, a similar picture has emerged both at high latitudes (Banday et al., 2003; de Oliveira-Costa et al., 2004; Fernández-Cerezo et al., 2006; Hildebrandt et al., 2007; Bonaldi et al., 2007) and from individual Galactic sources (Casassus et al., 2004, 2006, 2007; Watson et al., 2005; Scaife et al., 2007; Dickinson et al., 2007), although negative detections have also been reported (Dickinson et al., 2006; Scaife et al., 2008). The spectral index between 20 and 40 GHz is (Davies et al., 2006) with some evidence of flattening at GHz (Leitch et al., 1997; de Oliveira-Costa et al., 2004; Hildebrandt et al., 2007). The emission appears to be very closely correlated with far-IR data suggesting a dust origin. Various emission mechanisms have been suggested, including hot ( K) free-free (Leitch et al., 1997), flat spectrum synchrotron (Bennett et al., 2003), spinning dust (Draine & Lazarian, 1998a, b) and magnetic dust (Draine & Lazarian, 1999). The overall picture is still very unclear and new data covering the range GHz are urgently needed.
RCW175 (Rodgers et al., 1960) is a diffuse Hii region, which consists of a “medium brightness” optical filament (G29.1-0.7, S65) in extent, and a nearby compact source (G29.0-0.6), which is heavily obscured by dust. Although the filament is clearly seen in high resolution data, the compact counterpart is considerably brighter. The ionization is thought to be provided by a single B-1 II type star, which forms part of a 5-star cluster (Forbes, 1989; Sharpless, 1959) at a distance of 3.6 kpc.
Observations made with the Very Small Array (VSA) at 33 GHz (Watson et al., 2003; Dickinson et al., 2004) as part of a Galactic plane survey (Todorović et al., in prep.) indicate that RCW175 is anomalously bright by a factor of , when compared with lower frequency data. In this Letter, we present accurate Cosmic Background Imager (CBI) GHz observations of RCW175 and make a comparison with ancillary radio/FIR data. We find that the emission at GHz is significantly above what is expected from a simple model of free-free and vibrational dust emissions.
2 Data
2.1 31 GHz: Cosmic Background Imager
The CBI is a GHz 13-element comounted interferometer, operated at the Chajnantor Observatory, Chile. The original CBI used 0.9 m dishes to provide high temperature sensitivity measurements on angular scales (Padin et al., 2002; Readhead et al., 2004). Recently, it has been upgraded with 1.4 m dishes (CBI2) to give increased temperature sensitivity on angular scales (Taylor et al., in prep.).
We observed RCW175 at RA, Dec (J2000), on 4 nights in May 2007, with a total integration time of 6 hr with CBI2. Boresight rotations of the array were used to improve the -coverage. Ground spillover was removed by subtracting observations of a comparison field, 8 min later in RA, observed at the same hour angles. Jupiter was the primary amplitude/phase calibrator with absolute calibration tied to a Jupiter temperature of K at 33 GHz (Hill et al., 2008). Observations of secondary calibrators showed that the pointing was good to better than .
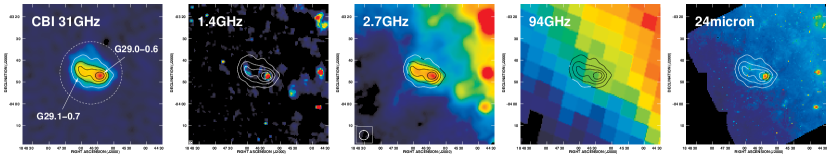
A uniform-weighted, CLEANed map is shown in Fig. 1. The synthesized beam is and the primary beam is approximately Gaussian with FWHM . Corrections for the primary beam were made directly to the CLEAN components at each frequency; the bulk of the emission fits well within the extent of the primary beam. The total flux density in the map is 6.4 Jy with a peak brightness of 1.04 Jy/beam and the noise level is 27 mJy/beam.
The CBI map detects and resolves both components in the RCW175 region. G29.0-0.6 in the west is more compact and is significantly brighter than the more diffuse G29.1-0.7 in the east. Although there is some extended emission almost all () of the flux can be fitted by two Gaussian components. Note that the entire extent of RCW175 is equivalent to beam areas, thus the maximum CLEAN bias is Jy. We fitted two elliptical Gaussians plus a baseline offset using the aips task jmfit. At 31 GHz we find that G29.0-0.6 has a deconvolved size and integrated flux density, Jy. G29.1-0.7 is and Jy. Simulations showed that CBI flux-loss due to the limited -coverage is when fitting two Gaussians to the bulk of the emission.
2.2 Ancillary radio/FIR data
Table 1 lists frequencies, angular resolutions and references for the data111Data were downloaded from the Skyview website (http://skyview.gsfc.nasa.gov), the MPIfR Image Survey Sampler website (http://www.mpifr-bonn.mpg.de/survey.html), the LAMBDA website (http://lambda.gsfc.nasa.gov/) and the IRSA website (http://irsa.ipac.caltech.edu) used in this Letter and Fig. 1 shows selected maps centered on RCW175. The radio maps from 1.4 GHz to 14.35 GHz show enhanced emission at the same location as that seen in the CBI image with the bright, more compact, hotspot in the west (G29.0-0.6) and the fainter component to the east (G29.1-0.7). For data with resolutions , the sub-components are not well separated and the bulk of the emission is confined to a region . At these resolutions the region looks like one extended object with G29.0-0.6 dominating at one end. The higher resolution NVSS 1.4 GHz/Spitzer m data show the more compact G29.0-0.6 has an extent of . A filament of emission to the east (G29.1-0.7) is coincident with the filament seen in high resolution optical/IR images. There is low-level emission in the region in between, which is particularly evident in the m image.
3 Flux density spectrum
3.1 Integrated flux density spectrum
The integrated flux density in each map was calculated both by fitting multiple Gaussians (with baseline offset) and by integrating over a given aperture. For the interferometric data, both methods gave roughly consistent results within the errors. For total-power data, the aperture value could be over-estimated due to the background level. Moreover, a possible offset of in the CBI map could result in a bias depending on the exact aperture location; an offset of does appear to be visible when comparing CBI contours with the NVSS 1.4 GHz map (Fig. 1). For these reasons, we chose the Gaussian fitting method as described in §2.1.
Integrated flux densities for RCW175 and the G29.0-0.6 component are given in Table 1 and plotted in Fig. 2. Absolute calibration errors (assumed to be 10% if not known) were added in quadrature to the fitting error reported by jmfit. We include the 33 GHz value for RCW175 from the VSA, which is in good agreement with the CBI value. The lower resolution () VSA data meant that a single Gaussian fit was adequate and that flux loss was negligible. Since there is a correction factor of 1.53 for the primary beam at the position of RCW175, we assigned a conservative 10% error to account for any small deviations from the assumed Gaussian primary beam. An upper limit was inferred from the WMAP W-band (94 GHz) map by fitting for a parabolic baseline in the vicinity of RCW175 to account for the Galactic background, and calculating the of the residual map.
3.2 SED fitting
For a classical Hii region, the radio/microwave spectrum consists of free-free emission at radio wavelengths and vibrational dust emission at infrared wavelengths. At the lowest radio frequencies (typically GHz), the free-free emission is optically thick and follows a spectrum222Throughout this Letter, we use the spectral index convention for flux density given by .. Above the turnover frequency (typically GHz), the emission becomes optically thin and follows a power-law, with very little dependence on physical conditions (Rybicki & Lightman, 1979; Dickinson et al., 2003). At high frequencies (typically GHz), vibrational dust emission becomes dominant. Vibrational dust is well-represented by a modified black-body function, , where is the dust emissivity index and is the black-body function for a given dust temperature, .
The SED for RCW175 and the G29.0-0.6 component is shown in Fig. 2. The low frequency ( GHz) data were fitted by an optically thin free-free power-law spectrum () fixed to the theoretical value, for K and frequencies around GHz. When fitting for the index we found , which is consistent with this value. The infrared data (m) were fitted by a single temperature dust component using a simple modified black-body curve, . We did not attempt to fit data at shorter wavelengths. Since there are no data points in the sub-mm ( GHz), the emissivity index was fixed at , which is typical for Hii regions (e.g. Gordon (1988)). Flatter indices in the range have been observed while the preferred value for K is (Dupac et al., 2003). However, the 94 GHz upper limit does not allow flatter indices than . The best-fitting dust temperatures were K and K, for RCW175 and G29.0-0.6, respectively.
From Fig. 2 it is clear that the GHz flux densities are significantly higher than the simple model can allow for. This model predicts a 31 GHz flux density for RCW175 of Jy, compared to the measured value of Jy. This corresponds to an excess over the free-free emission of Jy (). Adopting the best-fit spectral index at low frequencies results in a larger excess at 31 GHz, although at a reduced significance level () due to the increased error when fitting for an additional parameter. The brighter component of G29.0-0.6 shows a similar level of excess (Fig. 2).
4 Discussion
A peaked (convex) spectrum is required to produce excess emission at GHz without exceeding the upper limit at 94 GHz. The upper limit at 94 GHz strongly rules out a cold thermal dust component, or a flatter dust emissivity. Convex spectra can be produced by optically thick ultracompact (UC) Hii regions, gigahertz-peaked spectrum (GPS) sources, or some new mechanism such as electro-dipole and magneto-dipole radiation.
UC Hii regions are self-absorbed up to higher frequencies because of extremely high densities. Indeed it is possible to fit the radio data including the VSA/CBI data by including a homogenous compact Hii region with angular size and emission measure of cm-6pc. Such parameters are within observed limits (Wood & Churchwell, 1989). However, the additional component produces too much flux ( Jy) at 94 GHz. For the same reasons, magneto-dipole radiation can also be excluded as a major contributor.
GPS sources are high redshift radio sources in which the radio jets have been highly confined and the synchrotron emission is self-absorbed. A search through the NVSS catalogue (Condon et al., 1998) revealed no bright ( mJy) compact radio sources in this region and no bright ( mJy), point-like sources appear in the NVSS 1.4 GHz map.
The anomalous emission could be due to electric dipole radiation from small rapidly spinning dust grains. If such grains have a residual dipole moment and spin at GHz frequencies, they will emit over a narrow range of frequencies. Fig. 2 shows a typical spinning dust spectrum using the model of Draine & Lazarian (1998b) for the Cold Neutral Medium (CNM), scaled to fit the VSA/CBI data. The highly peaked spectrum allows an adequate fit to the data both at GHz and yet consistent with the 94 GHz upper limit. We note that the appropriate model for Warm Ionized Medium (WIM) peaks at a slightly lower frequency and predicts too much flux at GHz. However, the models are fairly generic and allow considerable freedom in the dust parameters (Finkbeiner, 2004). A similar situation is observed in the Hii region G159.6-18.5 (Watson et al., 2005) and the dark cloud LDN1622 (Casassus et al., 2006).
The Draine & Lazarian (1998b) models are expressed in terms of the intensity per hydrogen column density, in units of Jy sr-1 cm2 per H atom. We estimate an average column density of hydrogen for RCW175 (H) cm-22 using the canonical factor H cm-2 per unit of (Finkbeiner et al., 2004). The best-fitting spinning dust model in Fig. 2 corresponds to (H) cm-22. The observed levels are therefore consistent with the emissivities of Draine & Lazarian (1998b). It is also remarkable that the amplitude of the anomalous component is similar to the emissivity relative to m observed at high Galactic latitudes (Davies et al., 2006), which is equivalent to Jy at 30 GHz per 6000 Jy at 100 m. This does not appear to be the case for all Hii regions, which have so far shown to have a reduced radio-to-dust emissivity (Dickinson et al., 2007; Scaife et al., 2007). High resolution, multi-frequency data in the range GHz are needed to confirm this result and to investigate the nature of anomalous emission.
5 Conclusions
Using data from the VSA and CBI, we have observed excess emission at GHz from the Hii region RCW175. The flux density spectrum indicates that about half of the flux in this region is from optically thin free-free emission leaving about half unaccounted for. An upper limit at 94 GHz from WMAP data constrains the contribution of thermal dust emission. We have discarded optically thick free-free emission from UC Hii regions and GPS sources as possible candidates for this excess; an upper limit at 94 GHz and high resolution radio data rule these out as the primary contributor at GHz. We interpret the excess as electric dipole radiation from small rapidly spinning dust grains as predicted by Draine & Lazarian (1998b). These models provide a reasonable fit to the data that is consistent both in terms of spectral shape and emissivity. High resolution, multi-frequency data in the range GHz are needed to confirm this result and to investigate the nature of anomalous emission.
References
- Altenhoff et al. (1970) Altenhoff, W. J., Downes, D., Goad, L., Maxwell, A., & Rinehart, R. 1970, A&AS, 1, 319
- Banday et al. (2003) Banday, A. J., Dickinson, C., Davies, R. D., Davis, R. J., & Górski, K. M. 2003, MNRAS, 345, 897
- Beichman et al. (1988) Beichman, C. A., Neugebauer, G., Habing, H. J., Clegg, P. E., & Chester, T. J., eds. 1988, Infrared astronomical satellite (IRAS) catalogs and atlases. Volume 1: Explanatory supplement, Vol. 1
- Bennett et al. (2003) Bennett, C. L., Hill, R. S., Hinshaw, G., Nolta, M. R., Odegard, N., Page, L., Spergel, D. N., Weiland, J. L., Wright, E. L., Halpern, M., Jarosik, N., Kogut, A., Limon, M., Meyer, S. S., Tucker, G. S., & Wollack, E. 2003, ApJS, 148, 97
- Bonaldi et al. (2007) Bonaldi, A., Ricciardi, S., Leach, S., Stivoli, F., Baccigalupi, C., & de Zotti, G. 2007, MNRAS, 382, 1791
- Casassus et al. (2006) Casassus, S., Cabrera, G. F., Förster, F., Pearson, T. J., Readhead, A. C. S., & Dickinson, C. 2006, ApJ, 639, 951
- Casassus et al. (2007) Casassus, S., Nyman, L.-Å., Dickinson, C., & Pearson, T. J. 2007, MNRAS, 382, 1607
- Casassus et al. (2004) Casassus, S., Readhead, A. C. S., Pearson, T. J., Nyman, L.-Å., Shepherd, M. C., & Bronfman, L. 2004, ApJ, 603, 599
- Condon et al. (1998) Condon, J. J., Cotton, W. D., Greisen, E. W., Yin, Q. F., Perley, R. A., Taylor, G. B., & Broderick, J. J. 1998, AJ, 115, 1693
- Davies et al. (2006) Davies, R. D., Dickinson, C., Banday, A. J., Jaffe, T. R., Górski, K. M., & Davis, R. J. 2006, MNRAS, 370, 1125
- de Oliveira-Costa et al. (2004) de Oliveira-Costa, A., Tegmark, M., Davies, R. D., Gutiérrez, C. M., Lasenby, A. N., Rebolo, R., & Watson, R. A. 2004, ApJ, 606, L89
- Dickinson et al. (2004) Dickinson, C., Battye, R. A., Carreira, P., Cleary, K., Davies, R. D., Davis, R. J., Genova-Santos, R., Grainge, K., Gutiérrez, C. M., Hafez, Y. A., Hobson, M. P., Jones, M. E., Kneissl, R., Lancaster, K., Lasenby, A., Leahy, J. P., Maisinger, K., Ödman, C., Pooley, G., Rajguru, N., Rebolo, R., Rubiño-Martin, J. A., Saunders, R. D. E., Savage, R. S., Scaife, A., Scott, P. F., Slosar, A., Sosa Molina, P., Taylor, A. C., Titterington, D., Waldram, E., Watson, R. A., & Wilkinson, A. 2004, MNRAS, 353, 732
- Dickinson et al. (2006) Dickinson, C., Casassus, S., Pineda, J. L., Pearson, T. J., Readhead, A. C. S., & Davies, R. D. 2006, ApJ, 643, L111
- Dickinson et al. (2007) Dickinson, C., Davies, R. D., Bronfman, L., Casassus, S., Davis, R. J., Pearson, T. J., Readhead, A. C. S., & Wilkinson, P. N. 2007, MNRAS, 379, 297
- Dickinson et al. (2003) Dickinson, C., Davies, R. D., & Davis, R. J. 2003, MNRAS, 341, 369
- Draine & Lazarian (1998a) Draine, B. T. & Lazarian, A. 1998a, ApJ, 494, L19+
- Draine & Lazarian (1998b) —. 1998b, ApJ, 508, 157
- Draine & Lazarian (1999) —. 1999, ApJ, 512, 740
- Dupac et al. (2003) Dupac, X., Bernard, J.-P., Boudet, N., Giard, M., Lamarre, J.-M., Mény, C., Pajot, F., Ristorcelli, I., Serra, G., Stepnik, B., & Torre, J.-P. 2003, A&A, 404, L11
- Fernández-Cerezo et al. (2006) Fernández-Cerezo, S., Gutiérrez, C. M., Rebolo, R., Watson, R. A., Hoyland, R. J., Hildebrandt, S. R., Rubiño-Martín, J. A., Macías-Pérez, J. F., & Sosa Molina, P. 2006, MNRAS, 370, 15
- Finkbeiner (2004) Finkbeiner, D. P. 2004, ApJ, 614, 186
- Finkbeiner et al. (2004) Finkbeiner, D. P., Langston, G. I., & Minter, A. H. 2004, ApJ, 617, 350
- Forbes (1989) Forbes, D. 1989, A&AS, 77, 439
- Gordon (1988) Gordon, M. A. 1988, ApJ, 331, 509
- Handa et al. (1987) Handa, T., Sofue, Y., Nakai, N., Hirabayashi, H., & Inoue, M. 1987, PASJ, 39, 709
- Haynes et al. (1978) Haynes, R. F., Caswell, J. L., & Simons, L. W. J. 1978, Australian Journal of Physics Astrophysical Supplement, 45, 1
- Hildebrandt et al. (2007) Hildebrandt, S. R., Rebolo, R., Rubiño-Martín, J. A., Watson, R. A., Gutiérrez, C. M., Hoyland, R. J., & Battistelli, E. S. 2007, MNRAS, 382, 594
- Hill et al. (2008) Hill, R. S., Weiland, J. L., Odegard, N., Wollack, E., Hinshaw, G., Larson, D., Bennett, C. L., Halpern, M., Page, L., Dunkley, J., Gold, B., Jarosik, N., Kogut, A., Limon, M., Nolta, M. R., Spergel, D. N., Tucker, G. S., & Wright, E. L. 2008, ArXiv e-prints, 803
- Hinshaw et al. (2008) Hinshaw, G., Weiland, J. L., Hill, R. S., Odegard, N., Larson, D., Bennett, C. L., Dunkley, J., Gold, B., Greason, M. R., Jarosik, N., Komatsu, E., Nolta, M. R., Page, L., Spergel, D. N., Wollack, E., Halpern, M., Kogut, A., Limon, M., Meyer, S. S., Tucker, G. S., & Wright, E. L. 2008, ArXiv e-prints, 803
- Langston et al. (2000) Langston, G., Minter, A., D’Addario, L., Eberhardt, K., Koski, K., & Zuber, J. 2000, AJ, 119, 2801
- Leitch et al. (1997) Leitch, E. M., Readhead, A. C. S., Pearson, T. J., & Myers, S. T. 1997, ApJ, 486, L23+
- Padin et al. (2002) Padin, S., Shepherd, M. C., Cartwright, J. K., Keeney, R. G., Mason, B. S., Pearson, T. J., Readhead, A. C. S., Schaal, W. A., Sievers, J., Udomprasert, P. S., Yamasaki, J. K., Holzapfel, W. L., Carlstrom, J. E., Joy, M., Myers, S. T., & Otarola, A. 2002, PASP, 114, 83
- Readhead et al. (2004) Readhead, A. C. S., Mason, B. S., Contaldi, C. R., Pearson, T. J., Bond, J. R., Myers, S. T., Padin, S., Sievers, J. L., Cartwright, J. K., Shepherd, M. C., Pogosyan, D., Prunet, S., Altamirano, P., Bustos, R., Bronfman, L., Casassus, S., Holzapfel, W. L., May, J., Pen, U.-L., Torres, S., & Udomprasert, P. S. 2004, ApJ, 609, 498
- Reich et al. (1990) Reich, W., Fuerst, E., Reich, P., & Reif, K. 1990, A&AS, 85, 633
- Rodgers et al. (1960) Rodgers, A. W., Campbell, C. T., & Whiteoak, J. B. 1960, MNRAS, 121, 103
- Rybicki & Lightman (1979) Rybicki, G. B. & Lightman, A. P. 1979, Radiative processes in astrophysics (New York, Wiley-Interscience, 1979. 393 p.)
- Scaife et al. (2007) Scaife, A., Green, D. A., Battye, R. A., Davies, R. D., Davis, R. J., Dickinson, C., Franzen, T., Génova-Santos, R., Grainge, K., Hafez, Y. A., Hobson, M. P., Lasenby, A., Pooley, G. G., Rajguru, N., Rebolo, R., Rubiño-Martin, J. A., Saunders, R. D. E., Scott, P. F., Titterington, D., Waldram, E., & Watson, R. A. 2007, MNRAS, 377, L69
- Scaife et al. (2008) Scaife, A. M. M., Hurley-Walker, N., Davies, M. L., Duffett-Smith, P. J., Feroz, F., Grainge, K. J. B., Green, D. A., Hobson, M. P., Kaneko, T., Lasenby, A. N., Pooley, G. G., Saunders, R. D. E., Scott, P. F., Titterington, D. J., Waldram, E. M., & Zwart, J. 2008, MNRAS, 385, 809
- Sharpless (1959) Sharpless, S. 1959, ApJS, 4, 257
- Watson et al. (2003) Watson, R. A., Carreira, P., Cleary, K., Davies, R. D., Davis, R. J., Dickinson, C., Grainge, K., Gutiérrez, C. M., Hobson, M. P., Jones, M. E., Kneissl, R., Lasenby, A., Maisinger, K., Pooley, G. G., Rebolo, R., Rubiño-Martin, J. A., Rusholme, B., Saunders, R. D. E., Savage, R., Scott, P. F., Slosar, A., Sosa Molina, P. J., Taylor, A. C., Titterington, D., Waldram, E., & Wilkinson, A. 2003, MNRAS, 341, 1057
- Watson et al. (2005) Watson, R. A., Rebolo, R., Rubiño-Martín, J. A., Hildebrandt, S., Gutiérrez, C. M., Fernández-Cerezo, S., Hoyland, R. J., & Battistelli, E. S. 2005, ApJ, 624, L89
- Wood & Churchwell (1989) Wood, D. O. S. & Churchwell, E. 1989, ApJS, 69, 831

| Frequency | Telescope/ | Angular resolution | Reference | Flux density | Flux density |
| (GHz) | survey | (arcmin) | for data | RCW175 (Jy) | G29.0-0.6 (Jy) |
| 1.4 | Green Bank 300 ft | Altenhoff et al. (1970) | Not resolved | ||
| 2.7 | Effelsberg 100 m | 4.3 | Reich et al. (1990) | ||
| 5 | Parkes 64 m | 4.1 | Haynes et al. (1978) | ||
| 8.35 | Green Bank 13.7 m | 9.7 | Langston et al. (2000) | Not resolved | |
| 10 | Nobeyama 45 m | 3 | Handa et al. (1987) | Not reported | |
| 14.35 | Green Bank 13.7 m | 6.6 | Langston et al. (2000) | Not resolved | |
| 31 | CBI | This work | |||
| 33 | VSA | Todorovic et al. (in prep.) | Not resolved | ||
| 94 | WMAP | Hinshaw et al. (2008) | |||
| 2997 (m) | IRAS | Beichman et al. (1988) | |||
| 4995 (m) | IRAS | Beichman et al. (1988) | |||
| 12875 (m) | Spitzer MIPSGAL | http://irsa.ipac.caltech.edu/ | Not fitted | Not fitted |