A GLIMPSE into the Nature of Galactic Mid-IR Excesses
Abstract
We investigate the nature of the mid-IR excess for 31 intermediate-mass stars that exhibit an 8 m excess in either the Galactic Legacy Infrared Mid-Plane Survey Extraordinaire or the Mid-Course Space Experiment using high resolution optical spectra to identify stars surrounded by warm circumstellar dust. From these data we determine projected stellar rotational velocities and estimate stellar effective temperatures for the sample. We estimate stellar ages from these temperatures, parallactic distances, and evolutionary models. Using MIPS [24] measurements and stellar parameters we determine the nature of the infrared excess for 19 GLIMPSE stars. We find that 15 stars exhibit H emission and four exhibit H absorption. Assuming that the mid-IR excesses arise in circumstellar disks, we use the H fluxes to model and estimate the relative contributions of dust and free-free emission. Six stars exhibit H fluxes that imply free-free emission can plausibly explain the infrared excess at [24]. These stars are candidate classical Be stars. Nine stars exhibit H emission, but their H fluxes are insufficient to explain the infrared excesses at [24], suggesting the presence of a circumstellar dust component. After the removal of the free-free component in these sources, we determine probable disk dust temperatures of T300–800 K and fractional infrared luminosities of 10-3. These nine stars may be pre-main-sequence stars with transitional disks undergoing disk clearing. Three of the four sources showing H absorption exhibit circumstellar disk temperatures 300–400 K, 10-3, IR colors -[24] 3.3, and are warm debris disk candidates. One of the four H absorption sources has -[24] 3.3 implying an optically thick outer disk and is a transition disk candidate.
1 Introduction
With its launch in 1983, the Infrared Astronomical Satellite () opened up a new wavelength window and enabled identification of many classes of stellar sources with circumstellar material, providing new insights into star formation and evolution. In one of the most exciting discoveries enabled by , Aumann et al. (1984) reported the first detection of an infrared excess owing to dust in the Vega system, and this excess was later explained as a debris disk. To date, many debris disks have been found with IRAS, the Infrared Space Observatory (ISO), and the Spitzer Space Telescope (Spitzer) (Backman & Paresce 1993; Spangler et al. 2001; Meyer et al. 2004). Most known debris disks show evidence of cool dust at wavelengths 20 m, and the majority of these surround intermediate-mass stars (Backman & Paresce 1993; Chen et al. 2006; Hillenbrand et al. 2008). Only two Point Source Catalog debris disk sources, the intermediate-mass A-type stars Pictoris and Leporis, exhibited a mid-IR ( 12 m) excess detectable by (Aumann & Probst 1991). observations of -discovered debris disks indicate that most are devoid of warm dust and small particles (sizes 10 m) (Chen et al. 2006). The rarity of mid-IR excess sources may imply that dust particles emitting at terrestrial temperatures are uncommon around main-sequence stars.
Advances in infrared technologies coupled with large-aperture ground-based telescopes and mid-IR sensitivity with IRAC enable new searches for warm/hot circumstellar dust that did not detect. Even with such improvements in sensitivity over , only five known intermediate-mass stars (HD 3003, HD 38678, HD 75416, HD 105234, and HD 181296) are surrounded by debris disks with temperatures analogous to our asteroid belt ( 200 K) (Chen & Jura 2001; Rhee et al. 2007 and references therein). observations have also revealed a number of mid-IR excess objects that are primordial disks undergoing disk clearing processes similar to the solar-mass star TW Hya (Calvet et al. 2005; Furlan et al. 2007). “Transition disks” may be evolved protoplanetary disks with inner holes caused by clearing of the initial gas-dominated disks from the inside out (Strom et al. 1989). These disks would be optically thin at near- and mid-IR wavelengths and optically thick in the far-IR. These sources would show weak to no accretion signatures (Sicilia-Aguilar et al. 2006b). Intermediate-mass candidate transition disks have only recently been discovered (Hernández et al. 2006; Sicilia-Aguilar et al. 2006a; Hernandez et al. 2007). Such transition disks are especially interesting as possible evolutionary links between the optically thick Herbig AeBe disk systems and the older optically thin debris disk systems.
In Uzpen et al. (2005, 2007) we exploited this new mid-IR capability and used to identify stars with 8 m infrared excesses. In Uzpen et al. (2007), we identified 230 stars that exhibited 8 m mid-IR excesses out of 4,015 stars investigated in the Spitzer Galactic Legacy Infrared MidPlane Survey Extraordinaire (GLIMPSE; Benjamin et al. 2003) and MidCourse Space Experiment (MSX; Egan et al. 2003) catalogs. Out of the 230 stars with 8 m excesses, 183 are of spectral types O or early B. The excess for these stars is plausibly explained by free-free emission. Out of the 47 remaining stars of spectral types B8 or later, five stars were shown to be false excess sources, and three sources were not yet confirmed at 24 m (Uzpen et al. 2007). In systems with mid-IR excesses we modeled the 8 and 24 m excesses as simple blackbodies to characterize the color temperature and fractional infrared luminosity of the circumstellar disk. The results were consistent with massive debris disks and/or transitional disks with disk temperatures ranging between 200–800 K and fractional infrared luminosities () 10-4–10-2. However, infrared photometry alone is not sufficient to unambiguously determine the nature of the extraphotospheric emission in these sources. Because of their scarcity, identifying new transition disks and warm debris disks is an important step toward understanding the evolutionary path of circumstellar disks.
The nature of the mid-IR excesses emanating from circumstellar disks around intermediate-mass stars (2–8 ) varies greatly and partially depends on age (Zuckerman 2001). Young stars form circumstellar disks through the collapse of the initial molecular cloud as a method to conserve angular momentum (Shu et al. 1987). Intermediate-mass pre-main-sequence Herbig AeBe stars accrete gaseous material via their circumstellar disks as they evolve towards main-sequence stars (Herbig 1960; Waters & Waelkens 1998). Circumstellar dust disks, presumably due to planetesimal collisions, surround some main-sequence stars (Backman & Paresce 1993; Lagrange et al. 2000). Circumstellar gaseous disks that emit excesses owing to free-free emission surround other main-sequence stars during late main-sequence or post-main-sequence evolution and are known as classical Be stars (Struve 1931; Porter & Rivinius 2003; McSwain & Gies 2005). Circumstellar disks can surround evolved giants as well (e.g., Jura 1999; Verhoelst et al. 2007; Deroo et al. 2007). By understanding the nature of the circumstellar disks, we can better understand how these disks evolve.
The two most common stellar contaminants in surveys for stars with debris disks are Herbig AeBe stars and classical Be stars. Herbig AeBe stars are young stars accreting circumstellar material via their disks (Strom 1972; Hillenbrand et al. 1992; Hartmann et al. 1993). Emission lines and near-infrared excesses evidence this accretion (Hillenbrand et al. 1992). Waters & Waelkens (1998) suggest the following as criteria for Herbig AeBe stars: (1) an emission-line A or B star, (2) an infrared excess owing to circumstellar dust, either hot or cool, and (3) luminosity class III–V. As the primordial disk dissipates the emission lines weaken and the infrared excess decreases, appearing only at longer wavelengths (e.g., The et al. 1994). Classical Be stars are typically rapidly rotating B stars with H emission and an IR excess from free-free emission (Gehrz et al. 1974; Balona 2000). These stars are variable in both emission-line strength and luminosity (Dachs et al. 1988). The circumstellar disks for classical Be stars are thought to be mechanisms for mass loss, unlike Herbig AeBe circumstellar disks which facilitate accretion (Balona 2000). Classical Be stars are similar to Herbig AeBe stars in that they both exhibit emission lines due to circumstellar gas (Struve 1931; Herbig 1960). The greatest distinction between Herbig AeBe stars and classical Be stars is the nature of the infrared excess—dust in the former and thermal bremsstrahlung in the latter.
In this paper we present results of optical spectroscopic analysis for 30 mid-IR excess sources identified in the Spitzer GLIMPSE and catalogs to determine the nature of infrared excess (Uzpen et al. 2007). By investigating the nature of the infrared excess through optical spectral features, we can distinguish between various types of circumstellar disks that persist around intermediate-mass stars. Our goal is to remove classical Be and Herbig AeBe stars from our sample to identify transition and warm debris disk candidates. In §2 we describe how we obtained new optical echelle spectroscopy. We discuss the results of our rotational velocity analysis in §3. In §4 we present our methods for determining effective temperatures. In §5 we discuss the spectra including the H, Fe II 5317 Å, Paschen, O I, and Ca II IR triplet line profiles and any implications on the nature of the disk from the lines. We describe how we estimate stellar ages through main-sequence fitting utilizing our determined fundamental parameters in §6. In §7 we discuss how all of the derived parameters provide insight into the nature of the infrared excess, how we use these parameters to estimate the contribution of free-free emission associated with our sources, and how we draw conclusions regarding the evolutionary state of the circumstellar disk. In §8 we describe the individual sources and classify the infrared excesses. Finally we use spectral classification schemes for stars with infrared excesses, such as classical Be stars, with our stars to determine if the classifications are consistent in §9. We also apply our classification schemes to well-known stellar samples to determine their classification in §9.
2 Target Selection and Observations
We observed 30 of 42 stellar sources that exhibited an 8 m mid-IR excess in Uzpen et al. (2007), 25 of which have an excess at 8 and 20+ m. The purpose of these observations was to identify circumstellar disk characteristics (e.g., Balmer emission, metallic emission, forbidden-line emission), and stellar classification features (e.g, He I, and Mg II absorption) based on optical spectral features to determine stellar and circumstellar properties. We chose stars with both known and unknown circumstellar evolutionary state.
We conducted high-resolution, high-signal-to-noise ratio spectroscopic observations at the Magellan Telescope with the Magellan Inamori Kyocera Echelle (MIKE; Bernstein et al. 2003) double echelle spectrograph on the nights of 26–28 September 2006 and 7–8 April 2007. The spectral coverage was 3400–9500 Å with a resolving power of R=37,000 at 4000 Å and R=29,000 at 6500 Å measured from arc spectra. The typical S/N was 100:1 in the stellar continuum. We conducted standard data reductions in IRAF including flat fielding with a continuum lamp and wavelength calibration using a ThAr arc lamp, but no flux calibration was applied.
We also observed 13 stars to use as rotational velocity standards listed below the solid horizontal line in Table 1. These stars were used to validate our technique and compare our determined values to those in the literature. Seven of these stars had projected rotational velocities determined in Royer et al. (2002a). Ten of these stars had projected rotational velocities determined in Slettebak et al. (1975). Four stars had their rotational velocities determined in both papers and provide a direct comparison between the two techniques. We will discuss these stars further in §3.
3 Rotational Velocities
The most common methods for measuring the projected rotational velocities are through the computation of the first zero of a Fourier Transform of a given line profile (Carroll 1933; Gray 1992; Royer 2005) or through the measurement of a line full width half maximum (FWHM) (Slettebak et al. 1975). The FWHM of He I 4471 Å, Mg II 4481 Å, and Fe I 4476 Å are shown to correlate with v sin i in Slettebak et al. (1975) and is the method we adopt to measure projected rotational velocity. However, this method is less reliable at lower rotational velocities because of the non-linearity of the FWHM/projected rotational velocity relationship, and the calibration of Slettebak et al. (1975) has been shown to be 10–12 lower than measurements made using the Fourier Transform (Royer et al. 2002a). In order to improve upon existing linear relations between He I 4471 Å, Mg II 4481 Å, and Fe I 4476 Å we measure the FWHM of the rotationally broadened stellar models of Munari et al. (2005) of solar metallicity at a resolving power of R=20,000 from 21,000–7,500 K.
Figure 1 shows the relationships between projected rotational velocity and the FWHM measured over a range of stellar temperatures by the author B.U. of He I 4471 Å (upper left), Mg II 4481 Å (upper right), and Fe I 4476 Å (lower left). The He I 4471 Å line profile includes a Stark broadening component. Since Stark broadening has a non-linear dependence on temperature this component degraded the repeatability of consistent measurements that caused a greater dispersion in the FWHM measurement. We derived the following equations for a linear least squares fit between the measured stellar absorption line FWHM and the projected rotational velocity:
| (1) |
| (2) |
| (3) |
The Mg FWHM relation is not linear below 40 km s-1 due to resolution of the line multiplets or above 300 km s-1 due to blends with the He I 4471 Å line, while the Fe FWHM relation is linear at velocities 10 km s-1.
Table 1 lists the v sin i measurements of our target stars and rotational velocity standards and compares them with values listed in the literature, when available. Figure 1(lower right) shows a comparison between our measurements and literature rotational values from Slettebak et al. (1975) and Royer et al. (2002a, b). Our values are consistent with those derived from Royer et al. (2002a, b) and are 10–15% higher than those of Slettebak et al. (1975). This offset compared to Slettebak et al. (1975) is consistent with results from other projected rotational velocity studies. We estimate our uncertainties in projected rotational velocity at 10, given in Table 1, using the FWHM method based on both the dispersion of the models from the best-fit line and measurement uncertainties in the FWHM. When two rotational velocity indicators are present, the reported rotational velocity is the weighted mean of both measurements, and the uncertainty is the uncertainty of the mean.
4 Surface Temperatures
We determined effective temperatures by comparing model equivalent width (EW) measurements of He I 4009 Å, He I 4471 Å, Mg II 4481 Å, Fe II 4233 Å, and Ca I 4227 Å of Munari et al. (2005) R=20,000 solar metallicity models to our spectral measurements. For our spectra we used the models in the range 7,000 K Teff 21,000 K, with log g=4.5 for Teff 10,000 K, and log g=4.0 for Teff 10,000 K. We used models with rotational broadening between 0 km s-1 and 400 km s-1. The effective temperature step size varies from Teff=1000 K for 12,000 K Teff 21,000 K, Teff=500 K for 10,000 K Teff 12,000 K and Teff=250 K for 7,000 K Teff 10,000 K.
The equivalent width ratios of Mg II 4481 Å/He I 4009 Å, Mg II 4481 Å/He I 4471 Å, Mg II 4481 Å/Fe II 4233 Å, and Mg II 4481 Å/Ca I 4227 Å form monotonic relations dependent on both rotational velocity and temperature spanning T=21,000–7,000 K, as shown in Figure 2. The solid curves in Figure 2 are polynomials representing the best-fit relation between the EW ratio and stellar effective temperature for the models with projected rotational velocity of 150 km s-1. The multiple data points at each abscissa/ordinate are due to multiple measurements of the same model and show the magnitude of the random uncertainties associated with measuring the EW. The dotted curve in Figure 2 (lower left panel) represents the best fit polynomial between the EW ratio of Mg II 4481 Å/Fe II 4233 Å for models with rotational velocity of 250 km s-1 (triangles). We chose Mg and He because these lines are prominent in B and early A stars, and He strength decreases rapidly in late B stars. Fe lines start to appear in early A stars and increase in strength toward later spectral types. Ca lines increase in strength and number starting at late A stars and continuing through F stars. At rotational velocities 150 km s-1 the Mg II 4481 Å/He I 4009 Å and Mg II 4481 Å/He I 4471 Å ratios are independent of rotational velocity and thus provide the best estimates of Teff. At rotational velocities 150 km s-1 the Mg II 4481 Å/Ca I 4227 Å ratios are independent of rotational velocity and provide the best estimates of Teff. The Mg II 4481 Å/Fe II 4233 Å relationship depends upon rotational velocity over all velocity ranges, unlike the other EW ratios. Therefore, this ratio is not generally as sensitive to effective temperature, but we use it over a limited temperature range, 10,000–12,000 K, where other lines ratios are not useful.
We determined the effective temperature utilizing one or more equivalent width ratios in Figure 2 for our target stars and present them in Table 2, along with spectral types from the literature. The uncertainties on effective temperatures were determined by adding in quadrature the uncertainty derived from equivalent width fitting with one-half the model step size. The former uncertainty component approximately accounts for the random uncertainty in measuring the equivalent width, which is dominated by the uncertainty in the definition of the stellar continuum. In general, most derived effective temperature measurements are consistent with the stellar spectral classification, within uncertainties.
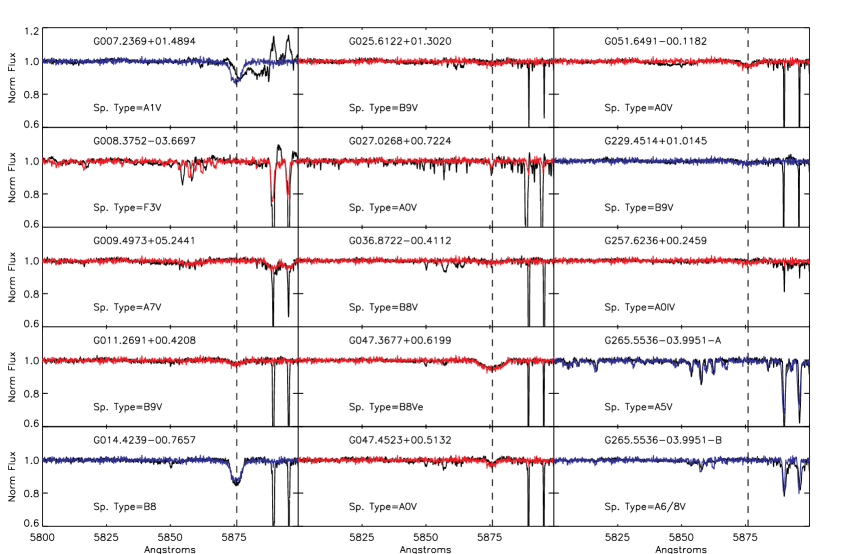
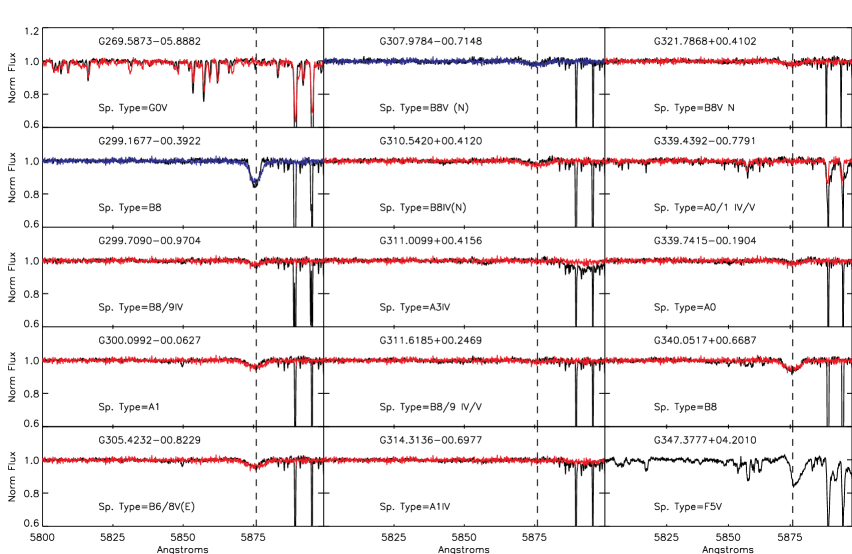
We found several late B stars to have effective temperatures hotter than their spectral classifications would indicate. Such an effect might result if, for example, some stars were deficient in heavy metals, resulting in smaller metal-to-helium EW ratios in Figure 2 and systematically higher indicated effective temperatures. In order validate the derived temperatures and test whether this approach is sensitive to our assumption of solar metallicity, we compare in Figures 3 and 4 our spectra with the Munari et al. (2005) stellar models, degraded to similar signal-to-noise ratios, in the region near He I 5876 Å. Figures 3 and 4 show the spectral region near He I 5876 Å (denoted by the dashed vertical line) with the best fitting stellar model over-plotted in either red or blue. The narrow strong lines to the right of He I 5876 Å are the Na I 5890/5896 Å doublet, generally of interstellar origin except in the later type stars which have an atmospheric component. Red curves (24 out of 30 stars) show the best fit stellar model and indicate that the temperature measured from EW ratios fell within one model temperature step size from the best fit model. Blue curves (6 out of 30 stars) show the best fit stellar temperature model and indicate that the model deviated by more than one model temperature step size from the temperature determined from EW ratios. For G014.4239-00.7657 the best fit stellar model was Teff=18,000 K as it is for G299.1677-00.3922 and G007.2369+01.4894. G014.4239-00.7657 and G299.1677-00.3922 have the hottest measured Teff and our relationship for Mg II 4481 Å/He I 4471 Å is not very sensitive in this temperature regime. For both stars the Mg II 4481 Å/He I 4471 Å derived temperature is 600 K lower than Mg II 4481 Å/He I 4009 Å ratio pushing the weighted mean to a lower temperature. If we ignore the Mg II 4481 Å/He I 4471 Å temperature, the Mg II 4481 Å/He I 4009 Å temperature, with uncertainties, falls between the 17,000 and 18,000 K models, as is found from the best fit models. For the remainder of this paper we will use Teff=16,900800 K for G014.4239-00.7657 and Teff=16,4501030 K for G299.1677-00.0392. G007.2369+01.4894 is a known Herbig AeBe star, see §8 for more details. The Na I D lines in emission and strong broad He I 5876 Å absorption are indicators of circumstellar gas. This star exhibits line profile variations consistent with circumstellar activity (Catala et al. 1989; Pogodin 1994). The variable lines and circumstellar gas explain the discrepancy between temperatures measured from the He I 5876 Å line fitting and EW ratios. G229.4514+01.0145 exhibits stronger He I 5876 Å absorption than the Mg II 4481 Å/He I 4471 Å ratio temperature of Teff=10,220390 K implies. This is a suspected Herbig AeBe star, see §8, and, like G007.2369+01.4894, it is better fit with a hotter model, Teff=12,000 K. G265.5536-03.9951-A and B are binaries and their interactions may effect their spectra. For G265.5536-03.9951-A we found a better fit with a cooler model of 6,500 K rather than the measured Teff of 7,040170 K, while G265.5536-03.9951-B is better fit with a hotter model of 8,250 K rather than the measured Teff of 7,660140 K. G307.9784-00.7148 was also better fit with a cooler stellar model, Teff=12,000 K rather than the EW ratio measured Teff=13,220520 K. With the exception of the probable pre-main-sequence stars, the best fit models all lie within two stellar models of the measured temperatures based on EW ratios. The sources with discrepant model fit temperatures and EW ratio measured temperatures may show indication of circumstellar gas, see §5. In summary, the six stars that show small discrepancies between temperatures derived from He 5876 Å fits and EW ratios are explainable in most cases by circumstellar material and activity rather than metallicity enhancements or deficiencies.
The discrepancy between literature spectral types and derived temperature for some objects in Table 2 may be in part due to differences between observational parameters and theoretical stellar models. For example, under the MK system, the definition of a B8 main-sequence star requires the He I 4471 Å EW to be equal to the Mg II 4481 Å EW. Using this MK system definition of a B8 main-sequence star and Munari et al. (2005) models we derive a temperature of 12,600 K through interpolation of the model grids. However, the observational effective temperature for a B8 main-sequence star is 11,400 K (Cox 2000). We do not present revised spectral types for the late B stars in Table 2 due to the small systematic temperature difference between optical classification criteria and theoretical models.
5 Spectral Features
Metallic and hydrogen emission lines in the spectra of both classical Be and Herbig AeBe stars have been well studied (e.g., Finkenzeller & Mundt 1984; Andrillat et al. 1990). For example, the lines of He I 5876 Å , Na I D, H, Fe II, O I, and Ca II IR triplet have been studied as indicators of circumstellar material around Herbig AeBe stars (Finkenzeller & Mundt 1984; Hamann & Persson 1992; Boehm & Catala 1995; Hernández et al. 2004). The spectra of classical Be stars exhibit, in addition to hydrogen emission, Ca II IR triplet, O I 8446 and O I 7772 Å, and Fe II in emission (Andrillat et al. 1990; Jaschek et al. 1993; Hanuschik et al. 1996). By comparing line strengths with stellar models it is possible to identify emission and absorption lines arising in circumstellar material and identify the type of circumstellar disk.
5.1 Hydrogen Lines
5.1.1 Balmer Lines
The nature of an infrared excess can, in part, be determined through H spectroscopy. By definition, classical Be stars and Herbig AeBe stars exhibit Balmer emission lines owing to their circumstellar gaseous disk. In contrast, debris disks do not exhibit any Balmer emission lines and are devoid of significant amounts of circumstellar gas (Lagrange et al. 2000). We measured the H equivalent width for our targets and noted the five H profile types in Table 3. These profile types include single-peaked emission profiles (S), double-peaked emission profiles (D), absorption profiles (A), P-Cygni emission profiles (P), and inverse P-Cygni emission profiles (IP). For complex profiles, double-peaked emission, or P-Cygni features, we fit multiple Gaussian profiles to the H feature and report the sum of the EWs in Table 3. We performed the fitting process manually five times, and we adopt the rms dispersion of the summed EWs as our estimate of the 1 uncertainty on EW(H). We then utilized Munari et al. (2005) stellar model H absorption measurements to correct the H equivalent width for underlying absorption in order to estimate the true EW of the emission. This measure, EW(Hcorr), is then used for the remainder of this paper. Normalized H spectra are shown in Figures 5 & 6. One-third of the sample, ten stars, exhibit H absorption profiles. Of the remaining twenty stars that exhibit H emission, only one star exhibits single-peaked emission, one star exhibits inverse P-Cygni, and one star exhibits P-Cygni profiles. The majority of the stars that exhibit Balmer emission show a double-peaked emission profile (17 stars). This result is not surprising given that the majority of both classical Be and Herbig AeBe stars exhibit double-peaked H profiles (Porter & Rivinius 2003; Finkenzeller & Mundt 1984).
5.1.2 Paschen Lines
Both early- and late-type classical Be stars exhibit Paschen lines in emission with the later type only exhibiting weak emission not reaching the continuum (Andrillat et al. 1990). Herbig AeBe stars have been found to exhibit Paschen emission, although the Paschen lines are significantly weaker than the metallic Fe and Ca emission lines in the red spectral region (Catala et al. 1986). Figures 7 and 8 shows spectral regions 8400–8600 Å and Paschen lines Pa15–19. Lower order Paschen lines either lie off our spectral coverage or fall in regions of poor atmospheric transparency. Very few stars exhibit Paschen emission: G027.0268+00.7224, G299.1677-00.3992, G321.7686+00.4102, and G340.0517+00.6687. Table 4 lists the spectral features used for confirmation of circumstellar gas and determination of the nature of the circumstellar disk. Paschen emission is listed as column 3 in Table 4. For classical Be stars, emission from metallic lines of Fe II, O I 8446, O I 7772 Å and Ca II is found only when the Paschen lines are in emission (Andrillat et al. 1990; Jaschek et al. 1993). Herbig AeBe stars may exhibit O I, Fe II, and Ca II emission with or without Paschen emission (Catala et al. 1986).
5.2 Metallic Lines
5.2.1 Ca II IR Triplet
For classical Be stars, Andrillat et al. (1990) found that Ca II is only seen in emission if Paschen lines were seen in emission. Jaschek et al. (1988) found that Ca II emission was observed in those stars that exhibited a large excess, 0.6 magnitudes at 12 m. For Herbig AeBe stars, the Ca II IR triplet is shown to correlate with the H emission strength (Catala et al. 1986). Only three of our sources exhibited Ca II IR triplet emission, G007.2369+01.4894, G027.0268+00.7224, and G229.4514+01.0145, and their spectra are shown in Figure 9. The best fitting EW ratio determined stellar model is shown beneath the stellar spectrum. G007.2368+01.4894 was also shown to exhibit Ca II emission in Hamann & Persson (1992), and their profile appears similar to our spectrum. G229.4514+01.0145 and G027.0268+00.7224 show double peaked Ca II emission. These two stars also exhibit double peaked H emission. We also find that Ca II emission strength is correlated with H emission strength, but our sample is not large, containing only three sources. Therefore, we do not further investigate this correlation.
5.2.2 O I 8446 Å Emission and O I 7772 Å Absorption
O I 8446 Å emission is seen in both Herbig AeBe stars and classical Be stars. The O I excitation is due to O I 1025 Å fluorescence with Lyman that subsequently excites the related O I 8446 Å (Bowen 1947). Andrillat et al. (1990) found that classical Be stars only exhibit O I 8446 Å emission if Paschen emission is also present. Jaschek et al. (1993) found a correlation between O I 8446 Å emission and O I 7772 Å emission with the former about four times stronger than the later. Jaschek et al. (1993) also found that Be stars which exhibit both O I 7772 Å in emission also exhibit Fe II 7712 Å in emission. Hamann & Persson (1992) found that some Herbig AeBe stars exhibit anomalously large O I 7772 Å absorption and attribute it to a large circumstellar envelope. O I 7772 Å has also been seen in emission for some Herbig AeBe stars (e.g., Hamann & Persson 1992). Column five of Table 4 lists whether O I 8446 Å is found in emission. Column six of Table 4 indicates whether O I 7772 Å is found in absorption stronger than stellar models predict (s) or in emission (e).
5.2.3 Fe II Emission
Classical Be stars exhibit metallic lines in emission, especially Fe II (Jaschek et al. 1980; Hanuschik et al. 1996). Presence or absence of Fe II is one criterion for classification of classical Be stars into subgroups (Jaschek et al. 1980). We show continuum-normalized spectra near Fe II 5317 Å in Figures 10 and 11. Only four sources exhibit Fe II in emission: G027.0268+00.7224 (A0V), G229.4514+01.0145 (B9V), G321.7868+00.4102 (B8VN), and G340.0517+00.6682 (B8). Jaschek et al. (1980) Group I sources, stars with Fe II emission, are of spectral type B0–B6. These four stars may be an extension to later spectral types for Group I classical Be stars. Herbig AeBe stars have also been shown to exhibit Fe I and Fe II emission, but the EW of H for such sources show strong emission, EW(H) -25 Å (Hernández et al. 2004). G340.0517+00.6682 and G321.7868+00.4102 are the only two of the four sources to exhibit strong H emission, EW(H)=-39.38 and -26.81 Å and Fe II emission.
5.2.4 Broad Absorption
Herbig AeBe stars have been shown to exhibit absorption lines such as He I 5876 Å and O I 7772 Å that are stronger and broader than expected from the stellar photosphere (Catala et al. 1986). G007.2369+01.4894 exhibits strong He I 5876 Å as noted in §3 and seen in the top left panel of Figure 3. G229.4514+01.0145 may also exhibit strong He I 5876 Å circumstellar absorption as indicated by the higher temperature stellar model needed to fit the line than measured by He I and Mg II EW ratios (see §3). Several stars exhibit strong broad absorption features at 4400, 4418, and 4455 Å. These lines do not appear to correspond with known diffuse interstellar bands (DIBs) or expected photospheric atomic absorption transitions (Jenniskens & Desert 1994). The stars that exhibit broad non-stellar absorption lines at these wavelengths are G007.2369+01.4894, G025.6122+01.3020, G051.6491-00.1182, and G229.4514+01.0145. These absorption lines may imply that G025.6122+01.3020 and G051.6491-00.1182 are surrounded by circumstellar gaseous material similar to the material surrounding Herbig AeBe stars. We will discuss the implications of the stellar absorption/emission lines in context of the nature of the infrared excess in §8.
6 Age Determination
When stars are not members of known stellar clusters with well-determined ages, stellar ages are generally estimated by fitting theoretical isochrones to effective temperatures and bolometric luminosities, provided that some distance estimate is available (Song et al. 2001). Using our derived Teff and trigonometric parallaxes from /Tycho, we estimated stellar ages by fitting stellar parameters to Siess et al. (2000) evolutionary model tracks. parallaxes were the preferred distance measures and used when available (11 stars). In only one instance we used a Tycho parallax. If neither parallax was available, we adopted absolute visual magnitudes derived in the literature (4 stars) using methods such as H luminosity and intrinsic Stromgren colors of luminosity classes (see Seidensticker 1989; Westin 1985; Kozok 1985). We list parallactic distances in Table 5 except in the cases where noted. We then interpolated a bolometric correction using our derived effective temperatures in conjunction with Cox (2000) effective temperatures and bolometric corrections. We applied these bolometric corrections to the Tycho-2 visual magnitudes and correct for distance and extinction to derive the absolute bolometric magnitudes.
Figure 12 shows our derived absolute bolometric magnitudes and effective temperatures (i.e., the HR diagram) with isochrones derived from Siess et al. (2000) Z=0.02 stellar evolutionary models over-plotted. Figure 12 shows the range of stellar temperatures consistent with 2–5 stars. Stars with absolute bolometric magnitudes determined from parallaxes are denoted by the diamonds, those with bolometric magnitudes determined from Tycho parallaxes are shown by triangles, and those for which literature absolute magnitudes were used are shown by asterisks. The zero-age main-sequence is shown by the solid line. Isochrones for 1, 10, and 100 Myr are shown by the dotted, dashed, and dash-dot relations. The majority of our stars are consistent with 3–5 stellar models. Most of our stars lie above the main-sequence indicating either a late pre-main-sequence (few Myr) or late main-sequence stellar age ( 100 Myr). We estimate a range of possible stellar ages by taking the full range of Siess et al. (2000) model ages consistent with the derived temperatures and luminosities, taking into account the measurement uncertainties. Table 5 lists the possible age ranges for the stars with sufficient measurements and compares them to other results in the literature. The age ranges we determined for the three stars having published age estimates were consistent with those measurements. We were able to determine the age ranges of two stars identified in literature as pre-main-sequence stars and found that the ages were consistent with such a state. Most published measurements of stellar ages have uncertainties of order a few of the stellar lifetime because they are either nearby (small uncertainties in luminosity) or derived from main-sequence cluster fitting. Our age measurements typically have errors of 10 or greater, so the derived values should be regarded as general age ranges.
7 Implication of Fundamental Parameters on the Nature of the Mid-IR Excesses
Stellar parameters, such as rapid rotation and H emission can provide insight into the nature of the infrared excess. On average, classical Be stars rotate more rapidly than Herbig AeBe stars. H emission can be used to determine the amount of free-free emission expected from the circumstellar disk. H emission is also found to decrease as pre-main-sequence stars evolve toward the main-sequence (Manoj et al. 2006). Broadband infrared colors are commonly used to discriminate between various circumstellar disks (i.e., Hartmann et al. 2005). We use the fundamental parameters derived above to determine the nature of the circumstellar excess in the following subsections.
7.1 Large Rotational Velocities
Intermediate-mass stars rotate at a wide variety of velocities depending on how they formed and their evolutionary state. Finkenzeller (1985) found that Herbig AeBe stars rotate at values of 100 v sin i 225 km s-1. Boehm & Catala (1995) predict that higher mass Herbig AeBe stars ( 4 ) should gain angular momentum as they approach the zero-age main-sequence. Boehm & Catala (1995) also predict that zero-age main-sequence stars in the mass range 2.6 M∗ 4.0 should rotate at 20555 km s-1 and stars with M∗ 4.0 should rotate at 18090 km s-1 based on pre-main-sequence projected rotational velocities. Classical Be stars are typically rapid rotators having v sin i 200 km -1. In Figure 13 we compare the rotational velocities for our sample of 20 GLIMPSE late-B and early A stars (dashed histogram), to B8–B9.5 stars from Abt et al. (2002) (solid histogram) and classical Be stars from Hanuschik et al. (1996) (dash-dot histogram). Our 20 GLIMPSE stars rotate between 25 km s-1 v sin i 310 km s-1 with a mean and dispersion of 20976 km s-1. Abt et al. (2002) found that the rotational velocity distribution for B8–9.5 stars is bimodal with peaks at both 50 km s-1 and 250 km s-1. The mean projected rotational velocity and dispersion of the Abt et al. (2002) late B star sample is 14884 km s-1. The mean projected rotational velocity and dispersion of Hanuschik et al. (1996) classical Be stars is 21717 km s-1. Thus, our sample has comparatively high rotational velocities, more consistent with the HAeBe stars and Be stars than the field B stars of Abt et al. (2002).
We compared our sample rotational velocities to both the classical Be sample and the B8–B9.5 sample using a K-S test to determine if our sample could be drawn from either of these other distributions. There is no large sample of Herbig AeBe stars with projected rotational velocity measurements as they approach the zero-age main-sequence, so we cannot make a comparison to these objects. The probability that our sample could be derived from the Abt et al. (2002) sample is 0.1%. The probability that our sample may be derived from the Hanuschik et al. (1996) sample is 8%. Although the mean projected rotational velocity of our GLIMPSE stars is consistent with those of the Hanuschik et al. (1996) classical Be stars, it is unlikely that our sample consists of solely Be stars. This result may imply that our sample is a mixed group of sources including both normal B stars, classical Be stars, and even Herbig AeBe stars.
7.2 Infrared Colors as a Discriminant for Terrestrial Temperature Dust
Using the working definition of Waters & Waelkens (1998) for Herbig AeBe stars, the only differing criterion between classical Be and Herbig AeBe stars is the nature of the infrared excess. While Herbig AeBe stars have an infrared excess due to circumstellar dust and gas, classical Be stars owe their infrared excess to free-free emission in ionized gas.
Color-color plots are often used to distinguish various types of infrared sources (e.g., Walker et al. 1989; Zhang et al. 2004). Using a color-color plot in both the near- and mid-infrared we can distinguish between sources that have an excess owing to free-free emission (and free-bound emission) and sources that have dust emission. In order to model the expected contribution of free-free emission to the infrared continuum we utilize the following equation from Tucker (1975) to estimate the free-free flux. The free-free emissivity at a given frequency, , is
| (4) |
where Ne and Np are the electron and proton densities, T is the electron temperature, and gff is the Gaunt factor. We assumed an electron temperature of 10,000 K, a pure hydrogen gas, Z=1, and Ne=Np=31011 cm-3. The values of electron densities for classical Be stars vary and we use the mean value from Gehrz et al. (1974) ( cm-3). Even though classical Be stars exhibit such large electron densities within their circumstellar disks, it has been shown that such disks are still optically thin at optical wavelengths (McDavid 2001). We used Gaunt factors from Figure 5 of Karzas & Latter (1961) by fitting a polynomial to parametrize the Gaunt factors as a function of wavelength for T10,000 K. Equation 5 gives an expression for the Gaunt factor for 10,000 K where is in m
| (5) |
In the near-infrared, the contribution of free-bound emission is not negligible. Ashok et al. (1984) found the contributions from free-free and free-bound to the total nebular emission at 2.2 m are 63% and 37%, respectively, for the physical conditions of Gehrz et al. (1974). We therefore include free-bound emission in our calculation of nebular emission. The free-bound emissivity as a function of frequency is
| (6) |
where is the excitation level of hydrogen (Tucker 1975). We adopted the same values for , , and as for the free-free emissivity above.
We used the above equations for free-free and free-bound emission to model the infrared colors of a two-component spectral energy distribution consisting of a stellar atmosphere and a thermal bremsstrahlung excess. We simulated the free-free contribution to the overall SED by adding increasing amounts of free-free (and free-bound) emission (normalized at 8 m) to a B8V stellar model from Kurucz (1993). We varied the free-free contribution from 0.01% of the stellar blackbody at 8 m to 100 times the stellar blackbody at 8 m. Varying the electron temperature of the circumstellar component between 5,000 K and 15,000 K has a negligible effect on the broadband IR colors. We also modeled the colors expected for a two-component spectral energy distribution consisting of a stellar blackbody and a cooler blackbody representative of circumstellar dust at temperatures 100–1100 K. We then used these colors to determine if we can distinguish between free-free emission and dust emission in color space.
Figure 14 shows a plot of 8-24 m vs. -8 m colors for the 19 GLIMPSE stars with [24] excesses. Open circles represent GLIMPSE sources having H in emission and open stars represent GLIMPSE sources having H in absorption. Classical Be stars () are those from Zhang et al. (2004). We utilized A band and 25 m as 8 m and 24 m measurements for the sources from Zhang et al. (2004, 2005) respectively. Thirty-five of the Zhang et al. (2004, 2005) stars have A band and 25 m measurements. Both Be catalogs, Zhang et al. (2004, 2005), draw on Be stars from Jaschek & Egret (1982), however at least 7 of the 35 Jaschek & Egret (1982) sources have some indication in the literature that they may be Herbig Be stars rather than classical Be stars. The arrow shows the reddening vector for AV=5.0. The solid curve denotes a B8V main-sequence star with AV=1.0 and increasing contribution from a free-free component at 8 m. The solid symbols denote where the circumstellar contribution at 8 m constitutes 5% (), 33% () and 50% () of the total 8 m flux. The dashed curves denote a B8V main-sequence star with AV=1.0 and an 800 K or 300 K blackbody circumstellar component. We added the blackbody contribution in a similar manner as the free-free contribution, and the solid symbols denote 5%, 33%, and 50% fractional circumstellar contributions.
Figure 14 shows that this color-space can distinguish between free-free and cool dust origins of the IR excesses. Points to the left of the solid curve may be explained by either hot dust or free-free emission. Thus, hot dust is indistinguishable from free-free emission in this color space. Points to the right of the solid curve can only be explained by a cool (terrestrial or cooler) dust component. The majority (13 of 15) of sources with H emission (open circles) lie to the left of the solid line, consistent with them being classical Be stars or stars with hot circumstellar dust. The majority of the sources with H absorption (open stars) lie to the right of the solid line, consistent with a cool circumstellar dust component. The majority of the classical Be stars (asterisks) lie to the left of the solid line, as expected for free-free excesses and consistent with their classification. There are, however, 14 Jaschek & Egret (1982) sources that fall to the right of the solid curve. They are HD 6343, HD 37318, HD 251726, HD 52721, HD 53367, HD 90177, HD 141926, BD-11 4667, HD 174571, HD 204722, HD 240010, HD 37967, HD 259431, and HD 50083. This sub-sample of 14 stars contains five of the seven possible Herbig Be stars within the 35 star Jaschek & Egret (1982) sample. The two remaining possible Herbig Be stars are HD 50138 and HD 101412. These two sources show the greatest -8 color and fall off the top of the plotted region and to the left of the solid curve. HD 50138 is also listed as a possible B[e] star (e.g., Bjorkman et al. 1998). Therefore, it is possible that some of the stars classified as classical Be stars may actually be Herbig Be stars. The two H emission GLIMPSE sources that fall to the right of the solid curve are G036.8722+00.6199 and G311.6185+00.2469. H absorption sources that fall to the right of the solid curve are G014.4239-00.7657, G311.0099+00.4156, and G339.7415-00.1904. These five sources are candidates for objects with terrestrial temperature circumstellar dust and are discussed in detail below.
7.3 Individual Free-free Contributions
A quantitative analysis of the H and mid-IR excess fluxes can help distinguish between circumstellar dust and ionized gas better than IR colors alone. Specifically, we want to determine if the free-free excess in the mid-IR predicted by the H flux can account for the observed IR excess or if a dust component is required. We use the H flux of each star to predict the gaseous circumstellar contribution to the 8 m and 24 m continuum, under the assumption that the H, free-free, and free-bound emitting volumes are coincident. Using this method one can then verify that the color-color plot in Figure 14 discriminates between infrared excesses with free-free emission and those with an excess due to cool dust. We adopt the emissivity at H from Brocklehurst (1971) for 10,000 K,
| (7) |
where Ne and Np are the number densities of electrons and protons in cm-3, respectively. We used the ratio of H to H emission coefficients from Brocklehurst (1971) for Case B,
| (8) |
Finally the flux due to free-free emission can be derived utilizing the flux at H and the emissivity at H,
| (9) |
where j is the thermal bremsstrahlung emissivity at a given frequency, and jHα is the emissivity of H. We used an electron temperature of 10,000 K but the exact choice of Ne, Np, and is not critical to the ratio of ff/Hα. The ratio is independent of gas density and only slowly varies with .
We calculate the H flux by multiplying the absorption-corrected equivalent width of the H line, EW(H), by the reddening-corrected flux at R band. Dereddened R fluxes are listed in Table 3 computed from R-band magnitudes of Monet (1998) & Monet et al. (2003). We adopt extinction estimates from Uzpen et al. (2007), which may include circumstellar absorption and may be larger than true interstellar extinction. The resultant H flux thus predicts a maximum possible free-free flux, ignoring possible variability and optical depth effects.
As a means of verifying our calculations, we used the observed H fluxes of H II regions from Viallefond et al. (1983), Viallefond & Goss (1986), and Viallefond et al. (1986) to predict the free-free radio fluxes. We compared our predicted radio fluxes to the measured values and found that the predicted 6 or 21 cm fluxes are a factor of 2 deficient relative to measured values. Israel & Kennicutt (1980) found typical extinctions of 1–2 magnitudes at visual wavelengths for H II regions. The H fluxes from Viallefond & Goss (1986) do not take into account extinction, and this may be part of the reason for the deficit. Non-thermal processes in the radio may also contribute to the radio flux.
Figure 15 shows a comparison of the data and models for one star, G036.8722-00.4112. The modeled free-free component plus stellar blackbody (dash-dot-dot-dot curve) is not sufficient to explain the measured excess at 24 m for this source. A stellar blackbody with additional blackbody due to dust (thin solid curve) fits all the measured data and is the likely explanation for the excess.
We applied our free-free model to all stars with H emission and measured [24] flux. Table 6 gives the measured [24] flux (from Uzpen et al. 2007) for all 20 GLIMPSE stars and derived flux contribution at [24] from free-free emission for the 15 stars with emission and [24] excess. The excesses from six sources are attributable to circumstellar gas since the removal of the free-free component results in 3 excesses. We designate such objects as Type I sources. The remaining nine stars with emission and [24] measurements have excesses 3 after the free-free components were removed. We designate these as Type II sources. We note that in none of our sources does the removal of the free-free component reduce the 8 m or 24 m flux below photospheric levels. In all cases, the correction for circumstellar free-free contributions either reduces the 8 and 24 m measurements to the photospheric levels or leaves a significant excess at these bands.
7.4 Variability
Both classical Be and Herbig AeBe stars exhibit variability at H (Dachs et al. 1988; Waters & Waelkens 1998). Our sources may also be variable at H, and that may explain some of the Type II sources that exhibit an excess 3.0 at [8.0] and/or [24] when the free-free component is removed. In order to assess H variability among this sample, we investigated H profile variations for a sub-sample of four northern Type I or II stars and a Balmer absorption star, G011.2691+00.4208, G036.8722-00.4112 and G047.3677+00.6199, G047.4523+00.5132, and G051.6491-00.1182. Ideally all Type II sources would be investigated for variability but five of the Type II stars are in the southern hemisphere and not observable from the Wyoming Infrared Observatory (WIRO) (G300.0992-00.0627, G305.4232-00.8229, G307.9784-00.7148, G314.3136-00.6977, and G340.0517+00.6687).
We obtained optical spectroscopy of all stars with the WIRO-Spec instrument on WIRO on the nights of 2005 August 14 and 15 using the 1435 mm-1 volume-phase holographic grating in first order. This instrument is an integral field unit spectrograph consisting of 293 densely packed fibers in a 19 20 configuration with each fiber projecting to 1′′ on the sky. This grating provides a dispersion of 0.7 Å pixel-1, a spectral resolution of 1.4 Å, and wavelength coverage of Å from 5750–7150 Å. Standard reduction techniques were implemented, including flat fielding using a continuum lamp and wavelength calibration using a CuAr arc lamp, but no flux calibration was performed. We achieved a typical signal-to-noise ratio of 100:1.
We also obtained optical spectroscopy using the WIRO-Longslit spectrograph on the nights of 2006 September 13 and 14. The WIRO-Longslit is a low-resolution spectrograph with a dispersion of Å pixel-1, a resolution of Å using a 2′′ slit width, and covers Å when using the 600 mm-1 grating in second order. We used a GG455 blocking filter to remove third order contamination. We performed the same reduction procedures for the longslit data as WIRO-Spec data, and the signal-to-noise ratios were similar.
G011.2691+00.4208, G036.8722-00.4112, G051.6491-00.1182 displayed a double-peaked emission profile all three nights. G047.4523+00.5132 exhibited absorption all three nights. G047.3677+00.6199 displayed a double-peaked emission profile on the nights of 2005 August 15 and 2006 September 27. However, on the night of 2006 September 13 the star exhibited a single-peaked emission profile. The EW(H) changed 25 and may be due to H variability. A variation in H may result in a lower-than-expected calculation of the free-free emission. We estimated at what level the H EW must vary to account for the excess at [24]. We find that the EW(H) must double for the free-free emission to explain the excess at [24]. It is interesting to note that even if the EW(H) were a factor of two larger, the excess is still significant at [8.0] even after removal of the free-free component.
For the six Type II stars in the southern hemisphere, we are unable to verify any H variability because we have only one observation of these stars. The H variability combined with the non-contemporaneous nature of the H and IR data, may lead us to over- or underestimate the circumstellar free-free contribution to the [8.0] and [24] bands. If the circumstellar free-free contribution is underestimated, we expect to see a residual IR excess. The nine Type II sources may be examples of this effect. However, we find no instances of the converse, i.e., sources where the H flux over predicts of the circumstellar free-free contribution, thereby creating a deficit at [8.0] or [24]. We find that the six southern Type II sources need to exhibit H equivalent width variation at two or three times the measured levels to explain the excesses as free-free emission. Thus, it is unlikely that the Type II sources are to be explained as objects owing their excess to free-free emission.
Optical depth effects at H may also lead to underestimates of the free-free emission. The H optical depth would have to exceed 1 in order to explain the excesses of Type II sources by free-free emission. As mentioned above, McDavid (2001) shows that a Be stellar disk with an electron density of order 1012 cm-3 is optically thin, with the maximum 1, at optical wavelengths.
7.5 Physical Nature of IR Excess Sources
Table 7 lists the derived circumstellar parameters for the nine Type II stars with the free-free emission component removed. Circumstellar disk temperature and fractional infrared luminosity were determined in the same manner as Uzpen et al. (2007). Briefly, we fit the SED as a single temperature blackbody to model the IR excess. Table 7 also lists the derived circumstellar parameters for the four non-emission line stars, hereafter referred to as Type III. We list the circumstellar disk parameters from Uzpen et al. (2007) for the five stars with 20 m observations.
We searched for correlations between derived circumstellar parameters with stellar parameters to provide insight into the nature of the excess. Figure 16 shows circumstellar disk temperature (upper panel) and stellar effective temperature (lower panel) versus EW(H). We found a significant inverse-correlation between EW(H) and circumstellar disk temperature for Type II stars. The correlation coefficient of -0.81 for the nine Type II sources means there is a 1 probability of obtaining such a high degree of correlation by chance. Such a correlation is expected if the H emission is arising within a gaseous and dusty circumstellar disk undergoing a clearing of the inner disk. That is, the strength of H decreases and the dust temperature drops as the inner disk becomes anemic. If the excess were due to free-free emission, we would expect the strength of H equivalent width to be correlated with stellar effective temperature. The hotter stars generate more ionizing photons when compared to cooler stars and exhibit a larger excess (Gehrz et al. 1974). We find no such correlation between stellar temperature and H equivalent width for Type I, Type II or Type III stars, see Figure 16.
Using our age estimates we investigated whether there is a correlation between EW(H), age, and in Figure 17. Omitting the four pre-main-sequence stars from , we used the nine Type II stars, but only six of the nine have age estimates. We plotted the younger age for Type II stars, when available. Using the six Type II sources and the one Type III source with an age, we find that age is strongly correlated with H equivalent width with a correlation coefficient of 0.97 indicating 1% probability of obtaining such a high probability by chance. Using the older age when available, there is no correlation between EW(H) and age. Manoj et al. (2006) found that H line strength decreases as Herbig AeBe stars age. If those stars are part of the evolved tail to Herbig AeBe stars we would expect to see such a correlation between EW(H) and age.
Using the above fundamental parameters, above correlations, and spectral features we can determine the circumstellar disk classification for our entire sample of 30 mid-IR excess sources. We indicate our circumstellar disk classification in Table 7. Pre-main-sequence Herbig AeBe stars and T-Tauri stars are indicated by H and TT respectively. Debris disks are denoted by D in Table 7. Stars with an excess owing to free-free emission are classical Be stars and listed as B. Finally, stars with a transitional disk system are labeled with T. Five of the stars do not have a confirmed excess at 20 m and thus, we do not classify their possible circumstellar disk. We find that utilizing Figure 14 as a first order discriminate is useful but may not be the only parameter necessary to determine the nature of the excess. Each object is discussed in the following section.
8 Individual Objects
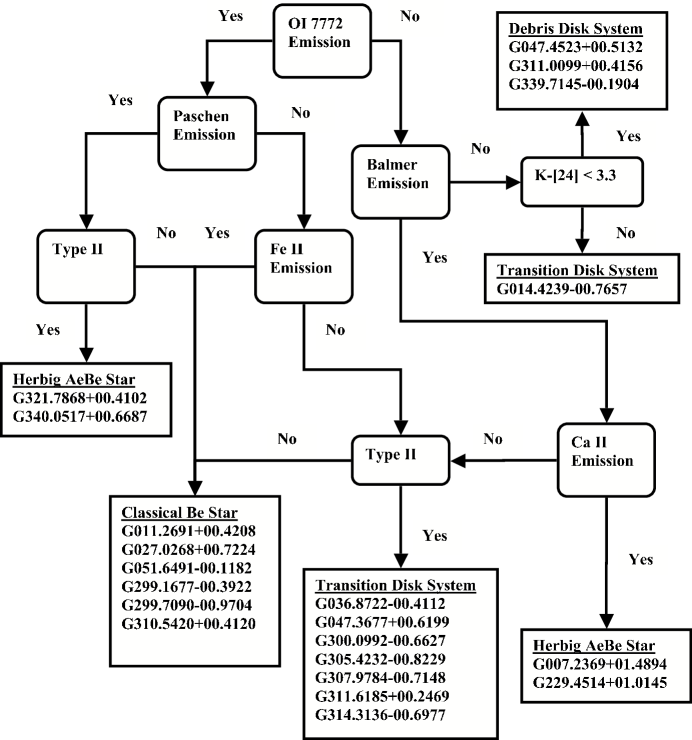
In the subsections below, we discuss individual sources. When available, we list the HD catalog number, the GLIMPSE or ID number, and the literature spectral type. In some cases, the spectral type found in the literature is discrepant from our results. Figure 18 is a flowchart illustrating the criteria we use to assign an evolutionary state to each source. In summary, we require that our candidate debris disks not exhibit any emission lines and exhibit -[24] colors 3.3 magnitudes (e.g., Hernandez et al. 2007). Transition disk systems may not exhibit Paschen emission lines, may exhibit O I 8446 Å emission, may exhibit O I 7772 Å in emission or absorption, may not exhibit Fe II emission, and must have an excess not entirely explainable by free-free emission. Classical Be stars must have Balmer emission, may exhibit Paschen emission, may exhibit Fe II emission, may exhibit O I emission, and must have an excess explainable entirely by free-free emission. Herbig AeBe stars may have essentially the same optical spectral characteristics as classical Be stars, and are therefore difficult to distinguish based on optical spectra alone. The infrared excess in HAeBe stars is dominated by dust rather than free-free emission, therefore knowledge of the SED at wavelengths longer than 10 microns is essential for unambiguous classification. However, for our sample, HAeBe stars either exhibit O I 7772 Å absorption and Ca II IR emission or exhibit O I emission, Paschen emission, and an excess not entirely explainable by free-free emission.
8.1 Candidate Debris Disk Systems
HD 231033 (G047.4523+00.5132)-A0V- As one of the few stars in our sample that lacks H emission, the derived disk temperature (3558 K) and (1.210-3) make this one of the best candidates for being a warm debris disk system. This source falls just to the left of the solid line in Figure 14, in the region where excesses due to either free-free emission or hot dust are permissible. The disk temperature and fractional infrared luminosity are similar to, but slightly higher than, typical debris disks. Since this star does not exhibit any optical emission lines, we classify the circumstellar disk as a massive debris disk. This star exhibits stronger O I 7772 Å absorption than the stellar temperature would imply. This may indicate the presence of a small amount of circumstellar gas. This star was observed multiple times at H with both WIRO and Magellan and was not observed to exhibit H variability. The age derived for this star (log age(yr)=6.11–6.37 or 7.58–8.19) is consistent with a main-sequence or late-stage main-sequence star, which agrees with its circumstellar disk classification. The large uncertainty in age is due to the large uncertainties associated with the Tycho parallactic measurement (d=909 pc).
HD 121808 (G311.0099+00.4156)-A3IV- This star lacks optical emission lines of any kind, making it another strong debris disk candidate. Like G047.4523+00.5132, it exhibits stronger O I 7772 Å absorption than the stellar temperature would indicate, suggesting that it may also be surrounded by a small amount of circumstellar gas. Circumstellar disk parameters (Tdisk=315 K and =2.710-4) are consistent with a warm, massive debris disk. There is insufficient data in the literature to make a distance estimate, and therefore, an age estimate, for this star.
HD 151017 (G339.7415-00.1904)-A0- This star does not show any spectral features indicative of the presence of circumstellar gas. Derived circumstellar disk parameters (Tdisk=3116 K and =1.010-4) are consistent with a warm, massive debris disk. There is insufficient data in the literature to make a distance estimate, and therefore, an age estimate, for this star.
8.2 Candidate Transition Disk Systems
Since transition disks around intermediate-mass stars have only recently been identified, we discuss some general properties of our eight candidate transition disk systems as a whole. The four transition disk sources with determined disk temperatures above 500 K exhibit H emission and O I 8446 Å emission. Two of these four sources exhibit O I 7772 Å in emission and two exhibit O I 7772 Å absorption consistent with stellar temperatures. Three of the four transition disk candidates with disk temperatures below 500 K exhibit H emission. Two of these four exhibit O I 7772 Å absorption stronger than the best-matched stellar model, and two exhibit O I 7772 Å absorption consistent with stellar temperatures. Three of the four stars with disk temperatures below 500 K are also in the region of color-color space in Figure 14 not explainable by free-free emission. The change in the O I lines from emission in systems with hot circumstellar disks to absorption in systems with cooler circumstellar disks may be an evolutionary effect as the disk clears. Hotter circumstellar dust would be located nearer the star, and the lack of gaseous emission as the inner disk radius becomes larger may be direct evidence of disk clearing. More transitional disk systems need to be identified and studied to provide statistical significance to this trend.
HD 168246 (G014.4239-00.7657)-B8- This star does not exhibit H emission and has an intermediate value of projected rotational velocity, 165 10 km s-1. for this star, 1.310-2, is higher than typical for debris disks. The derived disk temperature of Tdisk=191 K is the coolest in our sample and suggests that the circumstellar material is located at a relatively large radius of 75 AU. We find that this star exhibits anomalously strong O I 7772 Å absorption compared to the adopted stellar model, suggesting the presence of circumstellar gas. Given the lower temperature derived for this disk and the large -[24] color (5.15 mag), this disk may be optically thick at [24]. This system may contain a transitional disk at the end of its clearing phase. We also find that this star lies near a strong 70 m extended source, raising the possibility that the infrared emission at [24] is unrelated to the star. We find that the difference between the position of the strong [24] point source and the [8.0] point source is 1.1′′, i.e., small compared to the 6 ′′ resolution at [24]. In order to determine the chance of a random coincidence between the two sources we used the [24] source density in this field, 54 stars over an area of 0.01 deg2 (0.10.1 deg. region), to determine that there are 4.210-4 sources per arcsecond2. The probability of a [24] source randomly falling within 1.1′′ of any given [8.0] source is 0.2%. Thus, these two sources are probably related. Although unlikely, there is a chance that the excess for this source may be due to background cirrus.
(G036.8722-00.4112)-B8V- This star exhibits double-peaked H emission but no other optical emission lines. Disk temperature (Tdisk=427 K) and (7.210-4) are similar to, but slightly higher than, debris disks. Given that this star falls in the region of 8-24 m vs. -8 m color space not explainable by free-free emission, we classify this star as having a transitional disk. The possible ages for this star are widely variant, similar to either a late-stage pre-main-sequence star or late-stage main-sequence star. Given the nature of the excess and the large difference between the possible ages, we adopt the younger age range of log age(yr)=6.11–6.32.
HD 180398 (G047.3677+00.6199)-B8Ve- This star has been studied as a classical Be star (Jaschek & Jaschek 1992). Our Magellan H profile shows the same shape recorded by Jaschek & Jaschek (1992), but we also observe profile variability consistent with the report of Hamdy et al. (1991). This star exhibits O I 8446 Å emission but not Paschen emission. We classify this source as a transition disk. The derived disk temperature of 784 K is one of the highest in our sample, as is its H equivalent width (EW(Hcorr)=-22.47). The determined of 2.810-3 is consistent with a massive debris disk or transition disk. The age of this star is somewhere between a late-stage pre-main-sequence star and an early-stage main-sequence star (log age(yr)=6.87–7.72), consistent with a transitional disk. This star lies in a region of color-color space explainable either by free-free emission or a hot dust excess.
(G300.0992-00.0627)-A1- This star was tentatively associated with an X-ray source detected by the Uhuru Satellite (Gursky 1972). However, the Rosat Faint Source Catalog position for the X-ray source is 58031 ′′ from the GLIMPSE IR position, effectively ruling out an association with the IR excess source (Voges et al. 2000). This star exhibits strong double-peaked H emission, O I 8446 and 7772 Å emission, without Fe II or Paschen emission. We characterize the infrared excess as due to a transition disk. Circumstellar disk parameters of Tdisk=526 K and =2.110-3 indicate a disk between those of Herbig AeBe stars and those of debris disks. This may be an early form of transitional disk.
HD 114757 (G305.4232-00.8209)-B6/8V(E)- Seidensticker (1989) derived MV= -1.890.44, AV=1.110.13 mag, and distance modulus of 10.030.46 mag. H exhibits a double-peaked emission-line profile. This star exhibits a warm circumstellar disk temperature (Tdisk=675 K) and moderate (3.810-3). Stellar age estimates indicate either an early pre-main-sequence star or a middle/late-stage main-sequence star. This source falls in a region of color-color space that may be explained by free-free emission or a hot dust component. Free-free emission is not sufficient to explain the large excess at [24], suggesting the presence of circumstellar dust. This star exhibits both O I 8446 and 7772 Å in emission without Fe II or Paschen lines in emission. We classify this source as a transition disk and adopt the younger stellar age of log age (yr)=5.88.
HD 118094 (G307.9784-00.7148)-B8V(N)- Levenhagen & Leister (2004) derived the fundamental parameters for this star, which they list as a Be star. They found v sin i=23930 km s-1, Teff=13,500550 K, log g=3.900.15, log age(yr)=8.030.04, log =2.590.08, and =4.20.2. Our derived values of projected rotational velocity, 24020 km s-1, and temperature, 13,220520 K, are in agreement with their derived values. We determine this star to be either a young pre-main-sequence object or a late-stage main-sequence star, log age(yr)=6.00–6.23 or 7.66–8.03. Even using their derived parameters and the Siess et al. (2000) models we can not rule out the possibility of a 1 Myr star. The H emission profile is highly asymmetric and double-peaked. This star exhibits O I 7772 Å in emission without Fe II or Paschen lines in emission. Based on our stellar parameters, spectral features, Tdisk=557 K, =9.010-4, and the possibility of a few Myr age, which we adopt, we classify this excess owing to a transitional disk.
HD 122620 (G311.6185+00.2469)-B8/9IV/V- Westin (1985) derived MV=-0.613, distance=965 pc, Teff=11,190 K, and log age(yr)=8.275. Our derived effective temperature of 10,540255 K is lower. Our age estimates are log age(yr)=6.08–6.18 and 8.16–8.18. The older age is consistent with the literature but inconsistent with the nature of the excess. The free-free component of the [24] excess is one of the smallest of the sample. The circumstellar disk parameters (Tdisk=306 K and =1.210-3) are consistent with a warm massive debris disk. The weak double-peaked H emission profile is inconsistent with a debris disk nature for this source. We classify this source as a transitional circumstellar disk and adopt the younger stellar age range.
HD 126578 (G314.3136-00.6977)-A1IV- This star exhibits the weakest H emission profile. The circumstellar parameters (Tdisk=328 K and =9.610-4) indicate a debris disk, but the weak H emission precludes such classification. O I 7772 Å is seen in absorption with an EW greater than the best-fit stellar model would indicate. This star falls in a region of color-color space where excesses due to free-free emission or hot dust are permissible. This star may be at the end of its transitional disk phase.
8.3 Probable Be stars (Type I Sources)
HD 165854 (G011.2691+00.4208)-B9V- We find that the excess for this star can be explained by free-free emission which supports the standing classification of this star as a classical Be star. The only emission we find is a weak double-peaked H profile. Halbedel (1996) found the rotational velocity to be 25010 km s-1, and Yudin (2001) found it to be 24210 km s-1. These values are slightly greater than our derived value of 22015 km s-1.
HD 172030 (G027.0268+00.7224)-A0V- This star exhibits a double-peaked H emission profile and Fe II emission. The spectrum for this star also shows the Ca II IR triplet, O I 8446 Å, O I 7772 Å , and the Paschen lines in emission. The excess for this source can be fully explained by free-free emission. It is interesting to note that this star has a low projected rotational velocity, 255 km s-1, which is not typical for classical Be stars.
HD 183035 (G051.6491-00.1182)-A0V- The core of the marginally double-peaked H profile is nearly filled in, and no other emission lines are present. This star does exhibit broad absorption features, i.e., 4455 Å inconsistent with the measured stellar temperature. This absorption may be an indication of circumstellar gas. However, this star falls in a region of color-color space explainable by free-free emission and has an excess consistent with such an origin. We conclude that this is a classical Be star.
(G299.1677-00.3922)-B8- This star exhibits double-peaked H emission, Paschen emission, and O I 8446 Å emission. This type of spectrum is typical for classical Be stars (Andrillat et al. 1990).
HD 107609 (G299.7090-00.9704)-B8/9IV- This star exhibits a large fraction of the excess at [24] as free-free emission. However, this source does not exhibit any lines other than H in emission. Nevertheless, it is likely that this is a classical Be star.
HD 121195 (G310.5420+00.4120)-B8IV(N)- Westin (1985) derived MV=-2.953, distance=1,945 pc, and Teff=12,940 K for this star. Their temperature is in agreement with our derived effective temperature of 12,430510 K. We determined log age(yr)=5.30 utilizing the Westin (1985) absolute visual magnitude. This extreme youth is probably not realistic given that, at such an age, this star would be embedded and undergo substantial extinction, which is not observed. The H emission profile is weak and double-peaked, while O I 7772 Å is found in absorption. Since the excess can be explained fully by free-free emission we classify this source as a Be star, but the optical spectrum is similar to some transition disks.
8.4 Other Circumstellar Disks and Infrared Excesses
HD 163296 (G007.2369+01.4894)-A1V- This star has been studied numerous times for both stellar parameters and circumstellar disk evolution. This Herbig Ae (HAe) star is only 122 pc distant. Rotational velocities for this source are consistent in the literature, Finkenzeller (1985) derived a rotational velocity of 120 km s-1, Halbedel (1996) derived a rotational velocity of 120 km s-1, Mora et al. (2001) derived a velocity of 1306 km s-1, all consistent with our calculated value of 14515 km s-1. Stellar fundamental parameters were calculated to be Teff=9,200270 K, MBol=0.480.10 from Cidale et al. (2001), and Teff=9,475K, M∗=2.4 , and 5 Myr old from Mannings & Sargent (1997). The age of this star varies in the literature but is 4–6 Myr with H equivalent width varying between -12 – -17 Å (Kessler-Silacci et al. 2006). Pogodin (1994) found this star to exhibit rapid H variability. Our derived Teff of 10,350230 K is hotter than literature values. We find that the H emission line is stronger than the values reported in the literature (EW(H)=-26.150.15 Å). The Mg II 4481 Å line is known to vary, and this may explain the difference between our measured effective temperature and those in literature (Catala et al. 1989). Spectral types for this star vary between A0–A7, confirming a range of stellar temperatures for this star (Finkenzeller 1985; Kessler-Silacci et al. 2006). Our measured parameters are consistent with the pre-main-sequence nature of this star.
HD 167905 (G008.3752-03.6697)-F3V- We classify this star as a T-Tauri object based on large (210-1), weak H emission with a P-Cygni profile, low effective stellar temperature (Teff=7260 K), and low rotational velocity.
HD 161643 (G009.4973+05.2441)-A7V- We do not have enough data to propose an evolutionary status for this star. This star is a binary, and this may explain its slightly asymmetric H absorption profile (Fabricius & Makarov 2000). The secondary star is 3 magnitudes fainter at in the catalog. Longer wavelength confirmation of the excess is needed. Confirmation of an excess having small would indicate a debris disk. This star does not exhibit any emission lines.
HD 171149 (G025.6122+01.3020)-B9V- Abt & Morrell (1995) derived a rotational velocity for this star of 280 km s-1, while Royer et al. (2002b) found the rotational velocity to be 301 km s-1. Our derived value of 29020 km s-1 is consistent with both prior measurements. We find H in absorption. We also find this source to exhibit broad absorption at 4455 Å that may be due to circumstellar material. Additional longer wavelength observations are needed to classify this star. The H profile needs to be studied for variability and emission. Longer wavelength infrared/radio measurements are needed to confirm the excess. With additional optical and infrared/radio measurements it will be possible to distinguish between an excess due to a classical Be star, debris disk, or false excess.
HD 182293 (G054.5163+02.4470)-K1IV- Although listed as a K1IV in Wright et al. (2003), our spectrum (not shown) indicates a spectral type of II-III. We omit further analysis of this source due to its evolved nature.
HD 58647 (G229.4514+01.0143)-B9V- There is a disparity between measured projected rotational velocities for this star. Grady et al. (1996) and Manoj et al. (2002) found it to be 280 km s-1, however, Mora et al. (2001) found the projected rotational velocity to be 1184 km s-1. Historically this star has been classified as a Herbig AeBe star, but in Manoj et al. (2002) they conclude that this star is a classical Be star based on the low fractional infrared luminosity. Monnier et al. (2005) studied the near-IR and disk properties of this source. They measured a stellar luminosity of 29550 , and found a very low fractional infrared luminosity when compared to other Herbig AeBe stars. Vink et al. (2002) found that H line polarization for this star does not agree with that of classical Be stars but exhibits similar properties to Herbig AeBe stars in the (Q,U) plane. They also measured the H equivalent width to be -8.6 Å which is consistent with our measurement of -7.820.45 Å assuming they have similar uncertainties. We find this source to exhibit the Ca II IR triplet, O I 8446 Å and Fe II in emission. This source also shows strong O I 7772 Å , and 4455 Å absorption. Based upon the spectral properties of this source we conclude that HD 58647 is a Herbig AeBe star. Given the low fractional infrared luminosity, this star may be a more evolved form of Herbig AeBe star.
HD 72106 (G257.6236+00.2459)-A0IV- This is a visual double star with a separation of 0.8 arcseconds (Vieira et al. 2003). We have a spectrum of only the primary star, and no emission lines are found. Vieira et al. (2003) conclude that the secondary of this system exhibits the infrared excess, the H emission, and is an evolved HAeBe star. The mid-IR spectrum of this source exhibits similar features of solar system comets also indicating the evolved nature of a Herbig AeBe star (Schütz et al. 2005). Wade et al. (2005) measured the magnetic field of both the primary and secondary of this system and found the primary to exhibit a strong magnetic field. They argue that the primary may be a progenitor to the Ap/Bp stars.
HD 73461 (G265.5536-03.9951)-A5V&A6/8V- This is a known wide visual binary (Brosche & Sinachopoulos 1989). We have spectra of both the primary and secondary. Neither source exhibits any emission lines. The primary exhibits stronger O I 7772 Å absorption that may indicate circumstellar gas. Longer wavelength confirmation of the excess is necessary to determine the nature of the circumstellar disk. Assuming the binary system is coeval, the stellar parameters constrain the primary to 2.20.2 and secondary to 2.00.2 with an age of 6.81–6.83 Log yr.
HD 74534 (G269.5873-05.8882)-G0V- Cutispoto et al. (2002) detect Ca II K emission. We do not detect this in our spectrum. Cutispoto et al. (2003) derived a mass of 2 , an age of 2 Gyr, and a projected rotational velocity of 17 km s-1. They find this star to be an evolved giant. We also find this star to be an evolved giant based on our spectrum. Our derived projected rotational velocity of 105 km s-1 is the lowest determined for our sample. We do not derive additional parameters for this source due to its evolved nature.
HD 135354 (G321.7868+00.4102)-B8VN- Kozok (1985) derived distances, absolute visual magnitudes, and reddenings for Be stars, including this star. The absolute visual magnitude is -1.18 at a distance of 1.01 kpc. Utilizing these parameters, we determined a stellar age range of log age(yr)=5.83–6.12 and 8.01–8.13. This star exhibits H, O I 8446 Å, O I 7772 Å, Paschen, and Fe II emission. Andrillat et al. (1990) found that classical Be stars exhibiting O I emission also show Paschen emission. Jaschek et al. (1993) found that classical Be stars exhibit both O I and Fe II emission. This star exhibits both of these characteristics. The fractional infrared luminosity and disk temperature (=2.110-3 and Tdisk=556 K) are consistent with transition disks but the measured H EW is the second strongest of the sample. Given that the H flux is insufficient to explain the excess at [24] and the EW of H is consistent with Herbig AeBe stars we classify this star as a Herbig AeBe star.
HD 151228 (G339.4392-00.7791)-A0/1 IV/V- The excess at [8.0] is not confirmed for this star at [24], making it a false mid-IR excess.
HD 150625 (G340.0517+00.6687)-B8- Kozok (1985) derived an absolute visual magnitude of -1.87 and a distance of 0.83 kpc. Using these parameters we constrain stellar ages to log age(yr)=5.62–5.85 and 7.81–7.90. This star exhibits a strong H emission profile, Fe II, Paschen, and O I 8446 and 7772 Å emission lines. The measured H flux is insufficient to explain the excess at [24]. This is the other Type II source that we classify as a Herbig AeBe star based on the emission line spectrum. The fractional infrared luminosity and disk temperature (=1.510-2 and Tdisk=823 K) for this star is the largest in the GLIMPSE sample and falls between Herbig AeBe stars and debris disks. This may be an evolved Herbig AeBe star.
HD 152404 (G347.3777+04.2010)-F5V- This star is a spectroscopic binary in the Upper Centarus-Lupus with an orbital period of 13.6 days (Manset et al. 2005). This star is 17 Myr old and classified as F5V (Chen et al. 2005). This star has a strong excess ratio given its age and may be a long lived primordial disk (Siegler et al. 2007). Our projected rotational velocity for the two stars is 155 km s-1 consistent with 18.51.0 km s-1 from (Alencar et al. 2003). Due to the nature of this binary source we do not derive effective temperature since our method of deriving temperature does not extend to spectroscopic binaries of similar mass. The H profile indicates an unusual double peaked inverse P-Cygni profile. This may indicate circumstellar accretion.
9 Sample Comparisons
Given the similarity of the H profiles for both stars classified as candidate transition disks systems and classical Be stars, we make a comparison of the spectral features for our sample with a group of well-studied classical Be stars from Andrillat et al. (1990) and Jaschek et al. (1993). We use the following conclusions from Andrillat et al. (1990) for classical Be stars: 1) Ca II emission is infrequent for spectral types later than B6 and nearly all stars that exhibit Ca II in emission exhibit Paschen emission, 2) Paschen lines are in emission when O I is in emission, 3) When 12 m is in excess greater than 0.55 magnitudes of the predicted measurement then Ca II is in emission. In order to make the comparison with the last criterion we used the [8.0] measurement in excess greater than 0.55 magnitudes. Table 13 lists the 10 stars we are able to classify as either consistent or inconsistent with a classical Be star classification based on the three criteria we mentioned above. In all 10 instances the classifications we derive using the criteria of Andrillat et al. (1990) are consistent with our classifications.
In order to validate our classification scheme we also applied the classifications in Figure 18 to the classical Be stars in Andrillat et al. (1990). In order to make the comparison over all spectral features classified, we supplemented the spectra from Andrillat et al. (1990) with spectra from Jaschek et al. (1993) to gain the O I 7772 Å feature. There were only 19 stars in both Andrillat et al. (1990) and Jaschek et al. (1993). Using our classification criteria we were able to classify only one of the 19 stars as a classical Be star based on spectra alone. The remaining 18 stars required some knowledge of the SED. We fit Kurucz stellar models to 2MASS photometry for these 18 stars in a manner similar to our GLIMPSE stars in order to estimate the amount of extraphotospheric flux emanating from these sources. Since these 18 stars are all bright (V 5) and 2MASS photometry for such stars have large uncertainties, we chose not to determine the free-free emission from H flux because of the larger normalization uncertainties associated with the band. In order to determine the nature of the excess emission we determined the slope of the excess component, , where Fν after an estimate of the stellar flux was removed. The slope of free-free emission in the infrared varies from -0.1–2.0 depending on the optical depth of the gas (Wright & Barlow 1974). By contrast, sources with dust components would have slopes -0.1. In order to determine the slope of the infrared excess, we used flux measurements at 8.7 m from Gehrz et al. (1974) and the Point Source Catalog at 25 m measurements. Only 10 of the 18 stars had photometry at both 8.7 and 25 m. We found that eight out of the 10 stars exhibit positive slopes consistent with optically thick free-free emission. Tau and 48 Per exhibited negative slopes. Only 48 Per exhibits a slope less than -0.1 at the 3 level. Given the length of time between the two infrared measurements ( 10 years) the large negative slope may be a consequence of the star’s known variability (e.g., Koen & Eyer 2002). Assuming that slopes consistent with free-free emission would cause the stars to be classified as Type I sources (Be stars), 10 of 11 known classical Be stars would be classified as Be stars using our classification methods. By comparison, all three of our candidate debris disk systems exhibit slopes less than -0.1 at a 3 or greater level. None of the six classical Be stars within our sample exhibit slopes less than -0.1 at a 3 level, meaning that their excesses are consistent with optically thin or thick free-free emission. Neither of the two candidate Herbig AeBe stars exhibit a slope less than -0.1 at the 3 level. Four of the eight candidate transition disk systems exhibit a slope less than -0.1 at greater than a 3, level indicative of dust. These four stars are G014.4239-00.7657, G036.8722-00.4112, G311.6185+00.2469, and G314.3136-00.6977. The explanation for the four remaining candidate transition disk systems not exhibiting a -0.1 at a 3 level may be variability. An additional scenario for the shallower slopes is a narrow ring of single temperature hot dust, something analogous to Leporis (Chen & Jura 2001). Another possible explanation for the excess for these four stars may be optically thick free-free emission. In order to be conservative, we added a possible Be classification to the remaining four candidate transition disk systems, G047.3677+00.6199, G300.0992-00.0627, G305.4232-00.8229, and G307.9784-00.7148 in Table 7.
10 Conclusion
In an effort to identify the nature of the infrared excesses, we obtained high-resolution optical spectroscopy for 31 luminosity class V or IV stars of spectral type B8 or later exhibiting 8 m mid-IR excesses in the GLIMPSE and catalogs. We measured stellar effective temperatures for 28 stars and projected rotational velocities and H equivalent widths for 30 stars. The projected rotational velocities of the 20 GLIMPSE stars lie between 25 and 310 km s-1 with a mean and dispersion of 20976 km s-1 consistent with the mixed nature of the sample. We used derived stellar parameters and distances to estimate stellar ages ranging from 1 Myr to 100 Myr for 16 stars (9 of the 20 GLIMPSE stars). Twenty of the 31 stars (16 of the 20 GLIMPSE stars) exhibit H emission, consistent with characteristics of pre-main-sequence stars (i.e., Herbig AeBe stars) or classical Be stars. H equivalent widths range between -39.38 Å (characteristic of classical Be stars or Herbig AeBe stars) and 9.41 Å (main-sequence B and A stars), suggesting a variety of origins in a sample of objects spanning a range of stellar evolutionary states.
For 16 of the 20 GLIMPSE stars showing H emission, we use the H flux to estimate the expected contribution of (free-free and free-bound) emission to the mid-IR excesses. In six out of the 16 cases, the expected IR excess can fully account for the observed infrared excess (Type I sources). We did not confirm the infrared excess at 24 m in one case. In the remaining nine cases (Type II sources) the expected contribution from free-free emission cannot account for all of the observed IR excess, implying that either 1) the circumstellar excess is time-variable and the non-contemporaneous nature of H and mid-IR data render this estimate invalid, or 2) there is a dust component to the IR excess. The lack of evidence for H variability for the majority of our sources, combined with the fact that in no instance does the H over predict the IR excess component, makes the first scenario unlikely. We conclude that the second scenario, the presence of a circumstellar dust component, is most probable. Combining correlations of spectral features for sources with known characteristics we find that the nine Type II sources with IR excesses require a dust component and are likely to be young main-sequence or near main-sequence objects harboring warm (300–800 K) circumstellar dust. The nominal fractional infrared luminosities for these nine sources after removal of the free-free component is 10-2–10-3. For the six of these nine sources with age estimates, there is a correlation between estimated age and H EW consistent with a progression of disk clearing with time. Such characteristics make these stars candidates for being “transition disk” or “evolved-HAeBe” systems containing rare dissipating primordial gas and dust disks. One of the four systems lacking H emission has a very large -[24] color, 4 magnitudes. Such a large color difference implies that the excess is optically thick at [24]. We conclude that this source is also a transition disk. The remaining three systems lacking H emission have disk temperatures of 300–400 K and fractional infrared luminosities of 10-3. These characteristics make them candidates for dusty debris disk systems.
We show that -8, 8-24 color-color diagrams are a useful tool to distinguish cool (Td 300 K) dusty mid-IR excess objects from hot (Td 500 K) dusty or free-free mid-IR excesses. Such diagrams reveal that additional information beyond near/mid-IR colors is necessary to distinguish hot dust from free-free excesses. This diagram also reinforces the idea that some stars cataloged as classical Be stars may in fact be late-stage pre-main-sequence stars containing circumstellar dust.
References
- Abt et al. (2002) Abt, H. A., Levato, H., & Grosso, M. 2002, ApJ, 573, 359
- Abt & Morrell (1995) Abt, H. A., & Morrell, N. I. 1995, ApJS, 99, 135
- Alencar et al. (2003) Alencar, S. H. P., Melo, C. H. F., Dullemond, C. P., Andersen, J., Batalha, C., Vaz, L. P. R., & Mathieu, R. D. 2003, A&A, 409, 1037
- Andrillat et al. (1990) Andrillat, A., Jaschek, M., & Jaschek, C. 1990, A&AS, 84, 11
- Ashok et al. (1984) Ashok, N. M., Bhatt, H. C., Kulkarni, P. V., & Joshi, S. C. 1984, MNRAS, 211, 471
- Aumann et al. (1984) Aumann, H. H., Beichman, C. A., Gillett, F. C., de Jong, T., Houck, J. R., Low, F. J., Neugebauer, G., Walker, R. G., & Wesselius, P. R. 1984, ApJ, 278, L23
- Aumann & Probst (1991) Aumann, H. H., & Probst, R. G. 1991, ApJ, 368, 264
- Backman & Paresce (1993) Backman, D. E., & Paresce, F. 1993, in Protostars and Planets III, ed. E. H. Levy & J. I. Lunine, 1253–1304
- Balona (2000) Balona, L. A. 2000, in Astronomical Society of the Pacific Conference Series, Vol. 214, IAU Colloq. 175: The Be Phenomenon in Early-Type Stars, ed. M. A. Smith, H. F. Henrichs, & J. Fabregat, 1–58381
- Benjamin et al. (2003) Benjamin, R. A., Churchwell, E., Babler, B. L., Bania, T. M., Clemens, D. P., Cohen, M., Dickey, J. M., Indebetouw, R., Jackson, J. M., Kobulnicky, H. A., Lazarian, A., Marston, A. P., Mathis, J. S., Meade, M. R., Seager, S., Stolovy, S. R., Watson, C., Whitney, B. A., Wolff, M. J., & Wolfire, M. G. 2003, PASP, 115, 953
- Bernstein et al. (2003) Bernstein, R., Shectman, S. A., Gunnels, S. M., Mochnacki, S., & Athey, A. E. 2003, in Presented at the Society of Photo-Optical Instrumentation Engineers (SPIE) Conference, Vol. 4841, Instrument Design and Performance for Optical/Infrared Ground-based Telescopes. Edited by Iye, Masanori; Moorwood, Alan F. M. Proceedings of the SPIE, Volume 4841, pp. 1694-1704 (2003)., ed. M. Iye & A. F. M. Moorwood, 1694–1704
- Bjorkman et al. (1998) Bjorkman, K. S., Miroshnichenko, A. S., Bjorkman, J. E., Meade, M. R., Babler, B. L., Code, A. D., Anderson, C. M., Fox, G. K., Johnson, J. J., Weitenbeck, A. J., Zellner, N. E. B., & Lupie, O. L. 1998, ApJ, 509, 904
- Boehm & Catala (1995) Boehm, T., & Catala, C. 1995, A&A, 301, 155
- Bowen (1947) Bowen, I. S. 1947, PASP, 59, 196
- Brocklehurst (1971) Brocklehurst, M. 1971, MNRAS, 153, 471
- Brosche & Sinachopoulos (1989) Brosche, P., & Sinachopoulos, D. 1989, Bulletin d’Information du Centre de Donnees Stellaires, 37, 109
- Calvet et al. (2005) Calvet, N., D’Alessio, P., Watson, D. M., Franco-Hernández, R., Furlan, E., Green, J., Sutter, P. M., Forrest, W. J., Hartmann, L., Uchida, K. I., Keller, L. D., Sargent, B., Najita, J., Herter, T. L., Barry, D. J., & Hall, P. 2005, ApJ, 630, L185
- Carroll (1933) Carroll, J. A. 1933, MNRAS, 93, 478
- Catala et al. (1986) Catala, C., Czarny, J., Felenbok, P., & Praderie, F. 1986, A&A, 154, 103
- Catala et al. (1989) Catala, C., Simon, T., Praderie, F., Talavera, A., The, P. S., & Tjin A Djie, H. R. E. 1989, A&A, 221, 273
- Chen & Jura (2001) Chen, C. H., & Jura, M. 2001, ApJ, 560, L171
- Chen et al. (2005) Chen, C. H., Jura, M., Gordon, K. D., & Blaylock, M. 2005, ApJ, 623, 493
- Chen et al. (2006) Chen, C. H., Sargent, B. A., Bohac, C., Kim, K. H., Leibensperger, E., Jura, M., Najita, J., Forrest, W. J., Watson, D. M., Sloan, G. C., & Keller, L. D. 2006, ApJS, 166, 351
- Cidale et al. (2001) Cidale, L., Zorec, J., & Tringaniello, L. 2001, A&A, 368, 160
- Cox (2000) Cox, A. N. 2000, Allen’s astrophysical quantities (Allen’s astrophysical quantities, 4th ed. Publisher: New York: AIP Press; Springer, 2000. Editedy by Arthur N. Cox. ISBN: 0387987460)
- Cutispoto et al. (2002) Cutispoto, G., Pastori, L., Pasquini, L., de Medeiros, J. R., Tagliaferri, G., & Andersen, J. 2002, A&A, 384, 491
- Cutispoto et al. (2003) Cutispoto, G., Tagliaferri, G., de Medeiros, J. R., Pastori, L., Pasquini, L., & Andersen, J. 2003, A&A, 397, 987
- Dachs et al. (1988) Dachs, J., Kiehling, R., & Engels, D. 1988, A&A, 194, 167
- Deroo et al. (2007) Deroo, P., Acke, B., Verhoelst, T., Dominik, C., Tatulli, E., & van Winckel, H. 2007, A&A, 474, 45
- Egan et al. (2003) Egan, M. P., Price, S. D., Kraemer, K. E., Mizuno, D. R., Carey, S. J., Wright, C. O., Engelke, C. W., Cohen, M., & Gugliotti, M. G. 2003, VizieR Online Data Catalog, 5114, 0
- Fabricius & Makarov (2000) Fabricius, C., & Makarov, V. V. 2000, VizieR Online Data Catalog, 335, 60141
- Finkenzeller (1985) Finkenzeller, U. 1985, A&A, 151, 340
- Finkenzeller & Mundt (1984) Finkenzeller, U., & Mundt, R. 1984, A&AS, 55, 109
- Furlan et al. (2007) Furlan, E., Sargent, B., Calvet, N., Forrest, W. J., D’Alessio, P., Hartmann, L., Watson, D. M., Green, J. D., Najita, J., & Chen, C. H. 2007, ApJ, 664, 1176
- Gehrz et al. (1974) Gehrz, R. D., Hackwell, J. A., & Jones, T. W. 1974, ApJ, 191, 675
- Grady et al. (1996) Grady, C. A., Perez, M. R., Talavera, A., Bjorkman, K. S., de Winter, D., The, P.-S., Molster, F. J., van den Ancker, M. E., Sitko, M. L., Morrison, N. D., Beaver, M. L., McCollum, B., & Castelaz, M. W. 1996, A&AS, 120, 157
- Gray (1992) Gray, D. F. 1992, The Observation and Analysis of Stellar Photospheres (The Observation and Analysis of Stellar Photospheres, by David F. Gray, pp. 470. ISBN 0521408687. Cambridge, UK: Cambridge University Press, June 1992.)
- Gursky (1972) Gursky, H. 1972, ApJ, 175, L141
- Halbedel (1996) Halbedel, E. M. 1996, PASP, 108, 833
- Hamann & Persson (1992) Hamann, F., & Persson, S. E. 1992, ApJS, 82, 285
- Hamdy et al. (1991) Hamdy, M. A., Elazm, M. S. A., & Saad, S. M. 1991, Ap&SS, 186, 161
- Hanuschik et al. (1996) Hanuschik, R. W., Hummel, W., Sutorius, E., Dietle, O., & Thimm, G. 1996, A&AS, 116, 309
- Hartmann et al. (1993) Hartmann, L., Kenyon, S. J., & Calvet, N. 1993, ApJ, 407, 219
- Hartmann et al. (2005) Hartmann, L., Megeath, S. T., Allen, L., Luhman, K., Calvet, N., D’Alessio, P., Franco-Hernandez, R., & Fazio, G. 2005, ApJ, 629, 881
- Herbig (1960) Herbig, G. H. 1960, ApJS, 4, 337
- Hernández et al. (2006) Hernández, J., Briceño, C., Calvet, N., Hartmann, L., Muzerolle, J., & Quintero, A. 2006, ApJ, 652, 472
- Hernández et al. (2004) Hernández, J., Calvet, N., Briceño, C., Hartmann, L., & Berlind, P. 2004, AJ, 127, 1682
- Hernandez et al. (2007) Hernandez, J., Hartmann, L., Megeath, T., Gutermuth, R., Muzerolle, J., Calvet, N., Vivas, A. K., Briceno, C., Allen, L., Stauffer, J., Young, E., & Fazio, G. 2007, ArXiv Astrophysics e-prints
- Hillenbrand et al. (2008) Hillenbrand, L. A., Carpenter, J. M., Kim, J. S., Meyer, M. R., Backman, D. E., Moro-Martin, A., Hollenbach, D. J., Hines, D. C., Pascucci, I., & Bouwman, J. 2008, ArXiv e-prints, 801
- Hillenbrand et al. (1992) Hillenbrand, L. A., Strom, S. E., Vrba, F. J., & Keene, J. 1992, ApJ, 397, 613
- Israel & Kennicutt (1980) Israel, F. P., & Kennicutt, R. C. 1980, Astrophys. Lett., 21, 1
- Jaschek & Jaschek (1992) Jaschek, C., & Jaschek, M. 1992, A&AS, 95, 535
- Jaschek et al. (1988) Jaschek, C., Jaschek, M., Egret, D., & Andrillat, Y. 1988, A&A, 192, 285
- Jaschek & Egret (1982) Jaschek, M., & Egret, D. 1982, in IAU Symposium, Vol. 98, Be Stars, ed. M. Jaschek & H.-G. Groth, 261
- Jaschek et al. (1993) Jaschek, M., Jaschek, C., & Andrillat, Y. 1993, A&AS, 97, 781
- Jaschek et al. (1980) Jaschek, M., Jaschek, C., Hubert-Delplace, A.-M., & Hubert, H. 1980, A&AS, 42, 103
- Jenniskens & Desert (1994) Jenniskens, P., & Desert, F.-X. 1994, A&AS, 106, 39
- Jura (1999) Jura, M. 1999, ApJ, 515, 706
- Karzas & Latter (1961) Karzas, W. J., & Latter, R. 1961, ApJS, 6, 167
- Kessler-Silacci et al. (2006) Kessler-Silacci, J., Augereau, J.-C., Dullemond, C. P., Geers, V., Lahuis, F., Evans, II, N. J., van Dishoeck, E. F., Blake, G. A., Boogert, A. C. A., Brown, J., Jørgensen, J. K., Knez, C., & Pontoppidan, K. M. 2006, ApJ, 639, 275
- Koen & Eyer (2002) Koen, C., & Eyer, L. 2002, MNRAS, 331, 45
- Kozok (1985) Kozok, J. R. 1985, A&AS, 62, 7
- Kurucz (1993) Kurucz, R. L. 1993, SYNTHE spectrum synthesis programs and line data (Kurucz CD-ROM, Cambridge, MA: Smithsonian Astrophysical Observatory, —c1993, December 4, 1993)
- Lagrange et al. (2000) Lagrange, A.-M., Backman, D. E., & Artymowicz, P. 2000, Protostars and Planets IV, 639
- Levenhagen & Leister (2004) Levenhagen, R. S., & Leister, N. V. 2004, AJ, 127, 1176
- Mannings & Sargent (1997) Mannings, V., & Sargent, A. I. 1997, ApJ, 490, 792
- Manoj et al. (2006) Manoj, P., Bhatt, H. C., Maheswar, G., & Muneer, S. 2006, ApJ, 653, 657
- Manoj et al. (2002) Manoj, P., Maheswar, G., & Bhatt, H. C. 2002, MNRAS, 334, 419
- Manset et al. (2005) Manset, N., Bastien, P., & Bertout, C. 2005, AJ, 129, 480
- McDavid (2001) McDavid, D. 2001, ApJ, 553, 1027
- McSwain & Gies (2005) McSwain, M. V., & Gies, D. R. 2005, ApJS, 161, 118
- Meyer et al. (2004) Meyer, M. R., Hillenbrand, L. A., Backman, D. E., Beckwith, S. V. W., Bouwman, J., Brooke, T. Y., Carpenter, J. M., Cohen, M., Gorti, U., Henning, T., Hines, D. C., Hollenbach, D., Kim, J. S., Lunine, J., Malhotra, R., Mamajek, E. E., Metchev, S., Moro-Martin, A., Morris, P., Najita, J., Padgett, D. L., Rodmann, J., Silverstone, M. D., Soderblom, D. R., Stauffer, J. R., Stobie, E. B., Strom, S. E., Watson, D. M., Weidenschilling, S. J., Wolf, S., Young, E., Engelbracht, C. W., Gordon, K. D., Misselt, K., Morrison, J., Muzerolle, J., & Su, K. 2004, ApJS, 154, 422
- Monet (1998) Monet, D. G. 1998, in Bulletin of the American Astronomical Society, Vol. 30, Bulletin of the American Astronomical Society, 1427–+
- Monet et al. (2003) Monet, D. G., Levine, S. E., Canzian, B., Ables, H. D., Bird, A. R., Dahn, C. C., Guetter, H. H., Harris, H. C., Henden, A. A., Leggett, S. K., Levison, H. F., Luginbuhl, C. B., Martini, J., Monet, A. K. B., Munn, J. A., Pier, J. R., Rhodes, A. R., Riepe, B., Sell, S., Stone, R. C., Vrba, F. J., Walker, R. L., Westerhout, G., Brucato, R. J., Reid, I. N., Schoening, W., Hartley, M., Read, M. A., & Tritton, S. B. 2003, AJ, 125, 984
- Monnier et al. (2005) Monnier, J. D., Millan-Gabet, R., Billmeier, R., Akeson, R. L., Wallace, D., Berger, J.-P., Calvet, N., D’Alessio, P., Danchi, W. C., Hartmann, L., Hillenbrand, L. A., Kuchner, M., Rajagopal, J., Traub, W. A., Tuthill, P. G., Boden, A., Booth, A., Colavita, M., Gathright, J., Hrynevych, M., Le Mignant, D., Ligon, R., Neyman, C., Swain, M., Thompson, R., Vasisht, G., Wizinowich, P., Beichman, C., Beletic, J., Creech-Eakman, M., Koresko, C., Sargent, A., Shao, M., & van Belle, G. 2005, ApJ, 624, 832
- Mora et al. (2001) Mora, A., Merín, B., Solano, E., Montesinos, B., de Winter, D., Eiroa, C., Ferlet, R., Grady, C. A., Davies, J. K., Miranda, L. F., Oudmaijer, R. D., Palacios, J., Quirrenbach, A., Harris, A. W., Rauer, H., Cameron, A., Deeg, H. J., Garzón, F., Penny, A., Schneider, J., Tsapras, Y., & Wesselius, P. R. 2001, A&A, 378, 116
- Munari et al. (2005) Munari, U., Sordo, R., Castelli, F., & Zwitter, T. 2005, A&A, 442, 1127
- Pogodin (1994) Pogodin, M. A. 1994, A&A, 282, 141
- Porter & Rivinius (2003) Porter, J. M., & Rivinius, T. 2003, PASP, 115, 1153
- Rhee et al. (2007) Rhee, J. H., Song, I., & Zuckerman, B. 2007, ApJ, 671, 616
- Royer (2005) Royer, F. 2005, Memorie della Societa Astronomica Italiana Supplement, 8, 124
- Royer et al. (2002a) Royer, F., Gerbaldi, M., Faraggiana, R., & Gómez, A. E. 2002a, A&A, 381, 105
- Royer et al. (2002b) Royer, F., Grenier, S., Baylac, M.-O., Gómez, A. E., & Zorec, J. 2002b, A&A, 393, 897
- Schütz et al. (2005) Schütz, O., Meeus, G., & Sterzik, M. F. 2005, A&A, 431, 165
- Seidensticker (1989) Seidensticker, K. J. 1989, A&AS, 79, 61
- Shu et al. (1987) Shu, F. H., Adams, F. C., & Lizano, S. 1987, ARA&A, 25, 23
- Sicilia-Aguilar et al. (2006a) Sicilia-Aguilar, A., Hartmann, L., Calvet, N., Megeath, S. T., Muzerolle, J., Allen, L., D’Alessio, P., Merín, B., Stauffer, J., Young, E., & Lada, C. 2006a, ApJ, 638, 897
- Sicilia-Aguilar et al. (2006b) Sicilia-Aguilar, A., Hartmann, L. W., Fürész, G., Henning, T., Dullemond, C., & Brandner, W. 2006b, AJ, 132, 2135
- Siegler et al. (2007) Siegler, N., Muzerolle, J., Young, E. T., Rieke, G. H., Mamajek, E. E., Trilling, D. E., Gorlova, N., & Su, K. Y. L. 2007, ApJ, 654, 580
- Siess et al. (2000) Siess, L., Dufour, E., & Forestini, M. 2000, A&A, 358, 593
- Slettebak et al. (1975) Slettebak, A., Collins, II, G. W., Parkinson, T. D., Boyce, P. B., & White, N. M. 1975, ApJS, 29, 137
- Song et al. (2001) Song, I., Caillault, J.-P., Barrado y Navascués, D., & Stauffer, J. R. 2001, ApJ, 546, 352
- Spangler et al. (2001) Spangler, C., Sargent, A. I., Silverstone, M. D., Becklin, E. E., & Zuckerman, B. 2001, ApJ, 555, 932
- Strom et al. (1989) Strom, K. M., Strom, S. E., Edwards, S., Cabrit, S., & Skrutskie, M. F. 1989, AJ, 97, 1451
- Strom (1972) Strom, S. E. 1972, PASP, 84, 745
- Struve (1931) Struve, O. 1931, ApJ, 73, 94
- The et al. (1994) The, P. S., de Winter, D., & Perez, M. R. 1994, A&AS, 104, 315
- Tucker (1975) Tucker, W. 1975, Radiation processes in astrophysics (Cambridge, Mass., MIT Press, 1975. 320 p.)
- Uzpen et al. (2007) Uzpen, B., Kobulnicky, H. A., Monson, A. J., Pierce, M. J., Clemens, D. P., Backman, D. E., Meade, M. R., Babler, B. L., Indebetouw, R., Whitney, B. A., Watson, C., Wolfire, M. G., Benjamin, R. A., Bracker, S., Bania, T. M., Cohen, M., Cyganowski, C. J., Devine, K. E., Heitsch, F., Jackson, J. M., Mathis, J. S., Mercer, E. P., Povich, M. S., Rho, J., Robitaille, T. P., Sewilo, M., Stolovy, S. R., Watson, D. F., Wolff, M. J., & Churchwell, E. 2007, ApJ, 658, 1264
- Uzpen et al. (2005) Uzpen, B., Kobulnicky, H. A., Olsen, K. A. G., Clemens, D. P., Laurance, T. L., Meade, M. R., Babler, B. L., Indebetouw, R., Whitney, B. A., Watson, C., Wolfire, M. G., Wolff, M. J., Benjamin, R. A., Bania, T. M., Cohen, M., Devine, K. E., Dickey, J. M., Heitsch, F., Jackson, J. M., Marston, A. P., Mathis, J. S., Mercer, E. P., Stauffer, J. R., Stolovy, S. R., Backman, D. E., & Churchwell, E. 2005, ApJ, 629, 512
- Verhoelst et al. (2007) Verhoelst, T., van Aarle, E., & Acke, B. 2007, A&A, 470, 21
- Viallefond et al. (1983) Viallefond, F., Donas, J., & Goss, W. M. 1983, A&A, 119, 185
- Viallefond & Goss (1986) Viallefond, F., & Goss, W. M. 1986, A&A, 154, 357
- Viallefond et al. (1986) Viallefond, F., Goss, W. M., van der Hulst, J. M., & Crane, P. C. 1986, A&AS, 64, 237
- Vieira et al. (2003) Vieira, S. L. A., Corradi, W. J. B., Alencar, S. H. P., Mendes, L. T. S., Torres, C. A. O., Quast, G. R., Guimarães, M. M., & da Silva, L. 2003, AJ, 126, 2971
- Vink et al. (2002) Vink, J. S., Drew, J. E., Harries, T. J., & Oudmaijer, R. D. 2002, MNRAS, 337, 356
- Voges et al. (2000) Voges, W., Aschenbach, B., Boller, T., Brauninger, H., Briel, U., Burkert, W., Dennerl, K., Englhauser, J., Gruber, R., Haberl, F., Hartner, G., Hasinger, G., Pfeffermann, E., Pietsch, W., Predehl, P., Schmitt, J., Trumper, J., & Zimmermann, U. 2000, VizieR Online Data Catalog, 9029, 0
- Wade et al. (2005) Wade, G. A., Drouin, D., Bagnulo, S., Landstreet, J. D., Mason, E., Silvester, J., Alecian, E., Böhm, T., Bouret, J.-C., Catala, C., & Donati, J.-F. 2005, A&A, 442, L31
- Walker et al. (1989) Walker, H. J., Volk, K., Wainscoat, R. J., Schwartz, D. E., & Cohen, M. 1989, AJ, 98, 2163
- Waters & Waelkens (1998) Waters, L. B. F. M., & Waelkens, C. 1998, ARA&A, 36, 233
- Westin (1985) Westin, T. N. G. 1985, A&AS, 60, 99
- Wright et al. (2003) Wright, C. O., Egan, M. P., Kraemer, K. E., & Price, S. D. 2003, AJ, 125, 359
- Wright & Barlow (1974) Wright, A. E., & Barlow, M. F. 1974, MNRAS, 170, 41
- Yudin (2001) Yudin, R. V. 2001, A&A, 368, 912
- Zhang et al. (2004) Zhang, P., Chen, P. S., & He, J. H. 2004, New Astronomy, 9, 509
- Zhang et al. (2005) Zhang, P., Chen, P. S., & Yang, H. T. 2005, New Astronomy, 10, 325
- Zuckerman (2001) Zuckerman, B. 2001, ARA&A, 39, 549
| Target | HD | Spec. | v sin i | Lines Used | v sin i (Literature) | References |
|---|---|---|---|---|---|---|
| ( km s-1) | (km s-1) | |||||
| G007.2369+01.4894 | 163296 | A1V | 14515 | M | ||
| G008.3752-03.6697 | 167905 | F3V | 355 | F | ||
| G009.4973+05.2441 | 161643 | A7V | 14015 | M | ||
| G011.2691+00.4208 | 165854 | B9V | 22015 | H,M | 25010, 24210 | (1), (2) |
| G014.4239–00.7657 | 165854 | B8 | 16510 | H,M | ||
| G025.6122+01.3020 | 171149 | B9V | 29020 | H,M | 280, 301 | (3), (4) |
| G027.0268+00.7224 | 172030 | A0V | 255 | M | ||
| G036.8722–00.4112 | … | B8V | 29520 | H,M | ||
| G047.3677+00.6199 | 180398 | B8Ve | 31025 | H,M | ||
| G047.4523+00.5132 | 231033 | A0V | 15010 | H,M | ||
| G051.6491–00.1182 | 183035 | A0V | 27020 | H,M | ||
| G229.4514+01.0145 | 58647 | B9V | 29520 | H,M | 118, 280 | (5), (6) |
| G257.6236+00.2459 | 72106 | A0IV | 24025 | M | ||
| G265.5536-03.9951-north(A) | 73461 | A5V | 405 | F | ||
| G265.5536-03.9951-south(B) | … | A6/8V | 255 | F | ||
| G269.5873-05.8882 | 74534 | G0V | 105 | F | 17 | (7) |
| G299.1677-00.3922 | … | B8 | 13010 | H,M | ||
| G299.7090-00.9704 | 107609 | B8/9IV | 17515 | H,M | ||
| G300.0992-00.0627 | … | A1 | 25520 | H,M | ||
| G305.4232-00.8229 | 114757 | B6/8V(E) | 23020 | H,M | ||
| G307.9784-00.7148 | 118094 | B8V(N) | 24020 | H,M | ||
| G310.5420+00.4120 | 121195 | B8IV(N) | 27020 | H,M | ||
| G311.0099+00.4156 | 121808 | A3IV | 23525 | M | ||
| G311.6185+00.2469 | 122620 | B8/9 IV/V | 26520 | H,M | ||
| G314.3136-00.6977 | 126578 | A1IV | 20520 | M | ||
| G321.7868+00.4102 | 135354 | B8VN | 23020 | H,M | ||
| G339.4392–00.7791 | 151228 | A0/1 IV/V | 405 | M | ||
| G339.7415–00.1904 | 151017 | A0 | 24015 | H,M | ||
| G340.0517+00.6687 | 150625 | B8 | 23015 | H,M | ||
| G347.3777+04.2010 | 152404 | F5V | 155 | F | ||
| 22252 | B8V | 25520 | M | 249 | (8) | |
| 48757 | A0V | 305 | M | 27 | (8) | |
| 50853 | A0V | 20520 | M | 195 | (8) | |
| 181454 | B8V | 8010 | H,M | 75 | (9) | |
| 100673 | B9Ve | 15015 | M | 160,125 | (8), (9) | |
| 97277 | A2IV | 555 | M | 45 | (9) | |
| 83953 | B6V | 28520 | H,M | 260 | (9) | |
| 95370 | A3IV | 9510 | M | 86, 90 | (8), (9) | |
| 83754 | B5V | 19020 | H,M | 150 | (9) | |
| 98718 | B5Vn | 32535 | H | 280 | (9) | |
| 90994 | B6V | 10510 | H,M | 80 | (9) | |
| 78045 | A3V | 50 5 | M | 34, 25 | (8), (9) | |
| 83446 | A5V | 13515 | M | 133, 125 | (8), (9) |
Note. — See Uzpen et al. (2007) for further information about GLIMPSE or MSX Catalog ID. Line profiles used to derive projected rotational velocities are M for Mg II 4481, H for H I 4471 and F for Fe I 4476. (1) Halbedel (1996); (2) Yudin (2001); (3) Abt & Morrell (1995); (4) Royer et al. (2002b); (5) Mora et al. (2001); (6) Grady et al. (1996); (7) Cutispoto et al. (2003); (8) Royer et al. (2002a); (9) Slettebak et al. (1975)
| ID | Spec. | Teff |
|---|---|---|
| (K) | ||
| (1) | (2) | (3) |
| G007.2369+01.4894 | A1V | 10350230 |
| G008.3752-03.6697 | F3V | 7260160 |
| G009.4973+05.2441 | A7V | 8320130 |
| G011.2691+00.4208 | B9V | 12350520 |
| G014.4239–00.7657 | B8 | 16460640 |
| G025.6122+01.3020 | B9V | 12520510 |
| G027.0268+00.7224 | A0V | 10510300 |
| G036.8722–00.4112 | B8V | 11740260 |
| G047.3677+00.6199 | B8Ve | 15700600 |
| G047.4523+00.5132 | A0V | 12260510 |
| G051.6491–00.1182 | A0V | 13100530 |
| G229.4514+01.0145 | B9V | 10220390 |
| G257.6236+00.2459 | A0IV | 11530300 |
| G265.5536-03.9951-A | A5V | 7040170 |
| G265.5536-03.9951-B | A6/8V | 7660140 |
| G269.5873-05.8882a | G0III | … |
| G299.1677-00.3922 | B8 | 16170730 |
| G299.7090-00.9704 | B8/9IV | 12520505 |
| G300.0992-00.0627 | A1 | 13510510 |
| G305.4232-00.8229 | B6/8V(E) | 13520510 |
| G307.9784-00.7148 | B8V (N) | 13220520 |
| G310.5420+00.4120 | B8IV(N) | 12430510 |
| G311.0099+00.4156 | A3IV | 9800130 |
| G311.6185+00.2469 | B8/9 IV/V | 10540255 |
| G314.3136-00.6977 | A1IV | 9870130 |
| G321.7868+00.4102 | B8V N | 12340505 |
| G339.4392–00.7791 | A0/1 IV/V | 8800150 |
| G339.7415–00.1904 | A0 | 12220510 |
| G340.0517+00.6687 | B8 | 14080520 |
| G347.3777+04.2010b | F5V | … |
Note. — (a) This star is a giant. See §8 for further details. (b) This star is a spectroscopic binary. Equivalent width measurements vary too greatly to determine temperature. See §8 for further details.
| ID | Spec. Type | Date | EW(H) | EW(H) | EW(H) | R0 Flux | H Flux | H Profile |
|---|---|---|---|---|---|---|---|---|
| (Å) | (Å) | (Å) | (erg cm-2 s-1 Å-1) | (erg cm-2 s-1) | ||||
| (1) | (2) | (3) | (4) | (5) | (6) | (7) | (8) | (9) |
| G007.2369+01.4894 | A1V | 20060928 | -26.150.15 | … | … | 1.4210-11 | … | S |
| G008.3752-03.6697 | F3V | 20060928 | -0.170.08 | … | … | 2.1210-12 | … | P |
| G009.4973+05.2441 | A7V | 20060928 | 5.110.02 | … | … | 2.5210-14 | … | A |
| G011.2691+00.4208 | B9V | 20060927 | -4.240.16 | 9.62 | -13.860.16 | 1.3010-12 | 1.8010-11 | D |
| G014.4239-00.7657 | B8 | 20060927 | 4.450.03 | … | 0.00 | 1.4010-13 | … | A |
| G025.6122+03.3020 | B9V | 20060928 | 6.420.09 | … | … | 5.9910-12 | … | A |
| G027.0268+00.7224 | A0V | 20070407 | -1.970.43 | 11.89 | -13.860.43 | 1.7410-12 | 2.4110-11 | D |
| G036.8722-00.4112 | B8V | 20060927 | -2.390.15 | 12.68 | -15.070.15 | 1.6810-12 | 2.5310-11 | D |
| G047.3677+00.6199 | B9Ve | 20060927 | -14.080.24 | 8.39 | -22.470.24 | 1.7910-12 | 4.0210-11 | D |
| G047.4523+00.5132 | A0V | 20060927 | 6.490.02 | … | 0.00 | 5.1210-13 | … | A |
| G051.6491-00.1182 | A0V | 20060928 | 5.760.15 | 8.65 | -2.890.15 | 1.3010-12 | 3.7610-12 | D |
| G229.4514+01.0145 | B9V | 20060926 | -7.820.45 | … | … | 8.6610-12 | … | D |
| G257.6236+00.2459 | A0IV | 20060926 | 9.410.06 | … | … | 1.0310-12 | … | A |
| G265.5536-03.9951-A | A5V | 20060927 | 3.770.06 | … | … | 2.3610-12 | … | A |
| G265.5536-03.9951-B | A6/8V | 20060927 | 4.930.11 | … | … | 7.0110-13 | … | A |
| G269.5873-05.8882 | G0III | 20060926 | 2.120.03 | … | … | 1.0410-12 | … | A |
| G299.1677-00.3922 | B8 | 20070407 | -4.370.12 | 9.62 | -13.990.12 | 5.5110-13 | 7.7110-12 | D |
| G299.7090-00.9704 | B8/9IV | 20070407 | -1.990.16 | 8.13 | -10.120.16 | 5.3610-13 | 5.4210-12 | D |
| G300.0992-00.0627 | A1 | 20070407 | -13.890.32 | 7.76 | -21.650.32 | 2.4110-13 | 5.2210-12 | D |
| G305.4232-00.8229 | B6/8V(E) | 20070407 | -14.220.42 | 7.76 | -21.980.42 | 7.3410-13 | 1.6110-11 | D |
| G307.9784-00.7148 | B8V(N) | 20070407 | -4.630.69 | 8.64 | -13.270.69 | 1.6210-12 | 2.1510-11 | D |
| G310.5420+00.4120 | B8IV(N) | 20070407 | -0.090.09 | 9.88 | -9.970.09 | 6.8810-13 | 6.8610-12 | D |
| G311.0099+00.4156 | A3IV | 20070407 | 5.210.03 | … | 0.00 | 1.6710-12 | … | A |
| G311.6185+00.2469 | B8/9IV/V | 20070407 | 1.960.23 | 12.86 | -10.900.23 | 3.1210-13 | 3.4010-12 | D |
| G314.3136-00.6977 | A1IV | 20070407 | 4.200.29 | 16.83 | -12.630.29 | 9.4110-13 | 1.1910-11 | D |
| G321.7686+00.4102 | B8V N | 20070407 | -16.930.53 | 9.88 | -26.810.53 | 5.8810-13 | 1.5810-11 | D |
| G339.4392-00.7791 | A0/1IV/V | 20060927 | 3.280.76 | 14.48 | -11.200.76 | 8.5810-13 | 9.6110-12 | D |
| G339.7415-00.1904 | A0 | 20060927 | 5.500.03 | … | 0.00 | 4.1510-13 | … | A |
| G340.0517+00.6687 | B8 | 20060927 | -31.620.08 | 7.76 | -39.380.03 | 1.1710-12 | 4.6110-11 | D |
| G347.3777+04.2010 | B8 | 20060927 | -0.020.10 | … | … | 2.0810-12 | … | IP |
Note. — (5) H equivalent width of the nearest stellar model. This equivalent width was then used to determine EW(H) and subsequently calculate the H flux. (7) The reddening corrected R flux. (8) H flux was determined only for GLIMPSE mid-IR excess stars with 24 m measurements and H emission. (9) D: double-peaked profile, A: absorption only profile, S: single emission only profile, P: P-Cygni profile, IP: inverse P-Cygni profile.
| ID | H Emission | Paschen Emission | Ca II Emission | O I 8446 Emission | O I 7772 Absorption | Fe II Emission |
|---|---|---|---|---|---|---|
| (1) | (2) | (3) | (4) | (5) | (6) | (7) |
| G007.2369+01.4894 | y | n | y | y | s | n |
| G008.3752-03.6697 | y | n | n | n | s | n |
| G009.4973+05.2441 | n | n | n | n | n | n |
| G011.2691+00.4208 | y | n | n | n | n | n |
| G014.4239-00.7657 | n | n | n | n | s | n |
| G025.6122+01.3020 | n | n | n | n | n | n |
| G027.0268+00.7224 | y | y | y | y | e | y |
| G036.8722-00.4112 | y | n | n | n | n | n |
| G047.3677+00.6199 | y | n | n | y | n | n |
| G047.4523+00.5132 | n | n | n | n | s | n |
| G051.6491-00.1182 | y | n | n | n | n | n |
| G229.4514+01.0145 | y | n | y | y | s | y |
| G257.6236+00.2459 | n | n | n | n | n | n |
| G265.5536-03.9951-A | n | n | n | n | s | n |
| G265.5536-03.9951-B | n | n | n | n | n | n |
| G269.5873-05.8882a | n | n | n | n | N/A | n |
| G299.1677-00.3922 | y | y | n | y | e | n |
| G299.7090-00.9704 | y | n | n | n | n | n |
| G300.0992-00.0627 | y | n | n | y | e | n |
| G305.4232-00.8229 | y | n | n | y | e | n |
| G307.9784-00.7148 | y | n | n | y | n | n |
| G310.5420+00.4120 | y | n | n | n | s | n |
| G311.0099+00.4156 | n | n | n | n | s | n |
| G311.6185+00.2469 | y | n | n | n | n | n |
| G314.3136-00.6977 | y | n | n | n | s | n |
| G321.7868+00.4102 | y | y | n | y | e | y |
| G339.4392-00.7791 | y | n | n | n | n | n |
| G339.7415-00.1904 | n | n | n | n | n | n |
| G340.0517+00.6687 | y | y | n | y | e | y |
| G347.3777+04.2010b | y | n | n | n | N/A | n |
Note. — (2) Stars that exhibit H in emission are denoted by (y). (3) Stars with Paschen lines in emission are denoted by (y). (4) Stars that exhibit Ca II IR triplet emission are denoted by (y). (5) Stars that exhibit O I 8446 Å in emission are noted by (y) (6) Stars that are shown to have O I 7772 Å in absorption stronger than stellar models predict are denoted by (s), those that exhibit it in emission (e), and those that exhibit absorption are denoted by (n). G269.5873-05.8882 and G347.3777+04.2010 are listed as N/A because we do not determine their stellar temperature and cannot make a comparison to stellar models. (7) Stars that exhibit Fe II emission are denoted by (y). (a) Spectral features indicate that this star is a giant. See §8 for further details. (b) This star is a spectroscopic binary. See §8 for further details.
| ID | Distance | Adopted MBol | Age Derived | Age in Literature |
|---|---|---|---|---|
| (pc) | [mag] | (log yr) | (log yr) | |
| (1) | (2) | (3) | (4) | (5) |
| G007.2369+01.4894 | 122 | -1.15 | 6.13-6.63, 8.04-8.27 | 6.70a |
| G009.4973+05.2441 | 137 | 1.27 | 6.65-6.95, 8.42-8.74 | … |
| G025.6122+01.3020 | 114 | -0.10 | 7.09-8.09 | … |
| G036.8722–00.4112 | 424 | -1.53 | 6.11-6.32, 8.10-8.20 | … |
| G047.3677+00.6199 | 353 | -2.05 | 6.87-7.72 | … |
| G047.4523+00.5132 | 909 | -2.00 | 6.11-6.37, 7.58-8.19 | … |
| G051.6491–00.1182 | 345 | -0.98 | 6.13-8.05 | … |
| G229.4514+01.0145 | 277 | -2.25 | 6.09-6.43, 8.37-8.43 | |
| G257.6236+00.2459 | 288 | -0.13 | 6.26-6.55, 7.33-8.24 | |
| G265.5536–03.9951-Ab | 139 | 0.70 | 6.81-6.83 | … |
| G265.5536–03.9951-Bb | 139 | 1.85 | 6.81-6.83 | … |
| G305.4232–00.8229c | 1009 | -3.050.45 | 5.88, 7.87-7.95 | |
| G307.9784–00.7148 | 758 | -3.04 | 6.00-6.23, 7.66-8.03 | 8.030.04d |
| G311.6185+00.2469e | 965 | -1.13 0.50 | 6.08-6.18, 8.16-8.18 | 8.275f |
| G321.7868+00.4102g | 1010 | -2.090.51 | 5.83-6.12, 8.01-8.13 | … |
| G340.0517+00.6687g | 830 | -3.140.14 | 5.62-5.85, 7.81-7.90 | … |
| G347.3777+04.2010 | … | … | … | 7.23h |
Note. — (a) (Mannings & Sargent 1997); (b) Assuming both stars to be coeval only a 2.2 and 2.0 binary is possible given temperature measurements. (c) Utilizing Seidensticker (1989) extinction and absolute visual magnitude measurements (d) (Levenhagen & Leister 2004) (e) Utilizing Westin (1985) absolute visual magnitude. (f) Westin (1985); (g) Utilizing Kozok (1985); (h) Chen et al. (2005)
| ID | [24] Flux | [24] errora | Excess flux at [24] | Free-free component | free-free | excess | Excess Type |
|---|---|---|---|---|---|---|---|
| (mJy) | (mJy) | (mJy) | (mJy) | ||||
| (1) | (2) | (3) | (4) | (5) | (6) | (7) | (8) |
| G011.2691+00.4208 | 18.4 | 2.7 | 13.1 | 6.0 | 4621 | 2.6 | I |
| G014.4239–00.7657 | 71.9 | 13.7 | 71.2 | … | … | 5.2 | III |
| G027.0268+00.7224 | 17.7 | 2.1 | 8.7 | 8.5 | 9824 | 0 | I |
| G036.8722–00.4112 | 21.7 | 2.2 | 16.3 | 7.4 | 4513 | 4.0 | II |
| G047.3677+00.6199 | 44.6 | 4.5 | 38.9 | 12.1 | 3112 | 6.0 | II |
| G047.4523+00.5132 | 8.5 | 1.1 | 6.3 | … | … | 5.5 | III |
| G051.6491–00.1182 | 17.8 | 2.8 | 12.7 | 6.1 | 4822 | 2.4 | I |
| G299.1677–00.3922 | 7.0 | 0.8 | 5.4 | 5.6 | 10415 | 0 | I |
| G299.7090–00.9704 | 5.1 | 0.5 | 3.1 | 1.9 | 6116 | 2.4 | I |
| G300.0992–00.0627 | 7.3 | 0.8 | 6.1 | 1.7 | 2813 | 5.5 | II |
| G305.4232–00.8229 | 16.7 | 1.8 | 14.2 | 5.1 | 3613 | 5.1 | II |
| G307.9784–00.7148 | 21.5 | 2.2 | 16.1 | 7.0 | 4314 | 4.1 | II |
| G310.5420+00.4120 | 5.6 | 0.7 | 3.3 | 2.3 | 7021 | 1.4 | I |
| G311.0099+00.4156 | 149.4 | 17.9 | 140.9 | … | … | 7.9 | III |
| G311.6185+00.2469 | 8.6 | 1.5 | 7.4 | 1.2 | 1620 | 4.1 | II |
| G314.3136–00.6977 | 22.8 | 2.3 | 17.8 | 4.0 | 2213 | 6.0 | II |
| G321.7868+00.4102 | 12.6 | 1.3 | 10.7 | 5.0 | 4712 | 4.4 | II |
| G339.4392–00.7791b,c | 7.7 | 1.5 | … | … | … | … | … |
| G339.7415–00.1904b | 5.4 | 0.8 | 4.4 | … | … | 5.5 | III |
| G340.0517+00.6687b | 31.6 | 3.4 | 26.9 | 14.4 | 5414 | 3.7 | II |
Note. — (7) Determined by removing the free-free component from the [24] excess and dividing by the [24] error with 10 calibration uncertainty error added in quadrature with measured error. (a) [24] flux measurement error with 10 calibration uncertainty error added in quadrature with measured error. (b) found to have no real excess at [24]. (c) New measurement, not in (Uzpen et al. 2007).
| ID | -8 | 8-24 | Disk Temperature | EW(H) | Teff | v sin i | Evolutionary Status | |
|---|---|---|---|---|---|---|---|---|
| [mag] | [mag] | (K) | (Å) | (K) | (km s-1) | |||
| (1) | (2) | (3) | (4) | (5) | (6) | (7) | (8) | (9) |
| G007.2369+01.4894 | … | … | 493 | 0.14 | -26.150.15a | 10350230 | 14515 | H |
| G008.3752–03.6697 | … | … | 566 | 0.20 | -0.170.08a | 7260160 | 355 | TT |
| G009.4973+05.2441 | … | … | … | … | 5.110.02a | 8320130 | 14015 | |
| G011.2691+00.4208 | 0.34 | 1.01 | … | … | -13.860.16 | 12350520 | 22015 | Be |
| G014.4239–00.7657 | 0.47 | 4.78 | 191 | 0.013 | 4.450.03 | 16900800 | 16510 | T |
| G025.6122+01.3020 | … | … | … | … | 6.420.09 | 12520510 | 29020 | |
| G027.0268+00.7224 | 0.34 | 0.56 | … | … | -13.890.43 | 10510300 | 255 | Be |
| G036.8722–00.4112 | 0.27 | 1.26 | 427 | 0.00072 | -15.070.15 | 11740260 | 29520 | T |
| G047.3677+00.6199 | 0.93 | 1.24 | 783 | 0.0028 | -22.470.24 | 15700600 | 31025 | T/Be |
| G047.4523+00.5132 | 0.29 | 1.25 | 355 | 0.0012 | 6.490.02 | 12260510 | 15010 | D |
| G051.6491–00.1182 | 0.19 | 1.12 | … | … | -2.890.15 | 13100530 | 27020 | Be |
| G229.4514+01.0145 | … | … | 579 | 0.058 | -7.820.45a | 10220390 | 29520 | H |
| G257.6236+00.2459 | … | … | 404 | 0.12 | 9.410.06a | 11530300 | 24025 | H |
| G265.5536–03.9951-A | … | … | … | … | 4.930.11a | 7660140 | 255 | |
| G265.5536–03.9951-B | … | … | … | … | 3.770.06a | 7040170 | 405 | |
| G269.5873–05.8882 | … | … | … | … | 2.120.03a | … | 105 | |
| G299.1677–00.3922 | 0.35 | 1.18 | … | … | -13.990.12 | 164501030 | 13010 | Be |
| G299.7090–00.9704 | 0.18 | 0.81 | … | … | -10.120.16 | 12520505 | 17515 | Be |
| G300.0992–00.0627 | 0.56 | 1.36 | 526 | 0.0021 | -21.650.32 | 13510510 | 25520 | T/Be |
| G305.4232–00.8229 | 0.79 | 1.27 | 675 | 0.0038 | -21.980.42 | 13520510 | 23020 | T/Be |
| G307.9784–00.7148 | 0.40 | 1.06 | 557 | 0.00090 | -13.270.69 | 13220520 | 24020 | T/Be |
| G310.5420+00.4120 | 0.25 | 0.70 | … | … | -9.970.09 | 12430510 | 27020 | Be |
| G311.0099+00.4156 | 0.37 | 2.79 | 315 | 0.0027 | 5.210.03 | 9800130 | 23525 | D |
| G311.6185+00.2469 | 0.28 | 1.82 | 306 | 0.0012 | -10.900.23 | 10540255 | 26520 | T |
| G314.3136–00.6977 | 0.22 | 1.45 | 328 | 0.00096 | -12.630.29 | 9870130 | 20520 | T |
| G321.7868+00.4102 | 0.77 | 1.25 | 556 | 0.0021 | -26.810.53 | 12340505 | 23020 | H |
| G339.4392–00.7791b | … | … | … | … | -11.200.76 | 8800150 | 405 | … |
| G339.7415–00.1904 | 0.27 | 1.93 | 311 | 0.0010 | 5.500.03 | 12220510 | 24015 | D |
| G340.0517+00.6687 | 1.11 | 1.04 | 823 | 0.015 | -39.380.08 | 14080520 | 23015 | H |
| G347.3777+04.2010 | … | … | 487 | 0.13 | -0.020.10a | … | 155 | TT/T |
Note. — (9) H: Herbig AeBe star, TT: T-Tauri star, T: Transitional disk, D: Debris disk, Be: Excess due to free-free emission and therefore a classical Be-type star, : additional measurements are needed to classify the nature of the IR excess. (a) This value is EW(H), uncorrected for underlying stellar absorption. (b) The [8.0] excess from Uzpen et al. (2007) is not confirmed at [24].
| ID | Criterion 1 | Criterion 2 | Criterion 3 | Classical Be |
|---|---|---|---|---|
| (1) | (2) | (3) | (4) | (5) |
| G007.2369+01.4894 | n | n | y | n |
| G027.0268+00.7224 | y | y | N/A | y |
| G047.3677+00.6199 | N/A | N/A | n | n |
| G229.4514+01.0145 | n | n | y | n |
| G299.1677-00.3922 | N/A | y | N/A | y |
| G300.0992-00.0627 | N/A | n | n | n |
| G305.4232-00.8229 | N/A | n | n | n |
| G307.9784-00.7148 | N/A | n | n | n |
| G321.7868+00.4102 | n | y | n | n |
| G340.0517+00.6687 | n | y | n | n |
Note. — (2) Criterion 1: Stars with Ca II in emission and Paschen in emission are denoted by y. Stars with Ca II in emission without Paschen emission are denoted by n. Stars without Ca II emission are denoted by N/A. (3) Criterion 2: Stars with O I in emission and Paschen in emission are denoted by y. Stars with O I in emission and Paschen in absorption are denoted by n. Stars without O I in emission are denoted by N/A. (4) Criterion 3: Stars with [8.0] excess 0.55 magnitudes with Ca II in emission are denoted by y. Stars with [8.0] excess 0.55 magnitudes without Ca II are denoted by n. Stars without [8.0] excess 0.55 magnitudes are denoted by N/A. (5) Stars with criterion 1, 2, and/or 3 with y only are consistent with classical Be stars.