A New Distance to The Antennae Galaxies (NGC 4038/39) Based on the Type Ia
Supernova 2007sr11affiliation: Based in part on observations with the 6.5 m Magellan
Telescopes located at Las Campanas Observatory, Chile.
Abstract
Traditionally, the distance to NGC 4038/39 has been derived from the systemic recession velocity, yielding about 20 Mpc for km s-1 Mpc-1. Recently, this widely adopted distance has been challenged based on photometry of the presumed tip of the red giant branch (TRGB), which seems to yield a shorter distance of Mpc and, with it, nearly 1 mag lower luminosities and smaller radii for objects in this prototypical merger. Here we present a new distance estimate based on observations of the Type Ia supernova (SN) 2007sr in the southern tail, made at Las Campanas Observatory as part of the Carnegie Supernova Project. The resulting distance of Mpc [ mag] is in good agreement with a refined distance estimate based on the recession velocity and the large-scale flow model developed by Tonry and collaborators, Mpc. We point out three serious problems that a short distance of 13.3 Mpc would entail, and trace the claimed short distance to a likely misidentification of the TRGB. Reanalyzing Hubble Space Telescope (HST ) data in the Archive with an improved method, we find a TRGB fainter by 0.9 mag and derive from it a preliminary new TRGB distance of Mpc. Finally, assessing our three distance estimates we recommend using a conservative, rounded value of Mpc as the best currently available distance to The Antennae.
Subject headings:
galaxies: distances and redshifts — galaxies: individual (NGC 4038, NGC 4039) — galaxies: interactions — supernovae: individual (SN 2007sr)1. INTRODUCTION
The Antennae (NGC 4038/39) are the nearest example of a major merger involving two gas-rich disk galaxies of comparable mass. They allow us to study processes of dissipational galaxy assembly from close up, thus providing a valuable glimpse of what must have been more frequent events in the early universe. The Antennae have been observed extensively at all wavelengths (e.g., X-rays: Fabbiano et al. 2004; UV: Hibbard et al. 2005; optical: Whitmore et al. 1999; IR: Gilbert & Graham 2007; and 21-cm line: Hibbard et al. 2001) and have also been repeatedly modeled via N-body and hydrodynamical simulations (e.g., Toomre & Toomre, 1972; Barnes, 1988; Mihos et al., 1993; Hibbard, 2003). An accurate distance to this prototypical merger is of obvious importance in assessing its structure and dynamics, as well as for determining the physical properties of its myriad of stars, star clusters, peculiar objects such as ULXs (ultraluminous X-ray sources), and gas clouds.
Traditionally, the distance to NGC 4038/39 has most often been derived from the systemic recession velocity and an adopted Hubble constant , with or without corrections for deviations of the Hubble flow from linearity due to various attractors. A frequently used modern value for the distance is 19.2 Mpc (Whitmore et al., 1999). This value is based on a systemic recession velocity relative to the Local Group of km s-1(Whitmore & Schweizer, 1995; de Vaucouleurs et al., 1991), a linear Hubble flow, and km s-1 Mpc-1. Updated to the HST Key Project’s derived km s-1 Mpc-1 (Freedman et al., 2001), this often-used distance to The Antennae becomes Mpc.
A significantly shorter distance of Mpc has recently been determined by Saviane et al. (2008) via photometry of the TRGB in a region near the tip of the southern tidal tail. This photometry—performed on new, deep images obtained with HST ’s Advanced Camera for Surveys (ACS)—seems to support the short distance derived earlier from HST/WFPC2 images of the same region by the same method (Saviane et al., 2004). If the short distance is correct, The Antennae “diminish” in physical size, mass, and luminosity, as do their stars, clusters, and gas clouds. However, their recession velocity then deviates from the best large-scale-flow model (Tonry et al., 2000, hereafter TBAD00) by about 500 km s-1 or 2.7 (Saviane et al., 2008).
Clearly, new measurements of the distance to The Antennae by independent methods are highly desirable. In the present paper we derive a new distance from observations of the Type Ia SN 2007sr, which appeared in the midsection of the southern tail in 2007 December. Section 2 presents our observations, data analysis, and new distance. Section 3 discusses problems with the short distance and points out a likely error in the identification of the true TRGB by Saviane et al. (2008). Finally, § 4 presents our conclusions and recommendation.
2. A NEW DISTANCE FROM SN 2007sr
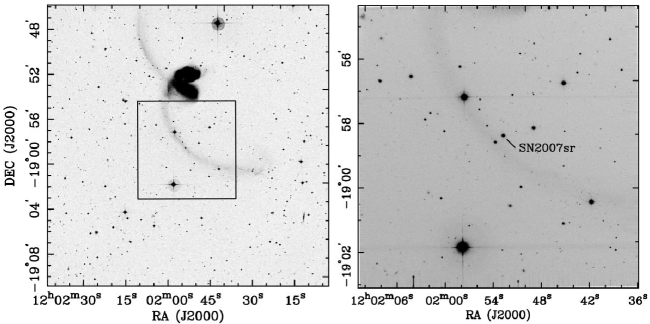
Supernova 2007sr was discovered by the Catalina Sky Survey on 2007 December 18.53 UT (Drake et al., 2007), about 4.2 days after maximum (Umbriaco et al., 2007; Pojmanski et al., 2008). Since it was of Type Ia (Naito et al., 2007; Umbriaco et al., 2007), it was followed by the Carnegie Supernova Project (CSP) as part of their low-z campaign (Hamuy et al., 2006), with observations beginning on 2007 December 20.33 UT. Figure 1 shows the SN on a stacked image obtained with the Swope 1 m telescope at Las Campanas Observatory.
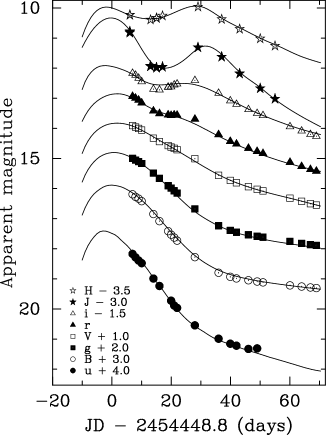
The CSP measured light curves for the SN using the filter set from 6 days until approximately 130 days after maximum. Appendix A gives some details about the photometric system and calibration, while its Table 1 lists all measured magnitudes and their uncertainties.
It is now well known that supernovae of Type Ia (SN Ia) can serve as excellent standard candles and have been used to both discover the presence (Riess et al., 1998; Perlmutter et al., 1999) and constrain the nature of dark energy (Knop et al., 2003; Astier et al., 2006; Clocchiatti et al., 2006; Wood-Vasey et al., 2007). Once corrected for extinction and the well-known correlation between intrinsic luminosity and decline rate of the light curve (Phillips, 1993; Hamuy et al., 1996; Riess et al., 1996), SNe Ia have an intrinsic dispersion of approximately mag. We can therefore use SN 2007sr to constrain the distance to NGC 4038/39 to this level.
Because SN 2007sr was caught after maximum, it is necessary to use SN Ia light-curve templates to estimate the peak magnitude in each passband as well as the decline-rate parameter , defined as the change in magnitude between maximum and 15 days later in the rest frame of the SN. This parameter will allow us to correct for the intrinsic luminosity of the SN and also to predict its intrinsic colors, from which we can derive the host galaxy extinction. More formally, we model the light curve in each passband with the following formula:
| (1) |
where is the light-curve template for passband , is the time of maximum for the light curve, is the absolute magnitude in passband of a SN Ia with mag, is the slope of the luminosity– relationship, is the -correction in passband , and is the true distance modulus. The extinctions from the Milky Way and host galaxy are and , respectively. The color excess due to the Milky Way foreground extinction is taken from Schlegel et al. (1998), which for the position of SN 2007sr corresponds to mag.
The values of the parameters and are determined from the set of SNe Ia observed by the CSP in the first-year campaign by assuming a fixed cosmological model ( km s-1 Mpc-1, , and ; Spergel et al. 2007), computing distance moduli from the observed redshifts of the host galaxies, correcting for Milky-Way and host-galaxy extinction, and fitting the resulting absolute peak magnitudes in each passband to the formula
| (2) |
The details of this procedure are given in Folatelli et al. (2008, in preparation).
In performing this calibration, it has become apparent that—for whatever reason—a standard reddening law with the typical Milky Way value of does not provide a good fit to this sample of SNe Ia. Instead, we obtain a value (Folatelli et al. 2008, in preparation). Other groups have also found surprisingly low values of (Astier et al., 2006; Wang et al., 2006). This may be due to the SNe Ia being embedded in an environment that differs significantly from a typical ISM, or perhaps there is another, intrinsic color–magnitude effect at play that has been inadvertently combined with . Whatever the reason, we are interested in a distance determination and therefore appeal to the empirical result . However, we note that changing in equation (LABEL:eq:lc_model) does not only affect the extinction term, but also changes the values of because the calibrating sample has a non-zero average extinction. Indeed, only a SN with an extinction equal to the average extinction of the calibrating sample would be insensitive to changes in . In the case of SN 2007sr, the extinction is slightly larger than for the calibrating sample, whence an increase in would slightly decrease the distance modulus. Specifically, changing from to would change the estimated true distance modulus of this SN by 0.06 mag.
The light-curve templates are constructed in a manner similar to that used by Prieto et al. (2006) and further described in Burns et al. (2008, in preparation). Essentially, the highest-quality optical light curves from the CSP, which have clearly observed maxima, are fit with a cubic spline, from which , , and the peak magnitude are extracted. These light curves then define a sparsely sampled 2D surface in –– space. A template of any given can then be generated by 2D interpolation of this surface. At present, there are an insufficient number of near-infrared (NIR) light curves with which to construct templates in this way. Fortunately, the decline-rate parameter for SN 2007sr ( mag) is nearly identical to that of SN 2006X ( mag), for which the CSP has obtained high-quality NIR photometry well before and after maximum. We therefore use spline fits of the and light curves of SN 2006X as templates for fitting the and data of SN 2007sr.
The light curves of SN 2007sr are shown in Fig. 2 along with the best-fit models for the optical data given by equation (LABEL:eq:lc_model). The extracted light-curve parameters of interest are the true distance modulus of SN 2007sr, mag, the color excess due to the host galaxy, mag, and the decline-rate parameter mag. The value of this parameter is a typical value for SNe Ia, and the color excess is reasonably low as one would expect for a source far from the host center. The uncertainties are derived from the covariance matrix of the fit to the light curves, scaled so that . To be conservative, we add to the uncertainty in the following systematic errors: (1) mag for the intrinsic dispersion in SN Ia luminosities, (2) uncertainties in the calibration parameters of , mag, and , and (3) an uncertainty in the Hubble constant of km s-1 Mpc-1. With this error budget, we arrive at a final distance estimate to SN 2007sr of Mpc ( mag) using the optical data.
As a check on this distance we also fitted the - and -band data with templates generated from SN 2006X in order to estimate the peak magnitudes: and . We then used the calibration by Krisciunas et al. (2004), mag and mag, to compute an average distance modulus of mag. This modulus, based on NIR data and an independent calibration, is nearly insensitive to assumptions about the reddening law of the dust in the host galaxy and agrees with the formal modulus of mag from the optical data to within the combined errors, thus supporting the derived distance of Mpc.
3. PROBLEMS WITH THE SHORT DISTANCE
As we demonstrate below, the new SN Ia distance to NGC 4038/39 agrees well with the distance inferred from the system’s recession velocity and the large-scale flow model by TBAD00. If the short distance of Mpc measured by Saviane et al. (2008) were to be correct, it would create at least three serious problems: (1) NGC 4038/39 would have an exceptionally large peculiar recession velocity of about 522 km s-1; (2) SN 2007sr would have had a peak luminosity differing by 1.1 mag, or about 7 , from the mean peak luminosity of SNe Ia; and (3) The Antennae would lose their membership in Tully’s (1988) Group 22–1 of 13 galaxies. We now discuss these three problems in turn and then point out a likely error in the derivation of the short distance by Saviane et al. (2008).
3.1. Peculiar Recession Velocity
A careful assessment of the many radial velocities measured for NGC 4038/39 and compiled in the NASA/IPAC Extragalactic Database (NED) yields a systemic heliocentric velocity of km s-1. Figure 3 compares this systemic velocity with recession velocities predicted by the large-scale flow model, which is based on surface-brightness fluctuation distances to 300 early-type galaxies (TBAD00). The Antennae are plotted at both the short distance and the new SN Ia distance, while the solid curve represents the predicted large-scale flow velocity in their direction. The undulation in the model curve reflects the gravitational influences of the Virgo Cluster, whose center lies away from The Antennae, and of the Great Attractor. As the figure illustrates, with the new SN Ia distance The Antennae fall within km s-1 or 0.1 of the predicted flow velocity, where km s-1 is the best-fit “thermal” (or random) radial-velocity dispersion of the model. If instead we choose the short distance, the peculiar velocity becomes 522 () km s-1 or 2.8 , clearly an exceptionally high value. We conclude that the newly measured SN Ia distance is in significantly better agreement with the best available large-scale flow model than the short distance is.

3.2. Peak Luminosity of SN 2007sr
Our determination of a distance of Mpc to SN 2007sr has been based on the assumption that this SN reached the mean absolute magnitude typical for its decline rate. The quoted distance error includes a term reflecting the intrinsic dispersion of the corrected peak absolute magnitudes of SNe Ia around the mean value , which is mag for CSP observations of similar quality (§ 2).
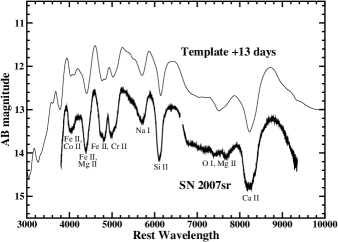
If the short distance of 13.3 Mpc were to be correct, SN 2007sr would have reached a peak absolute magnitude that differed by mag, or about 7 , from the mean value for SNe Ia. This seems quite unlikely, given the spectral normality of SN 2007sr (Naito et al., 2007; Umbriaco et al., 2007). To illustrate this normality, Fig. 4 shows an optical spectrum obtained by the CSP on 2007 December 27.33 UT with the Baade 6.5 m telescope and IMACS spectrograph, corresponding to an epoch of 13 days after maximum. For comparison, we include the SN Ia template spectrum by Hsiao et al. (2007) at +13 days. Although there are small differences between the two spectra, the overall resemblance is extremely close, demonstrating that SN 2007sr was both photometrically and spectroscopically a completely normal SN Ia. Hence, its extraordinarily low peak luminosity (by 7 !), were it to lie at 13.3 Mpc from us, is a second good reason for distrusting the short distance.
3.3. Group Membership
Based on their position in the sky and recession velocity, Tully (1988) assigned The Antennae to Group 22–1 in the Crater Cloud. This group contains 13 galaxies, of which four—besides The Antennae—have measured distances. None of these distances is less than 20 Mpc (Madore & Steer, 2007).
Two early-type galaxies of the group have had their distances measured via both the surface-brightness fluctuation method and the Fundamental-Plane method (Blakeslee et al., 2001; Tonry et al., 2001). The average distance for NGC 4024 (S0) is a rather uncertain Mpc, while that for NGC 4033 (E6) is a more concordant Mpc. Both galaxies lie within 1.0° from The Antennae. Were The Antennae to lie at the short distance of 13.3 Mpc, it would be difficult to understand why two nearby postulated group members with very similar recession velocities (52 and 24 km s-1 relative to The Antennae, respectively) should lie at much larger distances. Again, the evidence favors both the large-scale flow distance of Mpc (see § 4) and our new SN Ia distance of Mpc to The Antennae.

3.4. A Likely Misidentification of the TRGB
Why is the TRGB distance of Mpc determined by Saviane et al. (2008) so discrepant? The answer seems to lie in a misidentification of what constitutes the true TRGB of the mixed-age stellar populations near the tip of the southern tidal tail. The area imaged by Saviane et al. with HST/ACS contains several H II regions (Schweizer, 1978; Mirabel et al., 1992) and a very blue, dwarf-like feature dubbed the “S78 Region” and now recognized to be the bent H I-rich tip of the southern tail (Hibbard et al., 2001).
In their Figure 3, Saviane et al. (2008) display two luminosity functions (LF) for the RGB, one derived for the S78 Region and the other for a “NE Region” that is free of H I and also, supposedly, of relatively young stars. The LF of the S78 Region shows a relatively sharp rise at mag (where is an instrumental magnitude close to the Kron–Cousin magnitude), which Saviane et al. identify as the TRGB but which—given the H I and blue stellar content of the S78 Region—seems equally likely to be caused by relatively young AGB stars. In contrast, the LF of the gas-free NE Region shows only a minor sharp rise there, but features a more significant “discontinuity at mag” (Saviane et al., 2008) that falls within 0.2 mag of the TRGB expected for a distance of 22 Mpc. While Saviane et al. dismiss this discontinuity as possibly “due to the RGB of a younger, 200 Myr population,” we suggest that its stars—being fainter than the claimed TRGB—actually mark the true location of the TRGB.
To check on this suggestion, we downloaded the ACS/WFC (Wide Field Camera) frames obtained under proposal GO-10580 (P.I.: Ivo Saviane) from the HST Archive, reprocessed them, and extracted a calibrated color–magnitude diagram (CMD) for the entire tidal-tail tip region. Our search and photometry algorithms, which use DOLPHOT (for technical details, see Mager et al., 2008), detected about 30,000 stellar objects brighter than mag. Figure 5 (left panel) shows the CMD in a new form proposed by Madore et al. (2008), in which the traditional (or extinction-corrected ) magnitude is replaced by the magnitude for the Red Giant Branch (RGB). This magnitude is a color-corrected -band magnitude specifically designed to be insensitive to varying metallicity and is defined by
| (3) |
where the color slope is chosen to track the known, metallicity-induced run of the magnitude of the TRGB as a function of , and mag is the fiducial color of reference (Madore et al., 2008). By construction, in any – diagram of an old stellar population with a range of metallicities, the TRGB lies at some constant value of .
To locate the TRGB objectively, we selected all stars in the color range and used a Sobel edge-detection kernel (Lee et al., 1993) to filter their numbers (in 0.03 mag bins) as a function of . The resulting filter output, expressed as a ratio between the filter response and local Poisson noise, is shown in the right panel of Fig. 5. In this panel, a peak at a normalized filter response of 2.0 indicates an edge detection at a 2 -level of significance. Figure 5 shows a very clear, 5.4 detection of the TRGB at mag (marked “TRGB”), or about 0.9 mag fainter than the TRGB position of claimed by Saviane et al. (2008). The latter position (at ) corresponds approximately to the broad 3.5 “hump” seen centered on mag in the normalized filter response of Fig. 5. We conclude that Saviane et al. (2008) probably misidentified youngish AGB stars for the true TRGB, in the process overestimating its brightness by about 0.9 mag. This, then, is the likely source of their discrepant Mpc distance.
Our newly determined mag yields a true distance modulus to The Antennae of approximately mag, where mag is the absolute magnitude for the TRGB of Cen (Bellazzini et al., 2004) and holds at the fiducial color of reference (Madore et al., 2008). This distance modulus, which is corrected for Milky Way foreground extinction via [equation (3)], but not for (varying) extinction within the tidal-tail tip region, corresponds to a linear distance of Mpc. We postpone a more elaborate determination of , including a careful assessment of local extinction and any possible small biases due to the presence of young stellar populations, to a future paper dedicated to that subject. However, note that Mpc agrees with both Mpc (§ 2) and Mpc (§ 4) to within the combined errors, while it strongly disagrees with the short distance of Mpc derived by Saviane et al. (2008). Thus, also supports the new SN Ia distance.
4. CONCLUSIONS
We have presented light curves of SN 2007sr beginning 6 days after maximum and obtained during four months by the Carnegie Supernova Project. Analysis of these light curves in conjunction with SNe Ia data from the first-year campaign by the Project yields a formal true distance modulus of mag. With all known systematic errors and uncertainties included, this distance modulus becomes mag, corresponding to a distance of Mpc to NGC 4038/39. (Differential depth effects between SN 2007sr and the center of mass of the galaxies are negligible).
This new SN Ia distance agrees well with the distance Mpc estimated from the systemic recession velocity of The Antennae and the large-scale flow model by TBAD00, where the quoted error reflects the cosmic random radial velocity ( km s-1) of the model. On the other hand, disagrees strongly with the short distance of Mpc estimated by Saviane et al. (2008) from the TRGB. We have discussed three serious problems with such a short distance, and have pointed out the likely misidentification of the TRGB by these authors as the cause of the short distance.
Reprocessing their HST/ACS frames and using an improved method of TRGB detection, we have located what we believe to be the true TRGB at mag, fully 0.9 mag below (i.e., fainter than) the TRGB claimed by Saviane et al. Analyzing photometry of this new, fainter TRGB we have derived a preliminary distance of Mpc.
Clearly, additional distance estimates to The Antennae (e.g., from Cepheids, planetary nebulae, etc.) will be very valuable. However, for the moment we see no reason for adopting any distance shorter than 20 Mpc. Given the concordant new Mpc and recession-velocity based Mpc, both supported by our new, preliminary Mpc, we recommend using a conservative, rounded value of Mpc as the best currently available distance to The Antennae.
Appendix A Photometry of SN 2007sr
The magnitudes for SN 2007sr presented in this paper are on the CSP natural system. Details of the data reduction, calibration, and filter functions and color terms defining this natural system can be found in Hamuy et al. (2006) and Contreras et al. (2008, in preparation), as well as on the CSP website: http://csp1.lco.cl/~cspuser1. In this Appendix, we briefly outline the natural system and present a table of the photometry for SN 2007sr.
The magnitudes are calibrated via the Smith et al. (2002) standard stars. A color sequence of these stars is used to establish color terms that transform our instrumental magnitudes to the standard system of Smith et al. (2002). However, since SNe Ia have spectra that are very different from those of normal stars and evolve with age, these color terms cannot be used to transform the SN magnitudes to the standard system. Instead, we use the color terms in reverse to transform the standard magnitudes to our natural system, and then calibrate our SN observations using these natural magnitudes. It is in this system that we present the photometry of SN 2007sr and perform our entire analysis.
The magnitudes are treated in a similar way, though using the system of Landolt (1992) standard stars. The magnitudes are calibrated using the Persson et al. (1998) standards, for which the instrument and filters used were nearly identical to those employed by the CSP and, therefore, were equivalent to our natural system.
Table 1 presents the photometry for SN 2007sr in the CSP natural system. The listed uncertainties include the usual photon statistics as well as errors in the zero points.
| JD 2,453,000 | ||||||||
|---|---|---|---|---|---|---|---|---|
| 1454.84 | … | … | … | … | … | … | 13.776(0.019) | 13.723(0.005) |
| 1455.76 | 14.133(0.013) | 12.999(0.004) | 12.924(0.005) | 13.664(0.006) | 13.165(0.005) | 12.856(0.005) | … | … |
| 1456.76 | 14.241(0.014) | 13.051(0.004) | 12.983(0.006) | 13.733(0.007) | 13.251(0.007) | 12.904(0.006) | … | … |
| 1457.80 | 14.345(0.009) | 13.101(0.004) | 13.047(0.005) | 13.826(0.005) | 13.310(0.006) | 12.947(0.005) | … | … |
| 1458.84 | 14.429(0.012) | 13.168(0.008) | 13.136(0.009) | 13.942(0.010) | 13.390(0.007) | 13.000(0.008) | … | … |
| 1461.82 | … | … | … | … | … | … | 14.912(0.017) | 13.878(0.004) |
| 1462.80 | 14.936(0.010) | 13.484(0.005) | 13.406(0.005) | 14.190(0.006) | 13.810(0.006) | 13.265(0.006) | … | … |
| 1463.84 | … | … | … | … | … | … | 14.971(0.006) | 13.837(0.004) |
| 1464.84 | 15.180(0.012) | 13.665(0.007) | 13.498(0.007) | 14.216(0.009) | 14.040(0.008) | 13.389(0.005) | … | … |
| 1465.87 | … | … | … | … | … | … | 14.959(0.007) | 13.767(0.007) |
| 1467.77 | … | 13.910(0.006) | 13.540(0.004) | 14.130(0.004) | 14.367(0.007) | 13.537(0.006) | … | … |
| 1468.77 | 15.662(0.018) | 13.986(0.006) | 13.556(0.006) | 14.107(0.007) | 14.470(0.006) | 13.591(0.006) | … | … |
| 1469.80 | 15.819(0.016) | 14.083(0.005) | 13.544(0.004) | 14.049(0.006) | 14.571(0.006) | 13.640(0.006) | … | … |
| 1470.79 | 15.898(0.017) | 14.161(0.006) | 13.552(0.006) | 14.021(0.006) | 14.671(0.007) | 13.686(0.006) | … | … |
| 1471.87 | … | … | … | … | … | … | 14.708(0.007) | 13.534(0.007) |
| 1476.78 | 16.478(0.013) | 14.696(0.006) | 13.690(0.004) | 13.906(0.006) | 15.206(0.006) | 14.011(0.006) | … | … |
| 1477.84 | … | … | … | … | … | … | 14.313(0.006) | 13.469(0.005) |
| 1484.78 | 16.924(0.029) | 15.252(0.008) | 14.206(0.007) | 14.331(0.009) | 15.728(0.010) | 14.574(0.010) | … | … |
| 1485.82 | … | … | … | … | … | … | 14.630(0.009) | 13.880(0.008) |
| 1488.73 | 17.086(0.048) | 15.407(0.008) | 14.429(0.006) | 14.583(0.007) | 15.863(0.011) | 14.734(0.006) | … | … |
| 1490.79 | 17.150(0.013) | 15.466(0.005) | 14.517(0.004) | 14.699(0.004) | 15.917(0.008) | 14.814(0.005) | … | … |
| 1491.88 | … | … | … | … | … | … | 15.186(0.009) | 14.205(0.007) |
| 1494.85 | 17.260(0.015) | 15.553(0.007) | 14.657(0.006) | 14.873(0.008) | 15.983(0.009) | 14.941(0.007) | … | … |
| 1497.78 | 17.251(0.035) | 15.603(0.006) | 14.762(0.006) | 15.004(0.007) | 16.027(0.009) | 15.025(0.006) | … | … |
| 1498.82 | … | … | … | … | … | … | 15.674(0.011) | 14.527(0.008) |
| 1499.77 | … | 15.630(0.005) | 14.830(0.005) | 15.074(0.006) | 16.057(0.007) | 15.076(0.005) | … | … |
| 1503.82 | … | … | … | … | … | … | 16.021(0.013) | 14.764(0.008) |
| 1508.86 | … | 15.768(0.006) | 15.123(0.007) | 15.444(0.008) | 16.164(0.010) | 15.312(0.006) | … | … |
| 1511.79 | … | … | … | … | … | … | 16.527(0.016) | 15.083(0.012) |
| 1512.79 | … | 15.834(0.006) | 15.261(0.007) | 15.585(0.008) | 16.207(0.009) | 15.407(0.007) | … | … |
| 1515.76 | … | 15.870(0.007) | 15.360(0.005) | 15.700(0.007) | 16.237(0.009) | 15.490(0.007) | … | … |
| 1517.76 | … | 15.896(0.006) | 15.417(0.006) | 15.759(0.007) | 16.260(0.010) | 15.530(0.007) | … | … |
| 1523.79 | … | 15.996(0.006) | 15.620(0.005) | 15.973(0.007) | 16.349(0.008) | 15.686(0.006) | … | … |
| 1527.77 | … | 16.047(0.006) | 15.737(0.008) | 16.115(0.010) | 16.396(0.009) | 15.784(0.008) | … | … |
| 1532.70 | … | … | … | … | … | 15.915(0.020) | … | … |
| 1538.75 | … | 16.214(0.005) | 16.089(0.004) | 16.470(0.005) | 16.571(0.006) | 16.051(0.004) | … | … |
| 1540.68 | … | 16.218(0.006) | 16.131(0.008) | 16.521(0.009) | 16.607(0.010) | 16.140(0.012) | … | … |
| 1542.66 | … | 16.276(0.007) | 16.217(0.008) | 16.612(0.010) | 16.633(0.010) | 16.138(0.008) | … | … |
| 1549.71 | … | 16.396(0.009) | 16.447(0.011) | 16.819(0.014) | 16.725(0.019) | 16.298(0.011) | … | … |
| 1558.65 | … | 16.531(0.006) | 16.723(0.008) | 17.098(0.011) | 16.885(0.012) | 16.483(0.007) | … | … |
| 1566.76 | … | 16.663(0.007) | 16.964(0.008) | 17.305(0.011) | 17.017(0.012) | 16.648(0.009) | … | … |
| 1571.66 | … | 16.747(0.007) | 17.096(0.009) | 17.422(0.013) | 17.099(0.012) | 16.750(0.009) | … | … |
| 1578.70 | … | 16.870(0.010) | 17.291(0.008) | 17.600(0.009) | 17.208(0.009) | 16.935(0.059) | … | … |
References
- Barnes (1988) Barnes, J. E. 1988, ApJ, 331, 699
- Astier et al. (2006) Astier, P., et al. 2006, A&A, 447, 31
- Bellazzini et al. (2004) Bellazzini, M., Ferraro, F. R., Sollima, A., Pancino, E., & Origlia, L. 2004, A&A, 424, 199
- Blakeslee et al. (2001) Blakeslee, J. P., Lucey, J. R., Barris, B. J., Hudson, M. J., & Tonry, J. L. 2001, MNRAS, 327, 1004
- Branch et al. (2008) Branch, D., et al. 2008, PASP, 120, 135
- Clocchiatti et al. (2006) Clocchiatti, A., et al. 2006, ApJ, 642, 1
- de Vaucouleurs et al. (1991) de Vaucouleurs, G., de Vaucouleurs, A., Corwin, H. G., Buta, R. J., Paturel, G., & Fouqué, P. 1991, Third Reference Catalogue of Bright Galaxies (Berlin: Springer)
- Drake et al. (2007) Drake, A. J., Djorgovski, S. G., Williams, R., Mahabal, A., Graham, M. J., Beshore, E. C., & Larson, S. M. 2007, CBET # 1172, ed. D. W. E. Green
- Fabbiano et al. (2004) Fabbiano, G., et al. 2004, ApJ, 605, L21
- Freedman et al. (2001) Freedman, W. L., et al. 2001, ApJ, 553, 47
- Gilbert & Graham (2007) Gilbert, A. M., & Graham, J. R. 2007, ApJ, 668, 168
- Hamuy et al. (1996) Hamuy, M., Phillips, M. M., Suntzeff, N. B., Schommer, R. A., Maza, J., & Aviles, R. 1996, AJ, 112, 2398
- Hamuy et al. (2006) Hamuy, M., et al. 2006, PASP, 118, 2
- Hibbard (2003) Hibbard, J. E. 2003, BAAS, 35, 1413; and: http://www.cv.nrao.edu/jhibbard/n4038/n4038sim/
- Hibbard et al. (2001) Hibbard, J. E., van der Hulst, J. M., Barnes, J. E., & Rich, R. M. 2001, AJ, 122, 2969
- Hibbard et al. (2005) Hibbard, J. E., et al. 2005, ApJ, 619, L87
- Hsiao et al. (2007) Hsiao, E. Y., Conley, A., Howell, D. A., Sullivan, M., Pritchet, C. J., Carlberg, R. G., Nugent, P. E., & Phillips, M. M. 2007, ApJ, 663, 1187
- Knop et al. (2003) Knop, R. A., et al. 2003, ApJ, 598, 102
- Krisciunas et al. (2004) Krisciunas, K., Phillips, M. M., & Suntzeff, N. B. 2004, ApJ, 602, L81
- Landolt (1992) Landolt, A. U. 1992, AJ, 104, 340
- Lee et al. (1993) Lee, M. G., Freedman, W. L., & Madore, B. F. 1993, ApJ, 417, 553
- Mager et al. (2008) Mager, V., Madore, B. F., & Freedman, W. L. 2008, submitted
- Madore et al. (2008) Madore, B. F., Mager, V., & Freedman, W. L. 2008, submitted
- Madore & Steer (2007) Madore, B. F., & Steer, I. P. 2007, Master List of Galaxy Distances (Rev. 2.2), at: http://nedwww.ipac.caltech.edu/level5/NED1D/intro.html
- Mihos et al. (1993) Mihos, J. C., Bothun, G. D., & Richstone, D. O. 1993, ApJ, 418, 82
- Mirabel et al. (1992) Mirabel, I. F., Dottori, H., & Lutz, D. 1992, A&A, 256, L19
- Naito et al. (2007) Naito, H., Sakane, Y., Anan, T., Kouzuma, S., & Yamaoka, H. 2007, CBET # 1173, ed. D. W. E. Green
- Oke & Gunn (1983) Oke, J. B., & Gunn, J. E. 1983, ApJ, 266, 713
- Perlmutter et al. (1999) Perlmutter, S., et al. 1999, ApJ, 517, 565
- Persson et al. (1998) Persson, S. E., Murphy, D. C., Krzeminski, W., Roth, M., & Rieke, M. J. 1998, AJ, 116, 2475
- Phillips (1993) Phillips, M. M. 1993, ApJ, 413, L105
- Pojmanski et al. (2008) Pojmanski, G., Prieto, J. L., Stanek, K. Z., & Beacom, J. F. 2008, CBET # 1213, ed. D. W. E. Green
- Prieto et al. (2006) Prieto, J. L., Rest, A., & Suntzeff, N. B. 2006, ApJ, 647, 501
- Riess et al. (1996) Riess, A. G., Press, W. H., & Kirshner, R. P. 1996, ApJ, 473, 88
- Riess et al. (1998) Riess, A. G., et al. 1998, AJ, 116, 1009
- Saviane et al. (2004) Saviane, I., Hibbard, J. E., & Rich, R. M. 2004, AJ, 127, 660
- Saviane et al. (2008) Saviane, I., Momany, Y., Da Costa, G. S., Rich, R. M., & Hibbard, J. E. 2008, ApJ, 678, 179
- Schlegel et al. (1998) Schlegel, D. J., Finkbeiner, D. P., & Davis, M. 1998, ApJ, 500, 525
- Schweizer (1978) Schweizer, F. 1978, in Structure and Properties of Nearby Galaxies, ed. E. M. Berkhuijsen & R. Wielebinski (Dordrecht: Reidel), 279
- Smith et al. (2002) Smith, J. A., et al. 2002, AJ, 123, 2121
- Spergel et al. (2007) Spergel, D. N., et al. 2007, ApJS, 170, 377
- Tonry et al. (2000) Tonry, J. L., Blakeslee, J. P., Ajhar, E. A., & Dressler, A. 2000, ApJ, 530, 625 (TBAD00)
- Tonry et al. (2001) Tonry, J. L., et al. 2001, ApJ, 546, 681
- Toomre & Toomre (1972) Toomre, A., & Toomre, J. 1972, ApJ, 178, 623
- Tully (1988) Tully, R. B. 1988, Nearby Galaxies Catalog (Cambridge: Cambridge Univ. Press)
- Umbriaco et al. (2007) Umbriaco, G., Pietrogrande, T., Di Mille, F., Agnoletto,I., Harutyunyan, A, & Benetti, S. 2007, CBET # 1174, ed. D. W. E. Green
- Wang et al. (2006) Wang, L., Strovink, M., Conley, A., Goldhaber, G., Kowalski, M., Perlmutter, S., & Siegrist, J. 2006, ApJ, 641, 50
- Whitmore & Schweizer (1995) Whitmore, B. C., & Schweizer, F. 1995, AJ, 109, 960
- Whitmore et al. (1999) Whitmore, B. C., Zhang, Q., Leitherer, C., Fall, S. M., Schweizer, F., & Miller, B. W. 1999, AJ, 118, 1551
- Wood-Vasey et al. (2007) Wood-Vasey, W. M., et al. 2007, ApJ, 666, 694