Synchrotron Self-Compton Model for PKS 2155–304
Abstract
H.E.S.S. observed TeV blazar PKS 2155–304 in a strong flare state in 2006 July. The TeV flux varied on timescale as short as a few minutes, which sets strong constraints on the properties of the emission region. By use of the synchrotron self-Compton model, we found that models with the bulk Lorentz factor , the size of the emission region cm, and magnetic field G explain the observed spectral energy distribution and the flare timescale a few minutes. This model with a large value of accounts for the emission spectrum not only in the TeV band but also in the X-ray band. The major cooling process of electrons/positrons in the jet is inverse Compton scattering off synchrotron photons. The energy content of the jet is highly dominated by particle kinetic energy over magnetic energy.
1 Introduction
In active galactic nuclei various physical processes such as particle acceleration, emission of high energy photons, and so on, take place. Accretion of matter onto the central black holes is thought to be the energy source of these processes. When a fraction of matter is ejected from the accretion disks, relativistic jets of plasmas are formed. The relativistic jets are thought to explain intense and variable emission from blazars. The beaming effect amplifies the radiation from jets depending on the opening angle of the jets, bulk Lorentz factor, , and the angle between the line of sight and the jet axis, . Some blazars are known to emit very high energy -rays in the TeV energy band. They are, for example, PKS 2155–304, Mrk 421, and Mrk 501 (e.g., Wagner, 2007).
Recent observations of TeV -rays have found remarkably short time variability of TeV blazars. In 2006 July PKS 2155–304 with redshift showed an outburst of TeV -rays. The average flux during the outburst was more than 10 times typical values observed from the object (Aharonian et al., 2007). During this period X-rays were also monitored by Swift. In the 0.3–10 keV energy band the X-ray flux increased by a factor of 5 (Foschini et al., 2007a). The observations by the High Energy Stereoscopic System (H.E.S.S.) report that the timescale of variation is a few minutes (Aharonian et al., 2007). The well-resolved burst of the TeV -ray flux from PKS 2155–304 varied on timescales only s. Recently MAGIC also observed short time variation in Mrk 501 (Albert et al., 2007). When the size of the emission region in the comoving frame of the jet is denoted by , the observed timescale of the variability sets a limit on , i.e., , where is the speed of light and is the beaming factor with . Aharonian et al. (2007) argued that 60 - 120 is required to explain min, where is the Schwarzschild radius with and being the gravitational constant and the central black hole mass, respectively. Such large values of are also suggested by Begelman et al. (2008) recently, based on the requirements of radiative cooling time and optical depth for -rays due to electron-positron pair production.
The emission spectra of blazars are characterized by two peaks in the - representation, where is the differential energy flux. The lower energy peak is located in the optical – X-ray bands and the higher energy peak is located in very high energy -ray bands. The lower energy peak is most probably by synchrotron radiation of nonthermal electrons/positrons. Radiation mechanisms of high energy -rays are thought to be inverse Compton scattering off soft photons in the leptonic models (e.g., Maraschi et al., 1992) and hadronic interaction of relativistic particles and photons in the hadronic models (e.g., Mannheim & Biermann, 1992; Mücke et al., 2003). The soft photons of the leptonic models are supplied by synchrotron radiation by relativistic electrons/positrons in the jet (synchrotron self-Compton model) or by the external sources such as accretion disks (Dermer & Schlickeiser, 1993) and disk radiation scattered around the jet (Sikora et al., 1994). These emission models assume that the emission region is one zone.
Observations of TeV -rays of blazars have revealed that large values of are required to fit the emission spectra of very high energy -rays by inverse Compton scattering (e.g., Kino et al., 2002). On the other hand, the observations of the apparent velocity of VLBI knots show that parsec-scale jets are subrelativistic or at most mildly relativistic (Piner & Edwards, 2004). To reconcile the discrepancy between these values of , the deceleration of jets is considered. Georganopoulos & Kazanas (2003) assumed that TeV -rays are produced by inverse Compton scattering off synchrotron photons that are emitted by decelerated jet components. Ghisellini et al. (2005), on the other hand, proposed a spine-layer model. In this model they assumed that a fast moving emission region is surrounded by a slow moving sheath. Gamma-rays are then produced by inverse Compton scattering off the photons emitted in the spine and the sheath. Although various emission models of jets with multiple radiation zones have been proposed as mentioned above, a simple synchrotron self-Compton (SSC) model is still worth use in obtaining physical parameters of the emission regions in jets.
In this paper we show that a simple SSC model can explain the TeV -rays and X-rays of PKS 2155–304. PKS 2155–304 is an interesting source because of its strong TeV -ray emission and the short time variability of TeV emission. Since the redshift of PKS 2155–304 is 0.116, the absorption of TeV -rays by extragalactic background light (EBL) is effective (e.g., Stecker et al., 2006). This is an ideal object to test EBL models as well as emission models.
2 Model Parameters
The emission region is assumed to be a sphere with radius moving relativistically with bulk Lorentz factor . Below we assume , i.e., . We solve kinetic equations of electrons and photons in the emission region (Kusunose et al., 2000). Here we assume that the plasmas and radiation in the emission region are in a steady state. Electrons are continuously injected in the emission region at rate . The injection spectrum is given by
| (1) |
where , , and are parameters, and is the normalization constant determined by
| (2) |
The electrons escape from the emission region by advection on timescale , where is a dimensionless parameter. The cooling processes of the electrons are synchrotron radiation and inverse Compton scattering. We assume that the emission region has randomly oriented magnetic field . Photons are assumed to escape from the emission region on timescale . We also include the absorption of -rays in the emission region by production due to photon-photon collisions. This effect is found to be negligible for -rays with observed energy less than 10 TeV in our numerical results.
Parameters in our model are , , , , , , , and . The dependence of solutions on is weak and we set . In addition to the above parameters, the cosmological parameters such as Hubble constant and the density parameters of matter and cosmological constant are needed to calculate the luminosity distance and the optical depth for -ray absorption by EBL. We assume km s-1 Mpc-1, , and .
It is known that TeV -rays emitted by distant sources are absorbed by EBL. This was first pointed out by Nikishov (1962) and detailed calculations were performed by Gould & Schréder (1966) and Jelly (1966). Later Stecker et al. (1992) proposed that the EBL spectrum is estimated by considering the absorption of TeV -rays from blazars. Since then various models of EBL have been proposed (see Stecker et al., 2006, for review). The redshift of PKS 2155–304 is 0.116 and the optical depth of TeV -rays is greater than unity for -rays with energy greater than 1 TeV. In our previous work (Kato et al., 2006), we used models by Dwek & Krennrich (2005) to fit the emission spectrum from H1426+428. There we found that model LLL of Dwek & Krennrich (2005) is applicable in the SSC model. In this paper we use the same EBL model to calculate the deabsorbed TeV spectrum.
3 Results
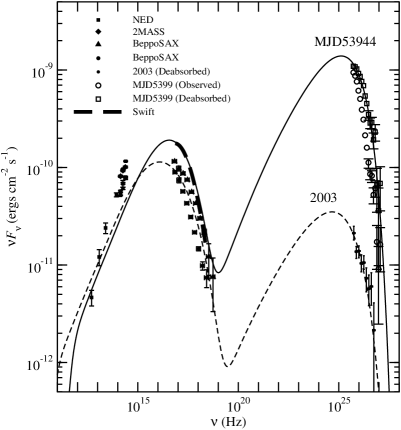
H.E.S.S. observed a -ray outburst from PKS 2155–304 on 2006 July 28 (MJD 53944) (Aharonian et al., 2007). Almost simultaneous observation by Swift was performed in the X-ray band on July 29/30 (Foschini et al., 2007a). The observed emission spectra are shown in Figure 1. The TeV data in 2006 July are from H.E.S.S. (Aharonian et al., 2007). The TeV spectrum is corrected with an EBL model, LLL, of Dwek & Krennrich (2005) for absorption by production through photon-photon collisions. The X-ray spectrum of 2006 July 29 and 30 is shown by a thick dashed line. This spectrum is a log-parabolic model fit given by Foschini et al. (2007b). Other X-ray, optical, and radio data are not simultaneous with the TeV data. The X-ray data except those of Swift are from BeppoSAX and radio data are from NED. 2MASS data are also plotted. The TeV emission spectrum observed in 2003 July (Aharonian et al., 2005a) is shown for comparison.
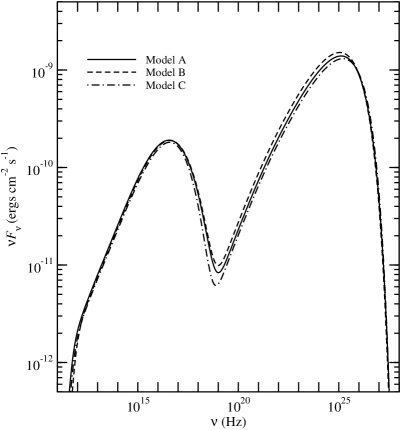
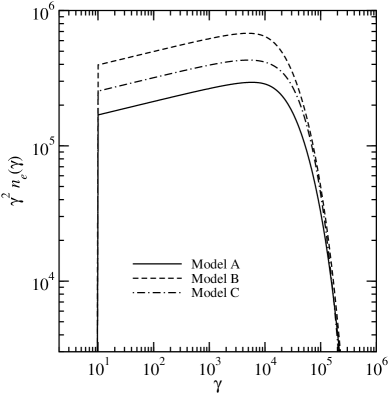
Our models are shown in Figure 1 by solid and dashed lines for 2006 July and 2003 July, respectively. We did not fit the emission spectra below Hz, assuming this emission is from different regions, possibly from extended regions far away from the central black hole. The values of the parameters for the flare in 2006 July are the following: , G, cm, , , and (Model A in Table 1). The value of is , if . From these parameters, the timescale of variability is s. We also obtained the parameter values which give s. Those are shown in Table 1 (Models B and C). When s is assumed, the spectral energy distribution (SED) of 2006 July is fitted well if is in the range . When , the fluxes in the tails of the lower and higher peaks of the SED are too high. On the other hand, when , the tail of the lower peak (the X-ray band) is too steep. SEDs for Models A, B, and C are shown in Figure 2. In Table 1 the parameters given in other papers such as Foschini et al. (2007a) and Begelman et al. (2008) are also listed. Note that h is assumed in Foschini et al. (2007a) and that Begelman et al. (2008) did not perform the spectral fitting.
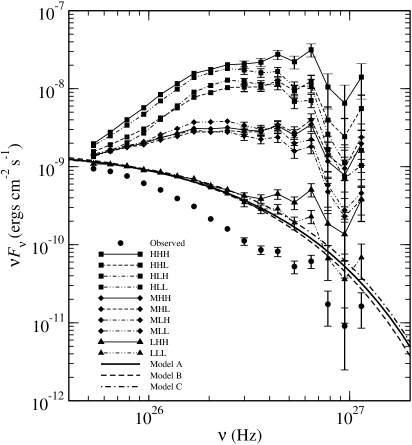
In Figure 3 various deabsorbed TeV spectra are compared with our models. The deabsorbed spectra are calculated with different EBL models given by Dwek & Krennrich (2005). When EBL models other than LLL, LHH, LLH, and LHL are applied (LLH and LHL are not shown in the figure), the TeV spectrum has a peak at Hz. Such a spectrum is difficult to produce by the one-zone SSC model, if the X-rays are emitted in the same region as TeV -rays. In particular the Klein-Nishina effect suppresses the emission in the TeV band.
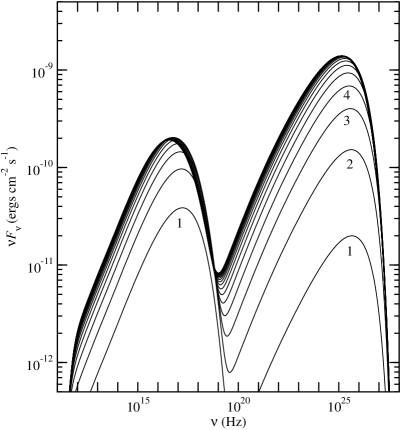
In our simulations, small numbers of nonthermal electrons and synchrotron photons are initially injected and time evolution is followed until a steady state is attained. Because of this initial condition, the SED takes longer time than the observed timescale to attain a steady state. The time evolution of the SED of Model A is shown in Figure 4. In actual flares, the initial condition may different from that used here and flares are not in a steady state. We used a steady state to obtain typical values of the source parameters.
In Figure 5 the electron spectrum for the flare is shown. The electron spectrum has a cutoff at . Because the injection spectrum has an exponential cutoff at , efficient Compton cooling made the cutoff energy smaller. The synchrotron cooling time of electrons with is about s for G. The energy density of synchrotron photons is ergs cm-3 in Model A. This results in the Compton cooling time s for electrons with . Electrons with are cooled in the flare timescale in the comoving frame of the jet. The Compton cooling time is short enough to be a major cooling process during the TeV flare.
The numerical results show that the energy densities of nonthermal electrons and magnetic fields in Model A are, respectively, ergs cm-3 and ergs cm-3. This yields a large value of . The values of energy contents of different models are shown in Table 2. The dominance of particle kinetic energy over magnetic energy should be taken into account in consideration of acceleration mechanisms. The powers contained in the jet are, in the form of radiation and electron kinetic energy, given by and , respectively, where is the radiation energy density. The numerical results are given in Table 2.
Our model include internal absorption of -rays by production. However, our numerical results show that the -ray absorption is negligible. Because of the large values of , the soft photon density and the maximum -ray energy in the comoving frame of the jet are not large enough for pair production.
In Figure 1 we show a TeV spectrum observed in 2003 July as well. In 2003, TeV emission was observed by H.E.S.S. several times (Aharonian et al., 2005a). In those observations the TeV flux was much lower than that in the 2006 July flare. The TeV spectrum of 2003 July are fitted with parameters such as , G, cm, , , and . With these parameters, numerical results give . Compared with the flare of 2006 July, a blob with a larger size but a smaller value of was involved. The powers of radiation and electrons are, respectively, ergs s-1 and ergs s-1. Compared with the flare state in 2006, is smaller by a factor 0.24 and is smaller by a factor 0.52, if Model A is adopted.
In Aharonian et al. (2005b), they derived source parameters for the H.E.S.S. observation in 2003, October and November, with different EBL models from that used here. According to their results, the source was in a low or quiet state. With their leptonic model, they obtained cm, , and G (Model 2). Kino et al. (2002), on the other hand, used the SSC model to fit another quiescent state, but without the correction for -ray absorption by EBL. They obtained cm, , and G. The ratio is 3, which is smaller by a factor 9, compared with our results for 2003 July. The source size obtained by us is the largest among these models for quiescent states.
4 Discussion
In this work we have shown that a large value of the bulk Lorentz factor, , is required to explain the emission from PKS 2155–304 in the TeV band as well as the X-ray band. With cm and , the timescale s is obtained, while s is obtained for cm and - 150. The value of as large as 100 requires the viewing angle as small as 0.01 rad, which makes the case an unlikely coincidence if the opening angle of the jet is the same order as . However, if the opening angle is larger than , we can observe a portion of the jet that aligns with the line of sight, thus avoiding an excessively small observability. Considering that Mrk 501 also exhibited a similar short timescale TeV flare, we think that the opening angle is larger than (by a factor ). If this is the case, represents the lateral size along the jet motion, while the transverse size is larger than by the same factor . Thus the real size of the emission region is larger than and only a part of the emission regions is observed owing to a strong relativistic beaming effect. Then the kinetic power should be by a factor larger than a conventional estimate given by . A further speculative possibility is that the opening angle is as small as but the jet axis wanders within a large angle and the flare is observed when its direction happens to fall in the line of sight.
Our results show that the jet plasma is highly particle energy dominated over magnetic energy, i.e., in the flare state in 2006. The ratio has been discussed in many papers. In Kino et al. (2002) we discussed that TeV blazars are generally particle dominated typically by a factor of 10. For a quiescent state of PKS 2155–304 we obtained the ratio of 3. Thus the ratio of seems unusually high, although there is no serious theoretical reason to expect a ratio of unity except that it leads to a minimum kinetic power for a given observed spectrum. The obtained high value of the ratio basically results from the fact that the SSC luminosity is much larger than the synchrotron luminosity. In this respect, we note that the X-ray and TeV observations are not strictly simultaneous; if the X-ray flux during the TeV flare is higher than the adopted value in this paper, the ratio decreases correspondingly. Also, some soft photon sources other than synchrotron radiation will help to decrease the ratio. However, considering a good fit to the observed spectrum obtained here, such possibilities are not easy to realize and the reduction will not be significant. Levinson (2007) and Begelman et al. (2008) adopted the view that the TeV flare is caused by external Compton mechanism. In this case, the model may avoid an extremely large value of . However, considering the short timescale of radiative deceleration, the acceleration of the emitting plasma to the large bulk Lorentz factor itself becomes very difficult because of the large radiation drag effect. Also note that both papers did not make detailed multi-wavelength fitting.
As mentioned above, Begelman et al. (2008) argued that inverse Compton scattering off external soft photons is favored as the dominant radiation process to produce TeV -rays. The major differences between their model and ours are that they assumed the dominance of the Poynting flux over the kinetic energy flux as well as the synchrotron radiation as a major cooling process to estimate particle’s cooling timescale, while in our model the energy flux is dominated by nonthermal particle’s kinetic energy and the cooling is dominated by SSC.
In comparison between the flare state in 2006 July and the quiescent state in 2003 July, the powers in radiation and electrons increased by factors 2 and 4.2, respectively, during the flare in 2006, if Model A is adopted. The increase in the jet power is significant and the efficient acceleration of electrons is implied. The size of the blob for the 2006 July flare is cm. This is about 3 , if the mass of the central black hole is . A large energy injection into a very compact region occurred in the flare. The obtained parameter values for the flare event and various phases are not well ordered and we found no simple tendencies from quiescent states to flares. The TeV flare may be caused by a concentration of energy into a sub-horizon scale region, while during quiescent states we may be seeing larger scale energy dissipation on longer timescales.
In applying our model, we assumed a low flux model of EBL, i.e., LLL of Dwek & Krennrich (2005). With this EBL model the one-zone SSC model is found to be viable for this TeV blazar, although other models proposed by Georganopoulos & Kazanas (2003) and Ghisellini et al. (2005) might explain the TeV spectrum with higher fluxes of EBL. This should be studied in future work.
Radiation below Hz is not fitted with our model. We assumed that the emission comes from more extended regions far away from the central black hole (see also Aharonian et al., 2005b). If the radiation below Hz is emitted by the jet plasma, inverse Compton scattering produces radiation in the MeV – GeV band. Observation in this energy band is particularly important to set constraints on the emission mechanisms of blazars.
References
- Aharonian et al. (2005a) Aharonian, F. A., et al. 2005a, A&A, 430, 865
- Aharonian et al. (2005b) Aharonian, F. A., et al. 2005b, A&A, 442, 895
- Aharonian et al. (2007) Aharonian, F. A., et al. 2007, ApJ, 664, L71
- Albert et al. (2007) Albert, J. et al. 2007, ApJ, 669, 862
- Begelman et al. (2008) Begelman, M. C., Fabian, A. C., & Rees, M. J. 2008, MNRAS, 384, L19
- Dermer & Schlickeiser (1993) Dermer, C. D., & Schlickeiser, R. 1993, ApJ, 416, 458
- Dwek & Krennrich (2005) Dwek, E., & Krennrich, F. 2005, ApJ, 618, 657
- Foschini et al. (2007a) Foschini, L., et al. 2007a, ApJ, 657, L81
- Foschini et al. (2007b) Foschini, L., et al. 2007b, in AIP Conf. Proc. 921, The First Glast Symposium, ed. S. Ritz & P. Michelson (Melville: AIP), 329
- Georganopoulos & Kazanas (2003) Georganopoulos, M., & Kazanas, D. 2003, ApJ, 594, L27
- Ghisellini et al. (2005) Ghisellini, G., Tavecchio, F., & Chiaberge, M. 2005, A&A, 432, 401
- Gould & Schréder (1966) Gould, R. J., & Schréder, G. 1966, Phys. Rev. Lett., 16, 252
- Jelly (1966) Jelly, J. V. 1966, Phys. Rev. Lett., 16, 475
- Kato et al. (2006) Kato, T., Kusunose, M., & Takahara, F. 2006, ApJ, 638, 658
- Kino et al. (2002) Kino, M., Takahara, F., & Kusunose, M. 2002, ApJ, 564, 97
- Kusunose et al. (2000) Kusunose, M., Takahara, F., Li, H., ApJ, 536, 299
- Levinson (2007) Levinson, A. 2007, ApJ, 671, L29
- Maraschi et al. (1992) Maraschi, L., Ghisellini, G., & Celotti, A. 1992, ApJ, 397, L5
- Mannheim & Biermann (1992) Mannheim, K., & Biermann, P. L. 1992, A&A, 253, L21
- Mücke et al. (2003) Mücke, A. et al. 2003, AstroPart. Phys., 18, 593
- Nikishov (1962) Nikishov, A. I. 1962, Sov. Phys. J. Exp. Theor. Phys. 14, 393
- Piner & Edwards (2004) Piner, B. G., & Edwards, P. G. 2004, ApJ, 600, 115
- Sikora et al. (1994) Sikora, M. et al. 1994, ApJ, 421, 153
- Stecker et al. (1992) Stecker, F. W., de Jager, O. C., & Salamon, M. H. 1992, ApJ, 390, L49
- Stecker et al. (2006) Stecker, F. W., Malkan, M. A., & Scully, S. T. 2006, ApJ, 648, 774 [Erratum ApJ, 658, 1392, 2007]
- Wagner (2007) Wagner, R. M. 2008, MNRAS,386, 199
| Parameter | Model A | Model B | Model C | Foschini et al. ModelaaThe model for July 29 given in Foschini et al. (2007a). The variability timescale 1 h was assumed. | Begelman et al. ModelbbThe model given in Begelman et al. (2008). , s, and isotropic luminosity ergs s-1 are assumed to calculate , , and , where is the electron Lorentz factor that emits synchrotron radiation peaking at Hz. |
|---|---|---|---|---|---|
| 90 | 100 | 120 | 30 | ||
| 90 | 100 | 120 | 33.5 | ||
| (G) | 0.1 | 0.14 | 0.08 | 0.27 | |
| (cm) | 9.6 | 5.4 | 6.5 | 50 | 4.5 |
| 1.9 | 1.9 | 1.9 | 2.5ccThe power law index for . The index for is | ||
| () | 8.0 | 6.7 | 5.5 | 17.5ddThe maximum energy of electrons. | |
| 10 | 10 | 10 | |||
| eeThe break energy of electrons obeying a broken power law. | |||||
.
| Parameter | Model A | Model B | Model C |
|---|---|---|---|
| 90 | 100 | 120 | |
| (ergs cm-3) | 3.8 | 8.7 | 5.7 |
| ( ergs cm-3) | 4.0 | 7.8 | 2.6 |
| () | 0.95 | 1.1 | 2.2 |
| ( ergs s-1) | 3.3 | 2.9 | 1.7 |
| ( ergs s-1) | 2.7 | 2.4 | 3.3 |