Towards an Accurate Determination of Parameters for Very Massive Stars: the Eclipsing Binary LMC-SC1-10511affiliation: Based on observations obtained with the 2.5 meter DuPont and 6.5 meter Magellan Clay Telescope located at Las Campanas Observatory, Chile.
Abstract
This paper presents a photometric and spectroscopic study of the bright blue eclipsing binary LMC-SC1-105, selected from the OGLE catalog as a candidate host of very massive stars (). The system is found to be a double-lined spectroscopic binary, which indeed contains massive stars. The masses and radii of the components are , , and , , respectively. The less massive star is found to be filling its Roche lobe, indicating the system has undergone mass-transfer. The spectra of LMC-SC1-105 display the Struve-Sahade effect, with the He I lines of the secondary appearing stronger when it is receding and causing the spectral types to change with phase (O8O8 to O7O8.5). This effect could be related to the mass-transfer in this system. To date, accurate () fundamental parameters have only been measured for 15 stars with masses greater than 30 M⊙, with the reported measurements contributing valuable data on the fundamental parameters of very massive stars at low metallicity. The results of this work demonstrate that the strategy of targeting the brightest blue stars in eclipsing binaries is an effective way of studying very massive stars.
1 Introduction
The fundamental parameters of very massive stars () remain uncertain, despite the large impact massive stars have in astrophysics, both individually and collectively (see review by Massey, 2003). The equations of stellar structure allow for stars with arbitrarily large masses, however the mechanisms to form massive stars (accretion and mergers; e.g. Bally & Zinnecker, 2005) and the associated instabilities (see Elmegreen, 2000; Zinnecker & Yorke, 2007, and references therein) are not well understood, hindering theoretical predictions on the existence of an upper limit on the stellar mass. The “mass discrepancy” problem, i.e. the disagreement between masses derived from parameters determined by fitting stellar atmosphere models to spectra and from evolutionary tracks (see e.g. Repolust et al., 2004; Massey et al., 2005, for a comparison), still affects studies of single massive stars, even though significant progress has been made in both stellar atmosphere (see review by Herrero, 2007) and stellar evolution models (e.g. Meynet & Maeder, 2003). The parameters of single stars also suffer from suspected multiplicity, which in many cases cannot be determined. Pismis 24-1 demonstrates this problem: its inferred evolutionary mass (Walborn et al., 2002) contradicted the upper stellar mass limit of suggested by statistical arguments based on observations (Figer, 2005; Oey & Clarke, 2005). Maíz Apellániz et al. (2007) resolved it into a visual binary with the Hubble Space Telescope, thereby removing the discrepancy. One of its components is also a spectroscopic binary, illustrating the systematic effects often accompanying “single” stars.
The only model-independent way to obtain accurate fundamental parameters of distant massive stars and to resolve the “mass discrepancy” problem is to use eclipsing binaries (see review by Andersen, 1991). In particular, double-lined spectroscopic binary systems exhibiting eclipses in their light curves are extremely powerful tools for measuring masses and radii of stars. Specifically, the light curve provides the orbital period, inclination, eccentricity, the fractional radii and flux ratio of the two stars. The radial velocity semi-amplitudes determine the mass ratio; the individual masses can be solved for by using Kepler’s third law. Furthermore, by fitting synthetic spectra to the observed ones, one can infer the effective temperatures of the stars, solve for their luminosities and derive the distance (e.g. Bonanos et al., 2006). The most massive stars measured in eclipsing binaries are galactic Wolf-Rayet stars of WN6ha spectral type: NGC3603-A1 (M, M; Schnurr et al., 2008), and WR 20a (M and M Rauw et al., 2004; Bonanos et al., 2004) in Westerlund 2, presenting a challenge for both stellar evolution and massive star formation models (Yungelson et al., 2008; Zinnecker & Yorke, 2007) and raising the issue of the frequency and origin of “binary twins” (Pinsonneault & Stanek, 2006; Lucy, 2006; Krumholz & Thompson, 2007). Such systems are of particular interest, since massive binaries might be progenitors of gamma-ray bursts (e.g. Fryer et al., 2007), especially in the case of Population III, metal-free stars (see Bromm & Loeb, 2006).
Analogs of these heavyweight champions, if not more massive binaries, are bound to exist in the young massive clusters at the center of the Galaxy (Center, Arches, Quintuplet), in nearby super star clusters (e.g. Westerlund 1, R136), in Local Group galaxies (e.g. LMC, SMC, M31, M33) and beyond (e.g. M81, M83, NGC 2403). A systematic wide-ranging survey of these clusters and galaxies is currently underway. The goal is to provide data with which to test star formation theories, stellar atmosphere and stellar evolution models for both single and binary stars as a function of metallicity, and the theoretical predictions on the upper limit of the stellar mass. The adopted strategy involves two steps: a variability survey to discover eclipsing binaries in these massive clusters and nearby galaxies, which is followed by spectroscopy to derive parameters of the brightest – thus most luminous and massive – blue systems. However, characterizing massive stars requires the availability of 8-m class telescopes and high resolution near-infrared spectrographs (since massive stars in the Galaxy are extincted and extragalactic ones are faint) and has only become feasible in the past few years. Bonanos (2007) demonstrated that this method efficiently finds massive candidates, by performing the first variability survey of the Westerlund 1 super star cluster and discovering 4 massive eclipsing binary systems.
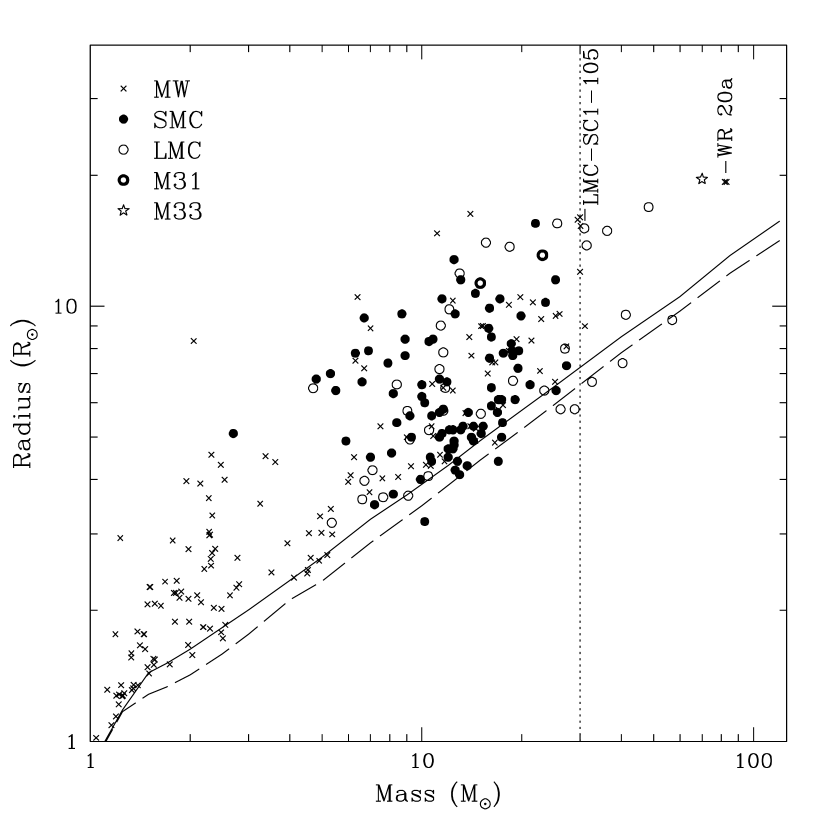
Figure 1 illustrates the extent of our knowledge of precise fundamental parameters of massive stars. It presents published mass-radius measurements from eclipsing binaries, accurate to better than for the more massive component. The zero-age main sequences (ZAMS) at both Z=0.02 (Schaller et al., 1992) and Z=0.008 (Schaerer et al., 1993) are overplotted as a reference. The Galactic data are mainly taken from the compilations of Andersen (1991) and Gies (2003) with additions and updates from Vitrichenko et al. (2007), but also González et al. (2005) for the Large Magellanic Cloud (LMC), Harries et al. (2003) and Hilditch et al. (2005) for the SMC, and Ribas et al. (2005) for M31. A literature search was done to include all accurate measurements of stars in eclipsing binaries with masses , which are presented in Table 1. This Table is, to my knowledge, complete at present and consists of only 14 very massive stars with better than mass-radius measurements, located in 3 galaxies. Of these, WR 20a and M33 X-7 (Orosz et al., 2007) are the most massive and noteworthy. M33 X-7 contains a very massive O-type giant and a record-breaking black hole, challenging current evolutionary models, which fail to explain such a large black hole mass. Without accurate measurements for a large sample of massive stars, theoretical models will remain unconstrained.
A survey to determine accurate parameters for several massive eclipsing binaries in the low metallicity (Z) LMC was undertaken, with the purpose of increasing the sample and improving our understanding of these rare systems. Several candidates were selected from the OGLE-II catalog of eclipsing binaries in the LMC (Wyrzykowski et al., 2003) as the brightest systems with . LMC-SC1-105, or OGLE053448.26-694236.4, is one of the brightest eclipsing binaries with mag, mag, mag and a preliminary semi-detached classification. This work presents the analysis of the follow-up observations obtained for LMC-SC1-105. The paper is organized as follows: §2 describes the spectroscopy and data reduction, §3 the spectral classification, §4 the radial velocity curve, §5 the light curve analysis, §6 the evolutionary status, and §7 the conclusion.
2 Spectroscopy
A total of 9 spectra of LMC-SC1-105 near quadrature phases were acquired over 4 runs on 2 telescopes at Las Campanas Observatory, Chile. In December 2005, January and February 2006, spectra were obtained with the Echelle spectrograph on the 2.5-m DuPont telescope. The slit resulted in a spectral resolution of 10 km s-1 () or 0.15Å at 4500Å, as measured from the full width half maximum of the comparison lamp lines. In January 2006 and October 2007, additional spectra were obtained with the blue and red sides of the MIKE spectrograph (Bernstein et al., 2003) on the 6.5-m Magellan Clay telescope. The slit used in 2006 resulted in a spectral resolution of 9 km s-1 () or 0.14Å at 4500Å, as measured from the full width half maximum of the comparison lamp lines. The slit used in 2007 resulted in a spectral resolution of 7 km s-1 () or 0.11Å at 4500Å. Table 2 summarizes the log of the observations, specifying the telescope and instrument used, the exposure times and final signal to noise (S/N) ratio per pixel measured on the merged spectra.
The Magellan spectra were extracted using the MIKE reduction pipeline written by D. Kelson (Kelson et al., 2000; Kelson, 2003). The extracted orders for each star were averaged, normalized and merged. The wavelength coverage of the final merged spectra is Å in the blue and Å in the red. The DuPont spectra were reduced, extracted and wavelength calibrated using the package in IRAF111IRAF is distributed by the NOAO, which are operated by the Association of Universities for Research in Astronomy, Inc., under cooperative agreement with the NSF.. Cosmic rays were removed from the two dimensional images with the algorithm of Pych (2004). The orders were finally averaged, normalized and merged, yielding a wavelength range Å. The heliocentric radial velocity corrections for each star were computed with the IRAF routine and taken into account in the subsequent radial velocity determination. Narrow nebular emission, likely originating from a nearby HII region, is present in the spectra and was removed. Finally, the Ca II H and K and Na I D lines exhibit multiple absorption features, corresponding to Galactic and LMC interstellar material with radial velocities between 0 and 315 km s-1.
3 Struve-Sahade Effect and Spectral Classification
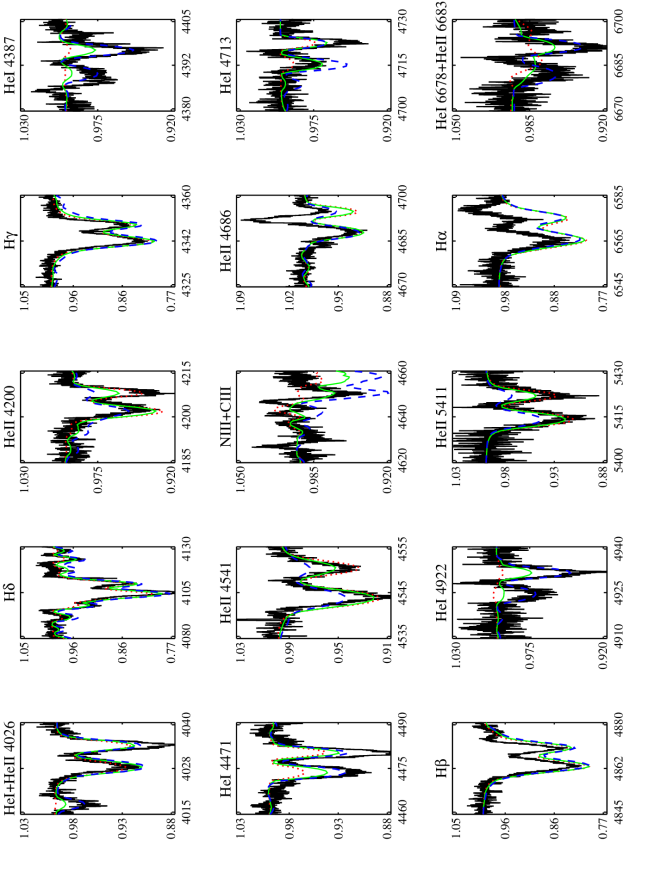
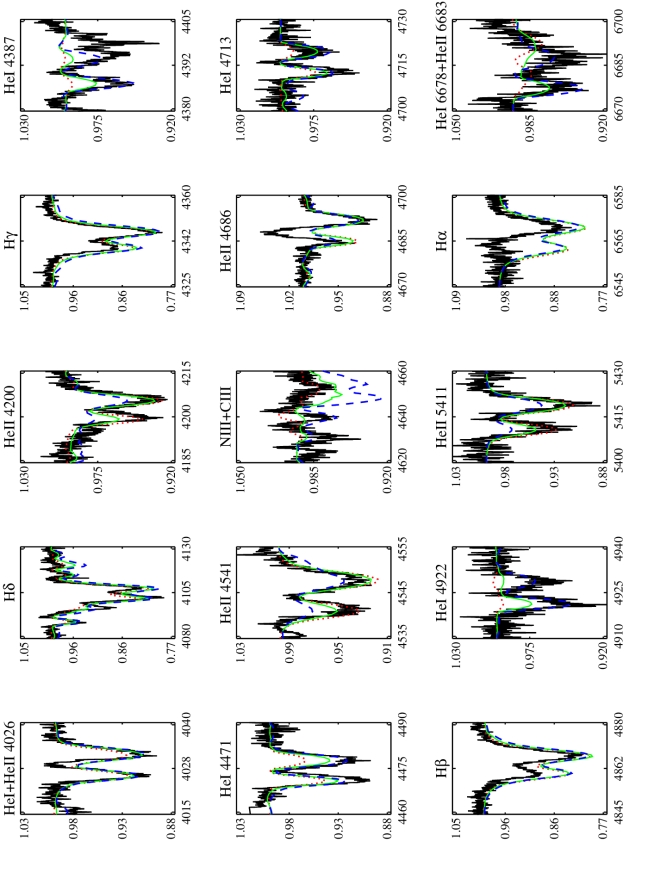
Inspection of the quadrature spectra reveals that LMC-SC1-105 exhibits the “Struve-Sahade effect” (Stickland, 1997). This term describes the variable strength of the spectral lines of the secondary star (or primary star in some cases) in a double-lined spectroscopic binary (see Howarth et al., 1997, and references therein). Figures 2, 3, and 4 present quadrature spectra of LMC-SC1-105 for the most prominent He I and He II lines. At phase 0.27, the He I lines of the secondary are significantly stronger than at phase 0.75, while, of the He II lines this is the case only for He II . Several mechanisms have been proposed to cause this effect (see Bagnuolo et al., 1999; Linder et al., 2007, and references therein), which could, in principle, affect the luminosity ratio and masses derived. In the case of LMC-SC1-105, both lines are clearly resolved and therefore the position of the line centers, and consequently the radial velocities can be unambiguously measured. Studying the Struve-Sahade effect in eclipsing binaries could be valuable for understanding its origin, because the inclination and sizes of stars are additionally known. A thorough investigation of the effect, as undertaken by Linder et al. (2007), is beyond the scope of this paper.
Following the criteria of Walborn & Fitzpatrick (1990), the spectral types of the primary and secondary are O8V and O8III-V at phase 0.75, respectively. The luminosity class of the secondary cannot be unambiguously determined, because of the strong emission in the He II line, superposed on the absorption line of the secondary. The Struve-Sahade effect further causes the spectral types of both stars to change. At phase 0.25 the stars appear to have types O7V and O8.5III-V. Massey et al. (2000) have assigned a O8.5III spectral type to LMC-SC1-105 (or W28-22, LH 81-72) from their lower resolution spectra, likely having observed it near or during primary eclipse. According to the calibration of effective temperature (Teff) with spectral type by Mokiem et al. (2007) for the LMC, the primary should have TkK and the secondary TkK. A (sub)giant classification would make it kK cooler than a dwarf with the same spectral class (see e.g. Martins et al., 2005). Figures 5 and 6 present the hydrogen and helium lines at each quadrature and TLUSTY model atmospheres (see §4) for a range of Teff. The combination that best fits the data has TkK and TkK, with fixed to 3.50 and the projected rotational velocities to the synchronous values of 180 km s-1 and 140 km s-1 (as determined in §5). These Teff values are consistent with the spectral type calibration of Mokiem et al. (2007). The Teff grid step was adopted as a conservative error. Note that no combination of models can fit all the helium lines satisfactorily, in particular the singlet lines He I and . Puls et al. (2005) point out that CMFGEN (Hillier & Miller, 1998), and therefore TLUSTY (since both models are consistent, see Bouret et al., 2003), predicts much weaker He I singlet lines than FASTWIND (Santolaya-Rey et al., 1997; Puls et al., 2005). Bouret et al. (2003) also state that “a simultaneous fit to all He I and He II lines is almost never achieved”. Computing a finer grid of TLUSTY models to better constrain the Teff of the stars or using a unified model atmosphere, such as FASTWIND, was not pursued, because the determination of masses and radii is independent of the Teff.
4 Radial Velocity Curve
Two methods were used to measure the orbital parameters of LMC-SC1-105: two dimensional cross correlation (or TODCOR) and spectral disentangling. TODCOR was developed by Zucker & Mazeh (1994) and can distinguish small velocity separations even more accurately than one dimensional cross correlation (Tonry & Davis, 1979). Synthetic spectra from the OSTAR2002 TLUSTY non-LTE grid (Lanz & Hubeny, 2003) at half-solar metallicity were used for the cross correlation. The microturbulent velocity was fixed to 10 km s-1 and the helium abundance to the solar value, by number. The Teff of the models in the grid range from 27500–55000 K in steps of 2500 K. The surface gravity , depending on the exact Teff value, ranges from 3.00–4.75 dex (cgs) in steps of 0.25 dex and the microturbulent velocity was fixed at 10 km s-1. The models were rotationally broadened (20-400 km s-1 in steps of 20 km s-1) and the instrumental broadening was applied with the program distributed with the TLUSTY grid.
Initially, best fit models were computed by minimizing the residuals of the sum of 2 models shifted appropriately to the highest S/N quadrature spectrum from UT 2007 October 24. This procedure yielded the following best fit models (Teff, , ): (35000, 3.50, 160) for the primary and (30000, 3.00, 140) for the secondary. These models were used as templates in TODCOR to derive initial values for the radial velocities, orbital elements and stellar parameters. Subsequently, and were fixed for the estimation of Teff. The models used for the final analysis are shown in Figures 5 and 6. The regions around the Balmer lines and were excluded from the TODCOR analysis, as the former are broad and the latter region contains He II 4686 emission (formed in the wind or interaction region), which the hydrostatic equilibrium TLUSTY models cannot reproduce. The resulting TODCOR velocities are given in Table 3.
An orbital fit for the systemic velocity, the semi-major axis and the mass ratio was performed with PHOEBE (version 0.31a, Prša & Zwitter, 2005), which builds on and enhances the capabilities of the Wilson-Devinney program (Wilson & Devinney, 1971; Wilson, 1979, 1990). The two highest S/N spectra were assigned a weight of 2, while the lowest S/N spectrum was assigned a weight of 0.5; the rest were assigned weights of 1. The values and their formal uncertainties, found by fixing the ephemeris from the OGLE catalog, are: , , . These imply semi-amplitudes of km s-1 and km s-1, and minimum masses of and . The rms of the fit is 12 for the primary and 8 for the secondary, which are adopted as representative values for the error in each radial velocity measurement. Separate velocities for each star were also fit for, but yielded values consistent within errors with the value above, therefore were not considered further.
Another accurate method for deriving radial velocities of spectroscopic binary stars is spectral disentangling (Simon & Sturm, 1994). The program KOREL (Hadrava, 1995) implements the method using Fourier transforms. In order to explore the parameter space, KOREL was run for a range of primary semi-amplitudes ( km s-1) and mass ratios (), using the range , a 4 km s-1 velocity step, excluding the region. The resulting values were found to be km s-1, , in agreement with the TODCOR results. The latter have more realistic errors and were adopted in the subsequent analysis. Southworth & Clausen (2007) present the first detailed comparison of the methods developed to derive radial velocities and find that disentangling is the most accurate, however they applied TODCOR on a single line.
5 Light Curve Analysis
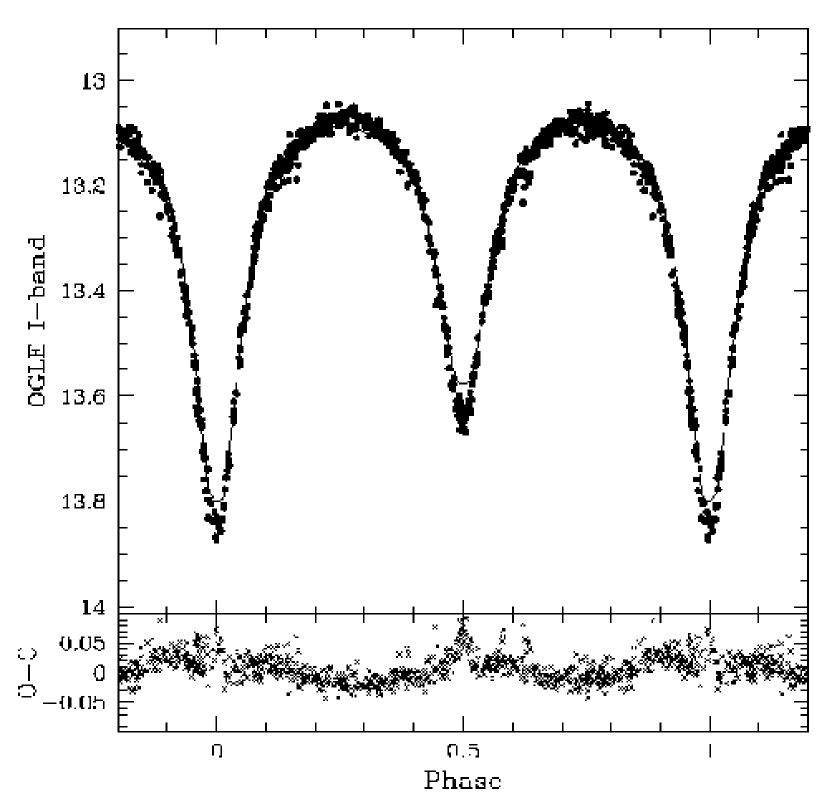
Besides the OGLE band light curve, blue and red filter light curves for LMC-SC1-105, roughly corresponding to and , are also available from the MACHO database (ID 81.8881.21). The MACHO light curves have 331 measurements in the red and 167 in the blue and span 7.2 years, but are noisier than the OGLE-II and OGLE-III light curve (kindly made available by I. Soszynski; see Soszynski et al., 2008), which has 750 points (after removing outliers) that span more than 11 years. The instrumental OGLE-III light curve was offset to match the OGLE-II light curve in the analysis below.
Detailed simultaneous modeling of the 3 light curves was performed with PHOEBE. Both the detached mode and the semi-detached mode with the secondary filling its Roche lobe were considered. Note, the primary star (star 1) in both binaries analyzed herein is defined photometrically, as the hotter star producing the deeper eclipse at phase zero. The parameters that were allowed to vary are: the inclination , Teff2, the period , and the surface potentials and . The time of primary eclipse T0 was fixed to the value determined by Wyrzykowski et al. (2003), while the value of the mass ratio and semi-major axis were fixed to the values determined from the orbital fit. The light ratio was computed rather than fit for, following Prša & Zwitter (2005). Synchronous rotation, a circular orbit and no third light were assumed, as there was no evidence to the contrary. Teff1 was fixed to the value determined from the spectra in §3, while the gravity darkening exponents were set to 1 for stars with radiative envelopes (i.e. ) and the albedo values to 0.5, following Hilditch (2001). Limb darkening coefficients for the square root law were fixed from Claret (2000) and the approximate reflection model was used.
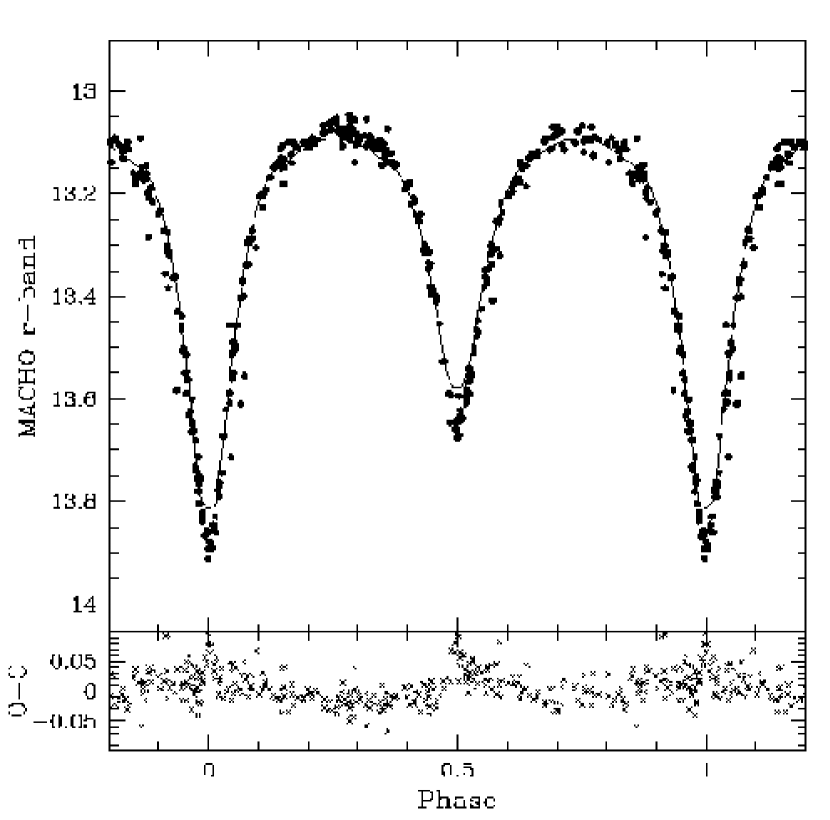
The values and errors of the parameters and the stability of the solution were explored using PHOEBE’s scripter. The Wilson-Devinney differential corrections minimization was run 1000 times, each time updating the input parameters to the values determined in the previous iteration. The final values for the parameters were determined by calculating the mean and standard deviation of the resulting values from each iteration; the resolution step was adopted as the error for the period. The errors are similar to the conventional errors from Wilson-Devinney. A semi-detached configuration with the secondary filling its Roche lobe yielded a consistent model. Figures 7, 8 and 9 present the phased OGLE and MACHO light curves and best fit model from PHOEBE. The more accurate and better sampled OGLE light curve exhibits a depression before the primary eclipse, which is often seen in Algol-type binaries (e.g., see Hilditch et al., 2005) and is attributed to a mass-transfer stream. The O’Connell (1951) effect explains the residuals near phase 0.25, since the first quadrature is brighter than the second by 0.01 mag. The earlier spectral type derived at this phase for the primary correlates with this extra flux. All bands display deeper eclipses than predicted by the model. This could be due to an inaccurate conversion of the differential flux light curves to magnitudes caused by blending (see Zebrun et al., 2001), however it is also seen in the MACHO light curves, obtained with profile fitting photometry. The only way to obtain a model with flat residuals (without changing the mass ratio) would be to additionally model cool spots. This was not pursued, as adding free parameters would improve the fit, but not significantly change the masses and radii.
Figure 10 shows the radial velocity curve and best fit model from PHOEBE, while Figure 11 presents histograms of the PHOEBE scan results and the final parameters, which are also listed in Table 4. The ephemeris is:
| (1) |
refining the recent period determinations of Derekas et al. (2007) and Faccioli et al. (2007) that are based on the MACHO data. The period was also calculated using the analysis of variance algorithm of Schwarzenberg-Czerny (1989) on the OGLE light curve and was found to be 4.25083 days. The uncertainties for the parameters are similar to the formal errors from PHOEBE. Teff2 was left as an adjustable parameter in PHOEBE as a proxy for the flux ratio, however, its value and uncertainty are quoted from the spectral type calibration described in §3. The light (or luminosity) ratio is in , in and in and was fixed to 0.45 in the TODCOR analysis. These formal errors were computed by iterating PHOEBE one more time with the primary light levels as additional adjustable parameters, as described by Prša & Zwitter (2005). The flux ratio is , in agreement with the value () found for LMC-SC1-105 by Mazeh et al. (2006) in their automatic analysis of OGLE eclipsing binaries.
The physical parameters for the system are presented in Table 5, with the final values for the masses and radii of and for the primary, and and for the secondary. The value for the secondary is lower than that for the primary, in support of the star being evolved with a luminosity class between III-V. Given the physical parameters, the synchronous rotational velocities of the stars are found to be 180 km s-1 and 143 km s-1. Note, the spectra were rotationally broadened to essentially identical values in §3. The measured masses and radii of the components have been determined to and accuracy, respectively. As discussed in §1, only 14 accurate measurements currently exist for very massive stars, with this work contributing towards increasing this sample to 15 (see Table 1).
6 Evolutionary Status
The semi-detached configuration of LMC-SC1-105 with the less massive star filling its Roche lobe, along with the main sequence classification of the primary and possible (sub)giant classification of the secondary, point to the system being in a slow-mass-transfer stage of case A binary evolution. The depression in the light curve before primary eclipse (described in §5) also indicates the presence of a mass-transfer stream. The emission in the He II 4686 line and some of the Balmer lines (in particular H) originates near the secondary and can be explained by gas being transfered onto the primary. The velocities of these emission lines coincide with the secondary star but are shifted, indicating an origin near the Lagrangian L1 point (see Figures 5 and 6). The evolutionary state of the stars can also be inferred by comparison with theoretical stellar evolution models. Figures 12 and 13 compare the parameters of the binary with the widely used theoretical stellar evolutionary models by Schaerer et al. (1993) for single stars and the newer models by Claret (2006), respectively. The plots illustrate that these post-mass transfer stars are oversized and overluminous for their masses. According to the isochrones of Claret (2006) in a mass-radius diagram for single stars, the primary of LMC-SC1-105 has an age Myr, while the age of the secondary is Myr (see Figure 13), which is not in agreement with them being coeval. This apparent age discrepancy can be explained by mass-transfer. The ages of the stars according to the evolutionary models of Schaerer et al. (1993) in a luminosity-temperature diagram are Myr for the primary and Myr for the secondary.
Massey et al. (2000) have estimated the age and mass of LMC-SC1-105 (or LH 81-72, W28-22), which is located in the LH 81 association. They find a range of log(age[yr]) between 5.55-6.77 for the highest mass unevolved stars and a turnoff mass around . Figure 13 indicates an age of Myr or log(age[yr]) for the primary, in agreement with the value of 6.61 derived by Massey et al. (2000) for LMC-SC1-105. They also find a range of reddenings mag for LH 81 and a mean value of 0.15 mag. Late O-stars have , therefore the measured color of LMC-SC1-105 ( mag) implies a reddening value 0.14 mag. Interestingly, LH 81 contains several evolved stars: the WC4 star BR 50, the WN4+OB star BR 53 and the B0I+WN star Sk -194 (Massey et al., 2000). LMC-SC1-105 is found by these authors to have a mass of assuming it is single. This value is 26% greater than the dynamical mass of the primary or 12% smaller than the total mass of its components, illustrating the systematic error encountered in the study of massive stars, which could also affect estimations of the masses of their parent clusters.
Given that LMC-SC1-105 has exchanged mass, a comparison with models of close binary evolution is needed to infer the initial masses of the components, however models at the metallicity of the LMC do not currently exist. According to the solar metallicity evolutionary models of Nelson & Eggleton (2001), LMC-SC1-105 could have had the following initial masses, listed as pairs of primary and secondary masses: (25.1, 22.4), (39.8, 35.5), (50.0, 44.6) M⊙, implying an initial mass ratio of 0.90. Lower masses for the initial primary do not result in the measured mass ratio. These models assume conservative mass-transfer, however the sum of predicted inital masses (47 M⊙) is greater than the sum of the final, measured masses (44.1 M⊙). Furthermore, de Mink et al. (2007) have shown that conservative evolution is not a valid assumption, by comparing 50 SMC eclipsing binaries (from Harries et al., 2003; Hilditch et al., 2005) with their grid of models for a range of mass-transfer efficiencies. A similar grid at the metallicity of the LMC is therefore necessary to estimate the initial parameters of the binary.
What will the end product of the evolution of LMC-SC1-105 be? The primary has a large fill-out ratio of , as defined by Mochnacki & Doughty (1972), implying that it will quickly fill its Roche lobe when it leaves the main sequence and the hydrogen shell burning phase begins. Further modeling of LMC-SC1-105, following de Mink et al. (2007) or Petrovic et al. (2005) for the mass-transfer efficiency, could indicate if the secondary will evolve into a Wolf-Rayet star and subsequently explode as a core-collapse supernova or a common envelope phase will cause the stars to merge.
7 Conclusions
This paper presents accurate (to better than ) fundamental parameters of LMC-SC1-105, one of the brightest blue eclipsing binary stars in the LMC found by the OGLE survey. The aim of this work is twofold: 1) to demonstrate that targeted surveys of the brightest blue eclipsing binaries in nearby galaxies do indeed select very massive stars and 2) to measure accurate parameters for one of these rare systems. The parameters of LMC-SC1-105 were determined from the light curves available from the OGLE and MACHO surveys and newly acquired high resolution spectroscopy that targeted quadrature phases, in part applying the strategy proposed by González et al. (2005) to constrain the radial velocity curve with a small number of spectra. The system was found to contain a very massive main sequence primary () and a possibly evolved Roche lobe-filling secondary. The spectra display the Struve-Sahade effect, which is present in all the He I lines, causing the spectral classification to change with phase, and could be related to the mass transfer occurring in the system. LMC-SC1-105 could further be used as a distance indicator to the LMC. However, in addition to accurate radii, accurate flux (i.e. effective temperatures) and extinction estimates are necessary for accurate distances. Eclipsing binaries have been used to derive accurate and independent distances to the LMC (e.g. Guinan et al., 1998; Fitzpatrick et al., 2003), the Small Magellanic Cloud (Harries et al., 2003; Hilditch et al., 2005), M31 (Ribas et al., 2005) and most recently to M33 (Bonanos et al., 2006).
The accurate parameters determined herein for LMC-SC1-105 contribute valuable data on very massive stars, increasing the current sample of 14 very massive stars with accurate parameters to 15, which despite their importance remain poorly studied. Such data serve as an external check to resolve the “mass discrepancy” problem, as Burkholder et al. (1997) have shown, and to constrain stellar atmosphere, evolution and formation models. Further systematic studies of massive binaries in nearby galaxies are needed to extend the sample of 50 SMC eclipsing binaries (Harries et al., 2003; Hilditch et al., 2005) to higher masses and metallicities and populate the sparsely sampled parameter space (mass, metallicity, evolutionary state) with accurate measurements of their masses and radii. The method of targeting very massive stars in bright blue eclipsing binaries can therefore be employed towards this goal.


References
- Andersen (1991) Andersen, J. 1991, A&A Rev., 3, 91
- Bagnuolo et al. (1999) Bagnuolo, Jr., W. G., Gies, D. R., Riddle, R., & Penny, L. R. 1999, ApJ, 527, 353
- Bally & Zinnecker (2005) Bally, J. & Zinnecker, H. 2005, AJ, 129, 2281
- Bernstein et al. (2003) Bernstein, R. et al. 2003, in SPIE, Vol. 4841, pp. 1694-1704, ed. M. Iye & A. F. M. Moorwood
- Bonanos (2007) Bonanos, A. Z. 2007, AJ, 133, 2696
- Bonanos et al. (2006) Bonanos, A. Z., Stanek, K. Z., Kudritzki, R. P., et al. 2006, ApJ, 652, 313
- Bonanos et al. (2004) Bonanos, A. Z., Stanek, K. Z., Udalski, A., et al. 2004, ApJ, 611, L33
- Bouret et al. (2003) Bouret, J.-C., Lanz, T., Hillier, D. J., et al. 2003, ApJ, 595, 1182
- Bromm & Loeb (2006) Bromm, V. & Loeb, A. 2006, ApJ, 642, 382
- Burkholder et al. (1997) Burkholder, V., Massey, P., & Morrell, N. 1997, ApJ, 490, 328
- Claret (2000) Claret, A. 2000, A&A, 363, 1081
- Claret (2006) —. 2006, A&A, 453, 769
- de Mink et al. (2007) de Mink, S. E., Pols, O. R., & Hilditch, R. W. 2007, A&A, 467, 1181
- Derekas et al. (2007) Derekas, A., Kiss, L. L., & Bedding, T. R. 2007, ApJ, 663, 249
- Elmegreen (2000) Elmegreen, B. G. 2000, ApJ, 539, 342
- Faccioli et al. (2007) Faccioli, L., Alcock, C., Cook, K., et al. 2007, AJ, 134, 1963
- Fernández Lajús & Niemela (2006) Fernández Lajús, E. & Niemela, V. S. 2006, MNRAS, 367, 1709
- Figer (2005) Figer, D. F. 2005, Nature, 434, 192
- Fitzpatrick et al. (2003) Fitzpatrick, E. L., Ribas, I., Guinan, E. F., et al. 2003, ApJ, 587, 685
- Fryer et al. (2007) Fryer, C. L., Mazzali, P. A., Prochaska, J., et al. 2007, PASP, 119, 1211
- Gies (2003) Gies, D. R. 2003, in IAU Symposium, Vol. 212, A Massive Star Odyssey: From Main Sequence to Supernova, ed. K. van der Hucht, A. Herrero, & C. Esteban, 91–+
- González et al. (2005) González, J. F., Ostrov, P., Morrell, N., & Minniti, D. 2005, ApJ, 624, 946
- Guinan et al. (1998) Guinan, E. F., Fitzpatrick, E. L., Dewarf, L. E., et al. 1998, ApJ, 509, L21
- Hadrava (1995) Hadrava, P. 1995, A&AS, 114, 393
- Harries et al. (2003) Harries, T. J., Hilditch, R. W., & Howarth, I. D. 2003, MNRAS, 339, 157
- Herrero (2007) Herrero, A. 2007, RevMexAA in press (arxiv:0704.3528)
- Hilditch (2001) Hilditch, R. W. 2001, An Introduction to Close Binary Stars (An Introduction to Close Binary Stars, by R.W. Hilditch. Cambridge University Press, 2001, 392 pp.)
- Hilditch et al. (2005) Hilditch, R. W., Howarth, I. D., & Harries, T. J. 2005, MNRAS, 357, 304
- Hillier & Miller (1998) Hillier, D. J. & Miller, D. L. 1998, ApJ, 496, 407
- Howarth et al. (1997) Howarth, I. D., Siebert, K. W., Hussain, G. A. J., et al. 1997, MNRAS, 284, 265
- Kelson (2003) Kelson, D. D. 2003, PASP, 115, 688
- Kelson et al. (2000) Kelson, D. D. et al. 2000, ApJ, 531, 159
- Krumholz & Thompson (2007) Krumholz, M. R. & Thompson, T. A. 2007, ApJ, 661, 1034
- Lanz & Hubeny (2003) Lanz, T. & Hubeny, I. 2003, ApJS, 146, 417
- Linder et al. (2007) Linder, N., Rauw, G., Sana, H., et al. 2007, A&A, 474, 193
- Lucy (2006) Lucy, L. B. 2006, A&A, 457, 629
- Maíz Apellániz et al. (2007) Maíz Apellániz, J., Walborn, N. R., Morrell, N. I., et al. 2007, ApJ, 660, 1480
- Martins et al. (2005) Martins, F., Schaerer, D., & Hillier, D. J. 2005, A&A, 436, 1049
- Massey (2003) Massey, P. 2003, ARA&A, 41, 15
- Massey et al. (2002) Massey, P., Penny, L. R., & Vukovich, J. 2002, ApJ, 565, 982
- Massey et al. (2005) Massey, P., Puls, J., Pauldrach, A. W. A., et al. 2005, ApJ, 627, 477
- Massey et al. (2000) Massey, P., Waterhouse, E., & DeGioia-Eastwood, K. 2000, AJ, 119, 2214
- Mayer et al. (2005) Mayer, P., Drechsel, H., & Lorenz, R. 2005, ApJS, 161, 171
- Mayer et al. (2008) Mayer, P., Harmanec, P., Nesslinger, S., et al. 2008, A&A, 481, 183
- Mazeh et al. (2006) Mazeh, T., Tamuz, O., & North, P. 2006, MNRAS, 367, 1531
- Meynet & Maeder (2003) Meynet, G. & Maeder, A. 2003, A&A, 404, 975
- Mochnacki & Doughty (1972) Mochnacki, S. W. & Doughty, N. A. 1972, MNRAS, 156, 51
- Mokiem et al. (2007) Mokiem, M. R., de Koter, A., Evans, C. J., et al. 2007, A&A, 465, 1003
- Nelson & Eggleton (2001) Nelson, C. A. & Eggleton, P. P. 2001, ApJ, 552, 664
- Niemela et al. (2006) Niemela, V. S., Morrell, N. I., Fernández Lajús, E., et al. 2006, MNRAS, 367, 1450
- O’Connell (1951) O’Connell, D. J. K. 1951, Publications of the Riverview College Observatory, 2, 85
- Oey & Clarke (2005) Oey, M. S. & Clarke, C. J. 2005, ApJ, 620, L43
- Orosz et al. (2007) Orosz, J. A., McClintock, J. E., Narayan, R., et al. 2007, Nature, 449, 872
- Ostrov (2001) Ostrov, P. G. 2001, MNRAS, 321, L25
- Ostrov & Lapasset (2003) Ostrov, P. G. & Lapasset, E. 2003, MNRAS, 338, 141
- Ostrov et al. (2001) Ostrov, P. G., Morrell, N. I., & Lapasset, E. 2001, A&A, 377, 972
- Petrovic et al. (2005) Petrovic, J., Langer, N., & van der Hucht, K. A. 2005, A&A, 435, 1013
- Pinsonneault & Stanek (2006) Pinsonneault, M. H. & Stanek, K. Z. 2006, ApJ, 639, L67
- Prša & Zwitter (2005) Prša, A. & Zwitter, T. 2005, ApJ, 628, 426
- Puls et al. (2005) Puls, J., Urbaneja, M. A., Venero, R., et al. 2005, A&A, 435, 669
- Pych (2004) Pych, W. 2004, PASP, 116, 148
- Rauw et al. (2004) Rauw, G., De Becker, M., Naze, Y., et al. 2004, A&A, 420, L9
- Repolust et al. (2004) Repolust, T., Puls, J., & Herrero, A. 2004, A&A, 415, 349
- Ribas et al. (2005) Ribas, I., Jordi, C., Vilardell, F., et al. 2005, ApJ, 635, L37
- Santolaya-Rey et al. (1997) Santolaya-Rey, A. E., Puls, J., & Herrero, A. 1997, A&A, 323, 488
- Schaerer et al. (1993) Schaerer, D., Charbonnel, C., Meynet, G., et al. 1993, A&AS, 102, 339
- Schaller et al. (1992) Schaller, G., Schaerer, D., Meynet, G., & Maeder, A. 1992, A&AS, 96, 269
- Schnurr et al. (2008) Schnurr, O., Casoli, J., Chené, A.-N., et al. 2008, MNRAS, 389, L38
- Schwarzenberg-Czerny (1989) Schwarzenberg-Czerny, A. 1989, MNRAS, 241, 153
- Simon & Sturm (1994) Simon, K. P. & Sturm, E. 1994, A&A, 281, 286
- Soszynski et al. (2008) Soszynski, I., Poleski, R., Udalski, A., et al. 2008, AcA, submitted (astro-ph/0808.2210)
- Southworth & Clausen (2007) Southworth, J. & Clausen, J. V. 2007, A&A, 461, 1077
- Stickland (1997) Stickland, D. J. 1997, The Observatory, 117, 37
- Tonry & Davis (1979) Tonry, J. & Davis, M. 1979, AJ, 84, 1511
- Vitrichenko et al. (2007) Vitrichenko, E. A., Nadyozhin, D. K., & Razinkova, T. L. 2007, Astronomy Letters, 33, 251
- Walborn & Fitzpatrick (1990) Walborn, N. R. & Fitzpatrick, E. L. 1990, PASP, 102, 379
- Walborn et al. (2002) Walborn, N. R., Howarth, I. D., Lennon, D. J., et al. 2002, AJ, 123, 2754
- Wilson (1979) Wilson, R. E. 1979, ApJ, 234, 1054
- Wilson (1990) —. 1990, ApJ, 356, 613
- Wilson & Devinney (1971) Wilson, R. E. & Devinney, E. J. 1971, ApJ, 166, 605
- Wyrzykowski et al. (2003) Wyrzykowski, L., Udalski, A., Kubiak, M., et al. 2003, Acta Astronomica, 53, 1
- Yungelson et al. (2008) Yungelson, L. R., van den Heuvel, E. P. J., Vink, J. S., et al. 2008, A&A, 477, 223
- Zebrun et al. (2001) Zebrun, K., Soszynski, I., Wozniak, P. R., et al. 2001, Acta Astronomica, 51, 317
- Zinnecker & Yorke (2007) Zinnecker, H. & Yorke, H. W. 2007, ARA&A, 45, 481
- Zucker & Mazeh (1994) Zucker, S. & Mazeh, T. 1994, ApJ, 420, 806
| Eclipsing Binary | Mass | Radius | Reference | ||
|---|---|---|---|---|---|
| Namea | (M⊙) | (M⊙) | (R⊙) | (R⊙) | |
| FO15 A | 30.0 | 1.0 | 16.0 | 1.0 | Niemela et al. (2006) |
| LS1135 A | 30.0 | 1.0 | 12.0 | 1.0 | Fernández Lajús & Niemela (2006) |
| V1007 Sco B | 30.1 | 0.4 | 15.3 | 0.5 | Mayer et al. (2008) |
| V1182 Aql A | 31.0 | 0.6 | 9.00 | 0.18 | Mayer et al. (2005) |
| WR 20a B | 82.0 | 5.0 | 19.3 | 0.3 | Rauw et al. (2004); Bonanos et al. (2004) |
| WR 20a A | 83.0 | 5.0 | 19.3 | 0.3 | Rauw et al. (2004); Bonanos et al. (2004) |
| LMC-SC1-105 A | 30.9 | 1.0 | 15.1 | 0.2 | This Work |
| LMC Sk-67∘105 B | 31.4 | 0.7 | 13.8 | 0.4 | Ostrov & Lapasset (2003) |
| LMC R136-42 B | 32.6 | 0.1 | 6.7 | 0.7 | Massey et al. (2002) |
| LMC HV 2241 A | 36.2 | 0.7 | 14.9 | 0.4 | Ostrov et al. (2001) |
| LMC R136-42 A | 40.3 | 0.1 | 7.4 | 0.8 | Massey et al. (2002) |
| LMC MACHO 053441.3 A | 41.2 | 1.2 | 9.56 | 0.02 | Ostrov (2001) |
| LMC Sk-67∘105 A | 48.3 | 0.7 | 16.9 | 0.4 | Ostrov & Lapasset (2003) |
| LMC R136-38 A | 56.9 | 0.6 | 9.3 | 1.0 | Massey et al. (2002) |
| M33 X-7 | 70.0 | 6.9 | 19.6 | 0.9 | Orosz et al. (2007) |
| UT | Telescope/ | Exp. time | S/N at |
|---|---|---|---|
| Date | Instrument | (sec) | 4500Å |
| 20051202 | DuPont/Echelle | 21200 | 45 |
| 20051204 | DuPont/Echelle | 21200 | 60 |
| 20051206 | DuPont/Echelle | 21200 | 50 |
| 20060126 | Clay/MIKE | 1200 | 30 |
| 20060131 | DuPont/Echelle | 11200 | 40 |
| 20060202 | DuPont/Echelle | 11200 | 35 |
| 20060204 | DuPont/Echelle | 11200 | 40 |
| 20071024 | Clay/MIKE | 1600 | 90 |
| 20071026 | Clay/MIKE | 1600 | 80 |
| HJD | Phase | RV1 | RV2 | ||
|---|---|---|---|---|---|
| 2450000 | (km s-1) | (km s-1) | (km s-1) | (km s-1) | |
| 3706.76777 | 0.71 | 415 | 1 | 25 | 0 |
| 3708.67764 | 0.16 | 185 | 16 | 550 | 1 |
| 3710.79198 | 0.65 | 400 | 5 | 20 | 4 |
| 3761.56453 | 0.60 | 335 | 27 | 110 | 29 |
| 3766.55222 | 0.77 | 420 | 1 | 20 | 12 |
| 3768.61519 | 0.26 | 140 | 8 | 600 | 3 |
| 3770.62013 | 0.73 | 430 | 12 | 25 | 8 |
| 4397.80634 | 0.27 | 145 | 5 | 600 | 1 |
| 4399.84620 | 0.75 | 415 | 5 | 50 | 15 |
| Parameter | Value |
|---|---|
| Period, P | 4.250806 0.000001 days |
| Inclination, | 89.9 0.9∘ |
| Surface potential, | 3.073 0.003 |
| Light ratio in , | 0.45 0.02 |
| Mass ratio, | 0.42 0.02 |
| Systemic velocity, | |
| Semi-major axis, | |
| Semi-amplitude, | |
| Semi-amplitude, | |
| Fill-out ratio, F1 | 0.885 0.003 |
| Radius, | 0.373 0.001 |
| ………… | 0.416 0.001 |
| ………… | 0.389 0.001 |
| ………… | 0.402 0.001 |
| ………… a | 0.389 0.001 |
| Parameter | Primary | Secondary |
|---|---|---|
| Mass (M⊙) | ||
| Radius (R⊙) | ||
| (cgs) | ||
| (K) | ||