New M-dwarf debris disk candidates in NGC 2547
Abstract
With only six known examples, M-dwarf debris disks are rare, even though M dwarfs constitute the majority of stars in the Galaxy. After finding a new M dwarf debris disk in a shallow mid-infrared observation of NGC 2547, we present a considerably deeper Spitzer-MIPS image of the region, with a maximum exposure time of 15 minutes per pixel. Among sources selected from a previously published membership list, we identify nine new M dwarfs with excess emission at 24 m tracing warm material close to the snow line of these stars, at orbital radii of less than 1 AU. We argue that these are likely debris disks, suggesting that planet formation is under way in these systems. Interestingly, the estimated excess fraction of M stars appears to be higher than that of G and K stars in our sample.
1 Introduction
Even though about 80 % of the stars in the Galaxy are M dwarfs (Lada, 2006), only very few of these are known to harbor debris disks. This is even more surprising since many M dwarfs do show signs of protoplanetary disks in earlier stages of evolution with similar frequency as more massive stars (e.g., Andrews & Williams, 2005, Muzerolle et al., 2006, Lada et al., 2006) and we now know seven M dwarfs that harbor extrasolar planets (most recently Endl et al., 2008, see references therein). While protoplanetary disks contain large amounts of primordial gas and dust out of which planets form, debris disks are older and entirely made of collisionally evolving planetesimals and dust particles. Debris disks, thus, are secondary products of the planet formation process and their existence in a given system implies previous formation of protoplanets. Compared to optically thick protoplanetary disks, debris disks are fainter and optically thin. For a recent observational and theoretical review of debris disks, see Meyer et al. (2007) and Moro-Martin et al. (2008).
Since the cold dust in debris disks is best studied at far-infrared (FIR) or submillimeter wavelengths, the Spitzer Space Telescope, given its unprecedented FIR sensitivity, has revolutionized the research on the role of debris disks in star and planet formation. Most of the Spitzer studies of debris disks have been carried out using the Multiband Imaging Photometer for Spitzer (MIPS, Rieke et al., 2004), operating at wavelengths of 24 m, 70 m, and 160 m.
Prior to our study, only six debris disks around M dwarfs were known. Early studies based on data obtained by IRAS, the Infrared Astronomical Satellite, reported far-infrared excess emission towards a small number of field M stars (Tsikoudi, 1988; Mullan et al., 1989; Mathioudakis & Doyle, 1991), but few of these results could be confirmed subsequently (e.g., Song et al., 2002; Riaz et al., 2006). The first firm detection of an excess was the disk of AU Mic (Kalas et al., 2004; Liu, 2004), a member of the Pic moving group with an age of 12 Myr. The discovery observation was made with a stellar coronograph detecting scattered light in near-infrared broad-band filters. AU Mic was also found to have excess emission at 70 m, but not at 24 m (Chen et al., 2005). Subsequently, in submillimeter radio observations at 850 m, Liu et al. (2004) identified GJ 182, a member of the Local Association Group with an age of 50 Myr, as harboring a debris disk. GJ 182 does not show a far-infrared excess in the Spitzer-MIPS study of Chen et al. (2005). In Spitzer-MIPS data of NGC 2547, a cluster at an age of 30–40 Myr, Young et al. (2004) detected the third M star debris disk (source 23 in our Table 2, see also Teixeira et al., in prep.). TWA 7 was the fourth object reported; it is a member of the TW Hya association with an age of Myr and excess emission reported at 24 m, 70 m, and submillimeter radio wavelengths (Low et al., 2005; Matthews et al., 2007). One field M dwarf (GJ 842.2) was found to have a debris disk (in submillimeter observations, Lestrade et al., 2006). Finally, Gorlova et al. (2007) identified one additional M dwarf debris disk in NGC 2547 at 24 m, listed as source 22 in our Table 2.
Only three sources (TWA 7, source 22, and source 23) have been identified as far-infrared excess sources at 24 m, while the other sources have been found at either 70 m (AU Mic) or submillimeter radio wavelengths. Since material of quite different distances from the central star is probed with these two techniques, debris disks identified in the mid-infrared and in submillimeter radio are not necessarily directly comparable to one another.
Studying a sample of 62 field M dwarfs estimated to be older than 1 Gyr, Gautier et al. (2007) did not find any indication of excess emission at 24 m or 70 m indicative of debris disks (see also Plavchan et al., 2005; Riaz et al., 2006). In contrast to these Spitzer results, Lestrade et al. (2006) discuss two sets of (sub-)millimeter data, including previously published observations, and find three detections of excess emission in a sample of 23 M dwarfs with ages ranging from 20–200 Myr, corresponding to an excess fraction of %, which may not be significantly different from the disk fractions of earlier spectral types.
After identifying an M dwarf debris disk in earlier Spitzer observations of NGC 2547 (source 23, see above), we performed ten times longer Spitzer-MIPS 24 m observations of the same region in order to find out whether this was a singular object or part of a larger population. In the remainder of the introduction, we summarize the current knowledge about NGC 2547 before describing the observations in Section 3. We present the results in Section 4, including remarks on the 70 m and 160 m data as well as variability at 24 m, discuss these results in Section 5 and close with a summary in Section 6.
2 Background: Cluster Parameters
NGC 2547 is a young open cluster at a distance of pc (Robichon et al., 1999) and an average visual extinction of only mag (Clariá, 1982). It has an approximate age of Myr (Lyra et al., 2006, who fit four different evolutionary tracks to UBVRI photometry, three of them yielding the older age). Naylor & Jeffries (2006) determine an age of Myr (and a lower distance of pc) from a fit to a color-magnitude diagram, improving on an earlier age estimate in the range of 20 – 35 Myr (Naylor et al., 2002, based on BVI photometry). Young et al. (2004) discuss the disk population based on Spitzer imaging data, including one epoch of the MIPS data presented in this paper, as does Gorlova et al. (2007). Both of them use the data we mark as “epoch 1”.
Gorlova et al. (2007) provide a membership list based on a deep RIZ survey carried out by Jeffries et al. (2004). While the latter paper distinguishes empirical candidate members derived using different evolutionary tracks, Gorlova et al. (2007) use photometric, spectroscopic, and proper motion information for different subsamples to produce a single list of 806 “highly probable members”. However, 64 of these sources appear not to warrant such a classification because they are located in the two fields that Jeffries et al. (2004) used to check for galactic contamination, far from the actual cluster (outside the coverage of Fig. 1). Therefore, the total number of “highly probable members” is 742. Twelve sources in the full list do not have 2MASS-K magnitudes, although they are detected in band. Gorlova et al. (2007) also provide near-infrared spectra for 89 sources. Irwin et al. (2008) determine rotation periods at optical wavelengths for 176 photometrically selected candidate members. 128 of these have counterparts in the “highly probable members” listed by Gorlova et al. (2007).
3 Observations and Data Reduction
We present a deep Spitzer-MIPS observation of the central part of NGC 2547. The combined dataset that we are discussing here consists of all MIPS maps taken of NGC 2547 to date; it includes the one map analyzed by Gorlova et al. (2007). We took ten additional maps, but due to an instrument failure during observation, one map was lost. Thus, we discuss a total of ten different maps that can be grouped into three epochs (Table 1). All but epoch 1 also have 70 m data. Additional 160 m data was taken in the three observations of epoch 2.
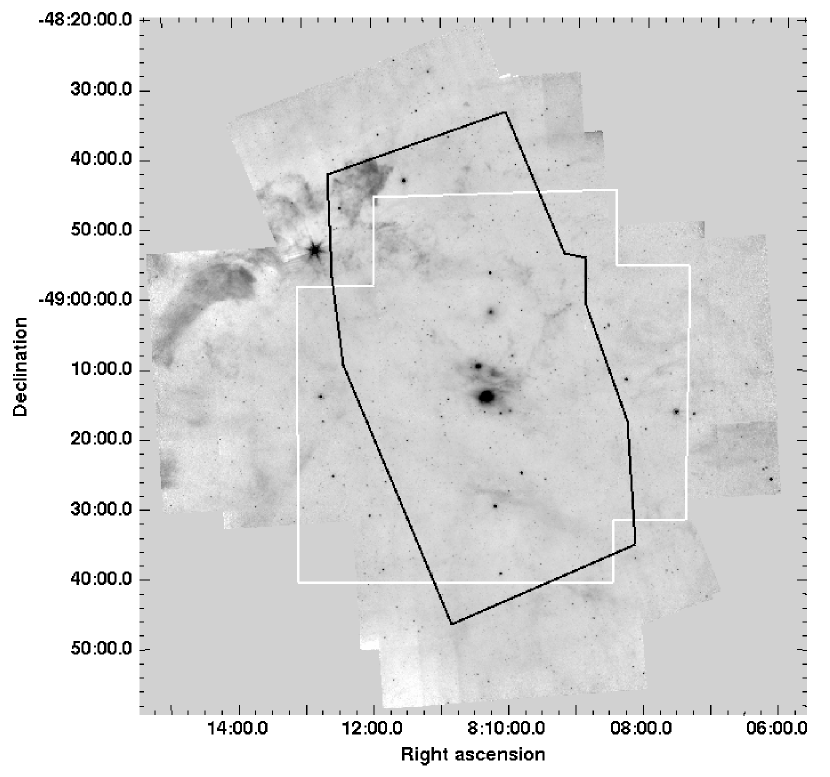
The entire 24 m dataset consists of 21127 “basic-calibrated data” (BCD) files, processed with pipeline S14.4.0. These data were reduced using the Spitzer MOsaicker and Point source EXtractor (MOPEX, Makovoz & Marleau, 2005), version 030106. In order to produce a single deep map out of single maps with different background levels, the MOPEX task overlap.pl was used on subsets of the full dataset after flatfield correction. The subsequent data reduction steps including median filtering, outlier detection and masking before coadding and combining were carried out on these subsets of BCDs. The resulting map is shown in Fig. 1. The map shows that the region is largely devoid of extended emission, as faint extended features can only be seen in the logarithmically stretched image. Subsequently, the Spitzer Astronomical Point Source EXtraction (APEX) software was used for photometry on the resulting maps, applying point-response-function (PRF) fitting with local noise estimation and a cutoff based on the signal-to-noise ratio (SNR). Prior to the actual photometry, a sample PRF was determined from several well-detected stars in the field. A number of objects were detected in several of the overlap-corrected map chunks which themselves are overlapping. In these cases, photometry was taken from the map with the higher exposure map value in order to ensure optimal coverage. The photometric accuracy was checked by subtracting the fitted sources from the original maps in order to create residual maps. Only two sources have residuals that are clearly off (even negative); both are bright sources within extended emission (see also discussion below). Corresponding steps were taken for the analysis of the 70 m and 160 m data. For comparison, point-response function photometry was also performed on the newly reduced archival IRAC data.
| Epoch | UT start date & time | further obs. |
|---|---|---|
| 1 | 2004-01-28 19:17:57.6 | – |
| 2a | 2006-05-08 23:01:46.6 | 70, 160 m |
| 2b | 2006-05-09 07:29:42.3 | 70, 160 m |
| 2c | 2006-05-09 12:02:06.3 | 70, 160 m |
| 3a | 2006-12-01 22:01:58.8 | 70 m |
| 3b | 2006-12-02 01:03:24.0 | 70 m |
| 3c | 2006-12-03 21:36:33.4 | 70 m |
| 3d | 2006-12-04 00:38:00.7 | 70 m |
| 3e | 2006-12-04 03:44:48.9 | 70 m |
| 3f | 2006-12-04 06:46:16.2 | 70 m |
4 Results
4.1 24 m data
4.1.1 Source detection
At a 3 detection level, a total of 27042 sources is detected. This is our full sample with all detections in the full coverage area, including outlying areas which were covered only once. The effective exposure time per pixel in this full dataset varies by a factor of ten across the map. In order to have a more homogeneous dataset, we only use detections with at least 2/3 of the maximum effective exposure time per pixel ( s) in a second sample. This second sample, which we will refer to as the core area, focuses on the central region of NGC 2547; it includes 6390 sources. The distribution of 24 m magnitudes in this core area peaks at a value of 11.6 mag which compares to a peak at 10.8 mag in the epoch 1 data used by Gorlova et al. (2007). Every single map roughly has 10% of the total maximum effective exposure time per pixel.


As a first step, the 24 m detections were correlated with the 2MASS point source catalogue since all candidate members should be NIR-detected. There are 1945 sources from the full list that have 2MASS counterparts within . This radius corresponds to 3 times the half-width half-maximum of a Gaussian distribution fitted to the angular separations between the 2MASS and the MIPS data; it was used for all subsequent correlations. Fig. 2 shows that there is a good correlation between 24 m and K band magnitudes down to K. The scatter of 24 m magnitudes for sources with a given K magnitude of mag indicates that these are likely galaxies instead of single stars since 2MASS photometric errors in increase significantly only beyond mag.
In fact, only 646 sources out of the 6390 sources in the core area have 2MASS counterparts, indicating that the overwhelming majority of the sources we detect at 24 m are galaxies that are too faint in the K band to be detected by 2MASS. Out of the 6390 sources, 208 have counterparts in the Gorlova membership table. Correlating all 27042 sources in our entire dataset to the Gorlova list yields 265 counterparts. This means that the white polygon in Fig. 1 encompasses 265 detections while the black polygon contains 208 detections. Gorlova et al. (2007) extracted 74 candidate members with 24 m counterparts (from the map we list as Epoch 1); 64 of these are detected in the core area although it actually covers 71 of them. The seven missing sources either did not pass our SNR selection criterion or the angular distance between a detection and the catalog position was too large. The median magnitude difference at 24 m between Gorlova et al. (2007) and our dataset is 0.04 mag, including five cases where the difference is larger than 0.5 mag (these are the bright sources within extended emission; the maximum difference is 1.5 mag).
The following discussion focuses on the core area. For the near-infrared photometry, we make use of the 2MASS and IRAC photometry from Gorlova et al. (2007). The deepest optical data come from the survey carried out by Jeffries et al. (2004). We therefore focus on the R-K color baseline.
Fig. 3 shows a direct comparison of photographic R band magnitudes from the USNO-B1 catalog with those from Jeffries et al. (2004). Because of band saturation problems for the brightest sources in this sample ( mag), we use R magnitudes from the USNO-B1 catalog (Monet et al., 2003) instead for those bright sources. The median difference in R between USNO-B1 and Jeffries et al. (2004) within the 208 candidate members is 0.13 mag, but it is considerably higher for the brightest sources (up to 3.9 mag). The photometric accuracy of the USNO-B1 catalog is given as 0.3 mag. By combining these two sets of photometry measurements, we can make use of reliable R band photometry for all 208 sources in our core sample, at the price of varying accuracy. For comparison, the R band photometry used by Gorlova et al. (2007) does not include information for 47 out of the 208 sources.
There are a few exceptions to our mag selection rule. Due to a binary source fitted as a single source in USNO-B1, two sources with mag only have Jeffries et al. (2004) photometry which we therefore use as best choice. There are nine other sources in the sample which have unreliable USNO-B1 photometry for the same reason. Also, two obviously faulty R band magnitudes in the core sample ( mag) were replaced by the USNO values. In total, we make use of USNO-B1 photometry for 53 out of the 208 sources.
In Fig. 4, we show the distributions in R-K of the 562 “highly probable members” with R-K photometry in our core area (using Jeffries et al., 2004 and USNO-B1 photometry), our 208 detections at 24 m, as well as those detections within our core area that were reported by Gorlova et al. (2007). These authors report R-K for only 26 out of their 74 detections at 24 m. For our analysis, we use the same combination of USNO-B1 and Jeffries et al. (2004) photometry for these sources that we also use for our own data to provide R magnitudes: seventy-one of the 24 m sources from Gorlova et al. (2007) are located in our core area and seventy now have reliable R band magnitudes. While by far not detecting all candidate members, we detect a considerably larger fraction than Gorlova et al. (2007). Fig. 4 indicates a completeness dropping to 50% in the K stars. However, although not complete, we still get a good sampling of K and M stars. It becomes immediately clear that more spectroscopic confirmations of photometric members are needed since there is a lot of contamination, especially due to the giant branch at R-K2.5. In fact, Jeffries et al. (2004) identify the region with 0.5R-I0.7 as particularly prone to contamination. There are 167 out of 562 candidate members in our core region that fall into this range which corresponds to a full range in R-K of 1.84 to 2.68. However, as will become clear later, this does not affect the discussion of the M stars.
Looking at the entire dataset, only 120 out of 265 highly probable members detected at 24 m have available V-K colors, ranging from –0.36 to 5.73. In the core area, this ratio is only 111 out of 208. Since, with the above procedure, we have R-K for all 208 sources of interest, we used R-K colors instead of V-K as a proxy for spectral type.
4.1.2 Excess sources

We used two different criteria to identify sources with excess emission at 24 m. Initially, following Gorlova et al. (2007), we used the 3 locus of the Pleiades stars in a K-24 vs. R-K diagram of our data. The Pleiades locus was derived by Gorlova et al. (2006, 2007). However, since the membership list for NGC 2547 is not yet definitive, we also looked at the distibution of all sources detected at 24 m in the same area for which R and K photometry is available, including 14 “less plausible” members from Gorlova et al. (2007). To crudely exclude extragalactic sources, we only use candidate non-members with mag (see above), yielding 275 sources in the core area. We characterize their location in the color-color diagram by determining the standard deviation in 25 R-K bins of equal sample size, clipping the most extreme point in every bin. The resulting color-color exclusion zone is defined as the 3 variation in every bin. Note that for the R-band photometry, we use the same combination of USNO-B1 and Jeffries et al. (2004) photometry that was also used for the members (see above).
According to these criteria, 54 sources have significant excess emission compared to the Pleiades, i.e., their 3 photometric error bars lie completely outside the 3 locus of the Pleiades. Twenty-six of these sources also are outside the color-color exclusion zone (including sources embedded in bright extended emission). In the following, we use the latter as the more conservative criterion to define excess sources. The results of the search for excess sources are summarized in Fig. 5 and in Table 2. Panel a) of Fig. 5 shows the definition of the color-color exclusion zone by plotting all 275 candidate non-member sources within the core area having 24 m detections as well as R and K magnitudes (with ). Panel b) shows all 24 m–detected “highly probable members” (Gorlova et al., 2007) within our core area, with the near-infrared photometry explained above. The lower panels show the significant excess sources when using the Pleiades (panel c) and the color-color exclusion zone (panel d) criteria. Both Pleiades locus and exclusion zone are shown in all plots. Panel d) additionally shows the previously identified four excess sources within the core area (using the exclusion zone criterion) (Gorlova et al., 2007) as circles. A fifth excess source in Gorlova et al. (2007), at R-K=1.95 mag and K-24=1.91 mag, is not detected in our data (and not shown in the plot) because the positional difference between the 24 m source and the NIR counterpart is too large ( in our case). Since the 24 m magnitudes are nearly identical, this is probably the same source, however.
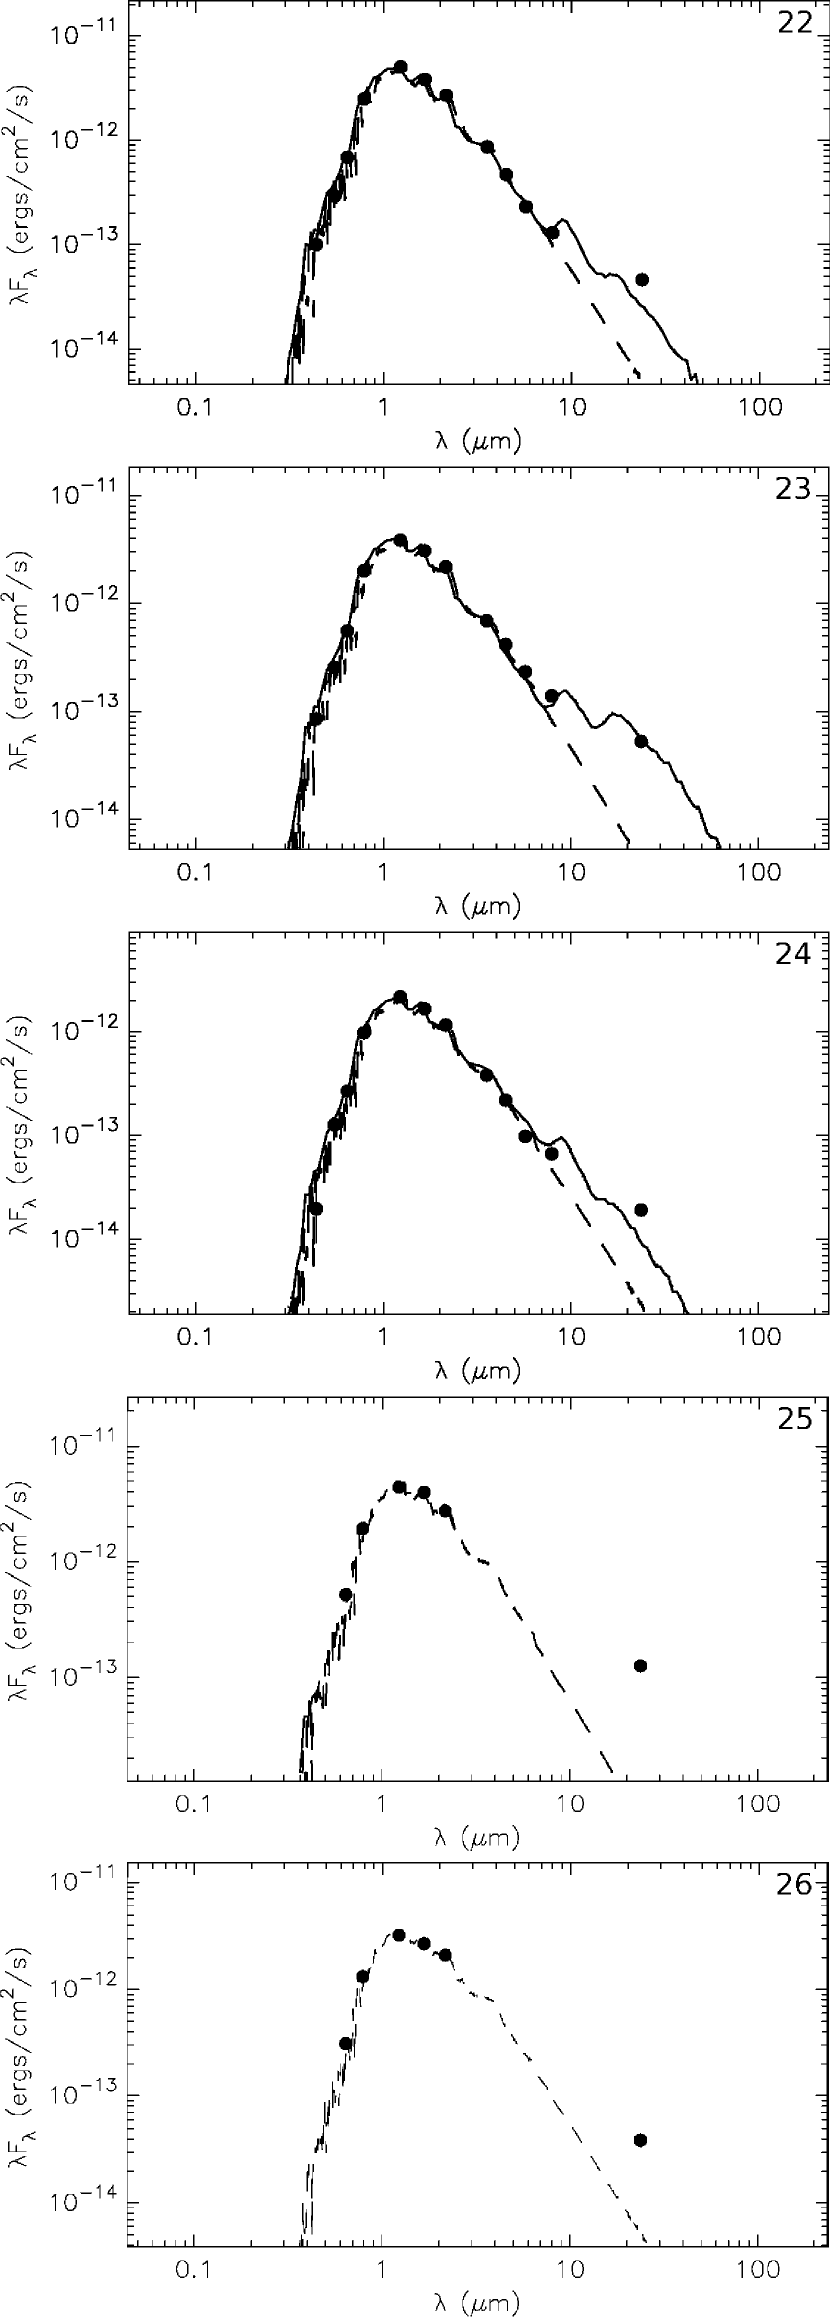
We estimate sensitivity across R-K by assuming a limiting magnitude at 24 m and calculating the distribution in K-24 m vs. R-K of the 554 “highly probable members” located in the core area that have suitable photometry (eight sources lack 2MASS-K photometry). We then determine the standard deviation in K-24 m for 46 bins containing nearly the same sample sizes, with a fixed value at 24 m of 11.6 mag (see above), thus characterizing the distribution per R-K bin. Also this analysis takes into account USNO-B1 photometry for the brightest sources. Panel d) of Fig. 5 shows the mean of this distribution. It becomes clear that for late M dwarfs, we can only detect excess sources, whereas for earlier spectral types, we can also detect photospheres, although the detections of K and M dwarfs are not complete. In fact, most of the M dwarfs that we detect at 24 m (14 out of 25) do not show significant excess emission. To corroborate this result, we show the SED of a spectroscopically confirmed M0 member that we detect as a source with a significance of 4.6 at 24 m at presumably photospheric emission levels in Fig. 6.
Gorlova et al. (2007) report 26 sources with 24 m detections as well as R and K photometry, of which nine have excess emission compared to the Pleiades and six have excess emission with respect to our color-color exclusion zone. Only one of these sources is not in our core area. Another source from within these six sources is 3.6′′ from the nearest 2MASS source in our data, so we do not list it. The remaining four previously identified excess sources are marked as circles in panel d) of Fig. 5.
As remarked by Gorlova et al. (2007), five of the 24 m-brightest sources covered in both their data and our core area are embedded in bright extended emission. Four out of these five technically have excess emission, even according to the color-color exclusion zone criterion, but the extended structures are too large to represent debris disks. We compared the the PRF-fitting photometry with aperture photometry and found that the the former appears to reasonably reflect the actual source brightness in the central areas while the curve of growth of the latter does not converge. The photometric results for these bright sources with extended emission have to be interpreted with caution.
Even though we are dealing with relatively low numbers, it is interesting to look at the excess fraction per spectral type, as derived from R-K colors, which we plot in Fig. 7. While the contamination of the membership list makes it difficult to state exact fractions, this problem is mostly constrained to the K stars (see Fig. 4), where many of the “highly probable members” may be background giants. Even though our data are not complete for M dwarfs, 11 of 26 significant excess sources are M dwarfs, corresponding to a lower limit of 4.9% of all “highly probable” member M stars in the area, or 44% of the M dwarfs we detect at 24 m. Four of these 11 M dwarfs are spectroscopically confirmed members (Table 2). The excess rate is is of particular interest given the minimum in the G stars, where we detect just a single significant excess source.
Warmer protoplanetary disks closer to the central star would be recognizable by their mid-infrared excess emission at shorter wavelengths, as probed by the Spitzer-IRAC bands. Referring otherwise to the discussion of the available IRAC data in Young et al. (2004) and Gorlova et al. (2007), who found an excess fraction of 1% in the IRAC bands, we note in particular that there is virtually no sign of excess emission in the IRAC bands towards the M dwarfs with 24 m excess emission (eight out of eleven are covered by the IRAC data; see also the discussion of the SEDs). The only excess detection is source 23, listed as ID 7 in Gorlova et al. (2007), which has an 8 excess at 8m.


| no. | 2MASS | K | R-K | err. | K-24 | err. | m | err. | spec?aaNear-infrared spectrum in 1) Oliveira et al. (2003), 2) Gorlova et al. (2007), 3) Jeffries & Oliveira (2005), 4) Jeffries et al. (2003). | commentsbbspectral type from SIMBAD, ‘X’ = XMM detection within , from Jeffries et al. (2006),‘P’ = optical period from Irwin et al. (2008), ‘G’ = previously identified 24 m source (Gorlova et al., 2007), ‘RV’ = confirmed rad. vel. member (Jeffries et al., 2003; Jeffries & Oliveira, 2005), ‘extd’ = in bright extended emission, possibly unreliable 24 m photometry | SNR |
|---|---|---|---|---|---|---|---|---|---|---|---|
| [mag] | [mag] | [mag] | [mag] | [mag] | [mag] | [mag] | m | ||||
| 1 | J08102058–4914144 | 6.83 | -0.33 | 0.33 | 2.82 | 0.03 | 4.01 | 0.00 | B3III/IV, X, G, extd | 17.1 | |
| 2 | J08101607–4902058 | 7.65 | -0.29 | 0.32 | 1.06 | 0.02 | 6.59 | 0.00 | B5II, X, G, extd | 54.0 | |
| 3 | J08102725–4909509 | 8.06 | -0.14 | 0.33 | 3.45 | 0.03 | 4.61 | 0.00 | B6V, X, G, extd | 119.9 | |
| 4 | J08095753–4908202 | 8.95 | -0.01 | 0.32 | 1.89 | 0.02 | 7.06 | 0.00 | 2 | A0Vn, G, extd | 89.2 |
| 5 | J08100607–4914180 | 9.66 | 0.17 | 0.32 | 1.53 | 0.03 | 8.13 | 0.01 | 2 | A1V | 17.8 |
| 6 | J08092668–4914371 | 10.14 | 0.32 | 0.32 | 1.35 | 0.03 | 8.79 | 0.01 | 2 | 46.2 | |
| 7 | J08100841–4900434 | 9.55 | 0.39 | 0.32 | 1.19 | 0.03 | 8.37 | 0.01 | A3V | 77.0 | |
| 8 | J08111134–4904442 | 10.18 | 0.59 | 0.32 | 0.73 | 0.04 | 9.46 | 0.02 | 12.4 | ||
| 9 | J08084571–4923473 | 9.95 | 0.63 | 0.32 | 1.06 | 0.03 | 8.89 | 0.01 | 42.5 | ||
| 10 | J08110323–4900374 | 10.15 | 0.72 | 0.32 | 1.20 | 0.03 | 8.96 | 0.01 | 53.0 | ||
| 11 | J08093815–4918403 | 9.67 | 0.92 | 0.33 | 1.00 | 0.04 | 8.67 | 0.01 | 2 | A9V, G ID 2, X | 39.2 |
| 12 | J08090250–4858172 | 11.36 | 1.37 | 0.02 | 3.92 | 0.02 | 7.44 | 0.00 | 2 | G ID 8 | 162.1 |
| 13 | J08101799–4923502 | 11.65 | 1.75 | 0.03 | 0.72 | 0.09 | 10.93 | 0.07 | 2 | X | 9.2 |
| 14 | J08102955–4922094 | 12.35 | 2.22 | 0.03 | 1.17 | 0.11 | 11.18 | 0.09 | 6.0 | ||
| 15 | J08101691–4856291 | 11.12 | 2.59 | 0.03 | 6.87 | 0.02 | 4.25 | 0.00 | 2 | G ID 9, 70 m | 1500 |
| 16 | J08095330–4918132 | 12.85 | 3.35 | 0.04 | 1.37 | 0.15 | 11.48 | 0.12 | 4 | M2, RV, X | 3.9 |
| 17 | J08110007–4904413 | 13.05 | 3.35 | 0.04 | 1.37 | 0.17 | 11.68 | 0.14 | 3.3 | ||
| 18 | J08101374–4917112 | 13.16 | 3.59 | 0.04 | 1.34 | 0.19 | 11.82 | 0.16 | X, P | 3.1 | |
| 19 | J08105210–4921138 | 12.52 | 3.71 | 0.04 | 1.18 | 0.13 | 11.34 | 0.10 | X | 6.5 | |
| 20 | J08092450–4928575 | 12.68 | 3.80 | 0.04 | 1.35 | 0.13 | 11.33 | 0.10 | P | 5.5 | |
| 21 | J08094510–4846520 | 12.82 | 3.94 | 0.04 | 1.39 | 0.15 | 11.43 | 0.12 | 5.9 | ||
| 22 | J08091770–4908344 | 13.85 | 4.41 | 0.06 | 3.12 | 0.11 | 10.73 | 0.06 | 1,3 | M4.5, RV, P, G | 6.8 |
| 23 | J08093547–4913033 | 14.07 | 4.41 | 0.06 | 3.48 | 0.09 | 10.59 | 0.05 | 1,2,3 | M4.5, RV, G ID 7ccdiscovered by Young et al. (2004) | 8.5 |
| 24 | J08085407–4921046 | 14.76 | 4.52 | 0.11 | 2.77 | 0.29 | 11.99 | 0.20 | 1 | 4.8 | |
| 25 | J08104437–4939001 | 13.82 | 4.75 | 0.06 | 4.18 | 0.07 | 9.64 | 0.02 | 3 | M5, RV | 25.2 |
| 26 | J08101391–4939481 | 14.11 | 5.01 | 0.09 | 3.19 | 0.13 | 10.92 | 0.07 | 1ddLithium absorption with EW Å | 7.7 |
4.2 70 m and 160 m data
After data reduction, we performed PRF-fitting photometry on the 70 m and 160 m data using APEX at a 5 detection limit. In an image built from the filtered 70 m BCD data, 390 sources are detected. Within search radii of and , only one of the “highly probable members” is clearly detected, with an SNR of 15; this is source 15, also showing the strongest excess emission at 24 m, its 70 m magnitude is 2.76 mag. Gorlova et al. (2007) concluded that it may be an equal-mass binary late K dwarf (their source ID 9). For all other sources, upper limits from aperture photometry were obtained, but they do not constrain the spectral energy distributions of these sources and thus are not discussed further.
At 160 m, only the extended emission features are recognizable, otherwise none of the “highly probable members” are detected. Also here, upper limits derived from aperture photometry do not constrain the source SEDs.
4.3 Variability
The fact that the 24 m observations were carried out in three distinct epochs offers the possibility to study variability on timescales of months. Looking for large variability, PRF-fitting photometry was run separately on all ten maps. Then, by cross-correlation, for every source the number of detections in these ten maps was determined. As a (rather crude) measure of variability, the standard deviation of the set of photometry measurements was calculated for every source.
At a 3 detection level, 38 highly probable members are detected in all ten 24 m maps. As a measure of variability, we determine for every source the ratio of the maximum (presumed) variability amplitude divided by the noise level. When merging the photometry into one value for each epoch, only four out of 38 sources have a variability exceeding the respective 5 level, and only two sources exceed 7. These are 2MASS J08101546-4905487, one of the brightest sources in the field, varying by 19%, and 2MASS J08085649-4923128, varying by 24%; both sources are not among the excess sources discussed above.
5 Discussion
There are three different possibilities for the interpretation of the observed excess emission (e.g., Strubbe & Chiang, 2006). It could be due to remnant primordial material, due to a debris disk with continuously replenished dust, or it could be debris produced by a recent catastrophic collision of planetesimals, i.e., debris not in (quasi-) equilibrium. The dust in debris disks is produced and replenished by collisions, and then removed by processes such as the Poynting-Robertson (PR) drag, radiation pressure and stellar winds. Direct radiation pressure does not play a role for the low-luminosity stars that we consider (Plavchan et al., 2005). The balance of dust production and these removal processes determines the amount of observable dust.
In order to discuss the physical processes, we first need to determine which region around a central star is probed by the 24 m (excess) emission. As an estimate, we consider for a given stellar luminosity the orbital radius of a blackbody which is at a temperature that puts the peak of its SED at 24 m. For a dwarf star with a luminosity of =0.01 , the corresponding radius is only 0.5 AU.
With the orbital radius of the dust particles constrained, we can now determine the lifetime of dust particles under the influence of the PR drag, which should yield an upper limit of the dust removal timescale (e.g., Dominik & Decin, 2003). The PR lifetime of a dust particle in orbit around a central star scales with particle size and density as well as the square of its orbital radius and is inversely proportional to the luminosity of the central star (Burns et al., 1979). For micron-sized particles with a density of g cm-3 (Divine, 1993; Chen & Jura, 2001) located at a distance of 1 AU from a central star with a luminosity of , the lifetime is still on the order of years. This value is ten times longer for 10 m-sized particles. Since the M dwarfs discussed here have an age of 30–40 Myr, the particles would need to be replenished and thus cannot be primordial in order to still be observable at that age, indicating the debris disk nature of these systems and ruling out the first possibility mentioned in the beginning of this section. The lifetimes do not approach the cluster age until an orbital radius of 13 AU. Since other dust removal processes like stellar winds potentially operate at the same time, the derived timescale is in fact an upper limit.
This result thus suggests that at an age of 30–40 Myr, M dwarfs can have warm inner debris disks. Given that we know already seven M dwarfs that harbor extrasolar planets orbiting close to their host stars, this finding reinforces the idea that planets form around M stars. With M star debris disks more frequent than previously thought, chance occurrences like catastrophic collisions of big planetesimals may not have to be invoked for their explanation, ruling out the remaining third possibility.
It is interesting to note that a blackbody with a peak of its SED at 24 m has a temperature of 120 K, not far from the temperature of water sublimation, 153 K, defining the “snow line” (Hayashi, 1981), separating the inner region of rocky planet formation from the outer region of icy planet formation and playing a role in the definition of “habitable zones”. 111We can estimate a permissable range of dust temperatures for the dust we detect at 24 m. Comparing the ratio of an assumed 3 excess at 8 m and the observed 24 m excess with that expected for blackbody emission suggests an approximate upper limit of K for a typical source without an 8 m excess. As a strict lower limit, we note that the M-dwarf debris disk around AU Mic which does not exhibit 24 m excess emission has a dust temperature of K (Riaz et al., 2006). For M stars, the habitable zone lies at orbital radius of about 0.1 AU (Scalo et al., 2007). Indeed, seven M dwarfs are now known to harbor one or several extrasolar planets at orbital radii of 0.02 to 2.3 AU (most recently Endl et al., 2008, see references therein), with masses spanning 0.016–2.1 . The five planets with the smallest semi-major axes ( AU) have masses of . During the early evolution of an M dwarf, the snow line moves inwards due to the decreasing luminosity of the central star, enabling the formation of icy protoplanets within the first 1 Myr at orbital radii of 1–4 AU, not taking into account subsequent migration (Kennedy et al., 2007). The snow lines of M dwarfs in NGC 2547 have already moved further in when compared to their initial location, so that rocky protoplanets may have previously formed at orbital radii larger than the current snow line.
Given that some of the few previously known M dwarf debris disks have been found at submillimeter wavelengths, it is important to keep in mind that material traced in the far infrared is quite different from material traced in the submillimeter radio range. The latter corresponds to material at temperatures of K at orbital radii of several hundred AU (e.g., Lestrade et al., 2006). Thus, different regions are probed by far-infrared and submillimeter observations and they cannot be directly compared.
We show the photometric spectral energy distributions of the five M dwarfs with the strongest excess emission at 24 m in Fig. 8. Their 24 m emission is about an order of magnitude stronger than the expected photospheric flux. To obtain approximate physical properties from the crudely constrained photometric SEDs, we performed fits using disk models by Robitaille et al. (2007). For one of our best-constrained disks, source 23, the fits suggest that slightly more than 1% of the total luminosity is due to the disk, even though the central object is a star with a luminosity of only . To within an order of magnitude, the resulting dust disk masses are , corresponding to only a few percent of one lunar mass, but in some cases are barely constrained. As a major source of uncertainty, these mass estimates scale with the assumed dust properties which would be much better constrained with (sub-) millimeter data. For all but the densest regions of the disk, the model assumes small dust particles slightly larger than those in the diffuse ISM, and therefore, the mass estimates are a lower limit. Reviewing the submillimeter detections of M dwarf debris disks, Lestrade et al. (2006) quote masses of one to 13 lunar masses for three debris disks in the M0 range. In marked contrast, Chen et al. (2005) use Spitzer-MIPS data to derive a minimum dust mass for the debris disk of AU Mic of only 10-4 lunar masses, assuming a particle size of 0.2 m. This mass difference may indicate that submillimeter and far-infrared–detected debris disks are indeed quite different. However, a comparison of both methods towards the same objects would be needed to confirm this conjecture.
All of the M dwarf members of NGC 2547 can be assumed to be of the cluster age, 30–40 Myr, possibly indicating that at this age, the evolutionary stage of M dwarfs makes it easier to detect such debris disks. For debris disks around stars of earlier spectral types, there have already been several studies concerning age trends. In a study of main-sequence A stars older than 20 Myr, Rieke et al. (2005) find that the magnitude of excess at 24 m declines with a dependence, with Myr. Studying the double cluster h and Persei in context with this result and other observations, Currie et al. (2008) conclude that the debris disk excess emission of A stars peaks at about the age of this cluster, 13 Myr. On longer timescales, the evolution is less clear. While Trilling et al. (2008) did not find a clear age trend studying FIR excess emission of solar-type field stars with ages ranging from 200 Myr to 10 Gyr, Meyer et al. (2008), also studying solar-type stars, found an excess rate decreasing from 18% at ages 3–30 Myr to 2% at ages 0.3–3 Gyr. Hillenbrand et al. (2008) find that the 70 m excess emission of 328 FGK stars, tracing cooler dust compared to 24 m, peaks at ages of 30–100 Myr.
For a solar-mass star, the debris for rocky planet formation peaks after a few million years for material at 1 AU (Kenyon & Bromley, 2004, 2005). To scale this result for an M dwarf, we can use a simple relation for the disk mass, , and the collision timescale, (Kenyon & Bromley, 2008). So, if the M dwarf is three times less massive than the Sun, we would expect planet formation to take about five times longer around an M dwarf, i.e., 10–20 Myr, not taking into account minor complications due to the moving snow line. This indicates that the M dwarfs in NGC 2547 are beyond but still close to the maximum predicted debris production. Especially with regard to stars of earlier spectral types, it is important to keep in mind that this argument only allows to compare the evolutionary timescale of debris at an orbital radius of 1 AU. For A stars, the radius probed by 24 m observations is beyond 20 AU, and the timescales at these radii may be very different.
Currently, the early debris-disk evolution of M dwarfs is poorly constrained from an observational point of view. Weinberger et al. (2004) did not find significant mid-infrared excess (12 and 18 m) towards 16 members of the young, nearby TW Hydrae association and conclude that apparently any planet formation in the terrestrial planet region was rapidly completed. In a study targeting stars at age similar to the age of NGC 2547, Mamajek et al. (2004) observed members of the 30-Myr-old Tucana-Horologium Association, including two M dwarfs, at a wavelength of 10 m (N band). They do not find excess emission towards the two M dwarfs, and their quoted uncertainties would allow excess emission at only 10% of the expected photospheric flux level. Looking at our SEDs in Fig. 8, if the excess emission is modeled correctly, it would be far more difficult to detect at 10m. The M dwarfs studied by Plavchan et al. (2005), and not found to exhibit excess emission at 11.7 m, include one young source and nine more objects with ages of 600 Myr. The single young star is GJ 3305, a member of the Pic moving group at an age of 12 Myr. Gautier et al. (2007) found that field M dwarfs older than 1 Gyr do not show far-infrared excess emission. Due to the nearby location of these sources ( pc), the absolute sensitivity of these observations is much higher than that of our dataset. This upper limit for the evolutionary timescale of M dwarf debris disks indicates that planet formation around M dwarfs has ceased by this time.
We finally consider the excess fractions of stars with earlier spectral types. While Gorlova et al. (2007), restricting the discussion to their completeness limit, found 30 – 45% of the B–F members to show excess emission at 24 m, we interestingly find virtually no G star excess emission at this wavelength. As pointed out above, while we find excess emission towards K stars, we may not be complete throughout their R-K range, and many of the “highly probable” K members may be background giants. Even so, the 24 m excess rate for both G and K stars, using our conservative criterion for excess sources, is at most a few percent. In the most comprehensive sample of field stars to date, Trilling et al. (2008) find statistically indistinguishable excess rates for A, F, G, and K stars, with an average age of the solar-type sample of 5 Gyr. The fact that we do not find excess emission towards G stars can possibly be understood using an argument similar to the one used in our discussion of M dwarf debris disks: given the cluster age, the solar-type stars are far beyond their peak in dust production. In marked contrast, the excess rate for M dwarfs is surprisingly high, even though it is a lower limit for two different reasons: first, our 24 m detections of M dwarfs are not complete and second, we use a conservative criterion to define excess sources. It remains unclear, however, to what degree the excess rates of G, K, and M stars are skewed due to contamination by non-members.
6 Summary
In an exceptionally deep 24 m observation of NGC 2547, we detect eleven M dwarf excess sources interpreted as debris disks, nine of which are new. These constitute more than 42% of all significant excess sources that we find across the range from B to M stars. The eight M dwarf excess sources that were covered by IRAC observations do not show significant excess in these mid-infrared bands (except for source 23, see Gorlova et al., 2007). The dust masses of these disks are crudely estimated to be on the order of a few percent of a lunar mass. The identification as debris disks hinges on the observation that the dust removal timescale due to processes like PR drag and stellar winds is much smaller than the age of the cluster. Thus, there must be a mechanism to replenish the dust particle population, e.g., by collisions. Given the cluster age, the observed M dwarfs appear to be close to, maybe beyond their maximum predicted debris production. Interestingly, the observed debris material is located close to the snow line and the habitable zone, at less than 1 AU from the central stars. Since even our deep dataset is not complete for M dwarfs, we cannot give a debris disk fraction in terms of the total population, but it appears to be higher than for G and K stars at the same age. In fact, we find a minimum in excess emission in the G stars, suggesting that their maximum debris production occurs much earlier than at 30–40 Myr.
With these new discoveries, the number of known M star debris disks more than doubles by rising from six to fifteen. The previously perceived “dearth” of M dwarf debris disks apparently was due to small sample sizes both in numbers of objects studied and in different ages probed. To better constrain the debris-disk evolution and planet formation timescales of M dwarfs, larger samples of objects at ages both younger and older than NGC 2547 are needed.
References
- Andrews & Williams (2005) Andrews, S. M. & Williams, J. P. 2005, ApJ, 631, 1134
- Bessell (1991) Bessell, M. S. 1991, AJ, 101, 662
- Bessell & Brett (1988) Bessell, M. S. & Brett, J. M. 1988, PASP, 100, 1134
- Burns et al. (1979) Burns, J. A., Lamy, P. L., & Soter, S. 1979, Icarus, 40, 1
- Chen & Jura (2001) Chen, C. H. & Jura, M. 2001, ApJ, 560, L171
- Chen et al. (2005) Chen, C. H., Patten, B. M., Werner, M. W., et al. 2005, ApJ, 634, 1372
- Clariá (1982) Clariá, J. J. 1982, A&AS, 47, 323
- Currie et al. (2008) Currie, T., Kenyon, S. J., Balog, Z., et al. 2008, ApJ, 672, 558
- Divine (1993) Divine, N. 1993, J. Geophys. Res., 98, 17029
- Dominik & Decin (2003) Dominik, C. & Decin, G. 2003, ApJ, 598, 626
- Endl et al. (2008) Endl, M., Cochran, W. D., Wittenmyer, R. A., & Boss, A. P. 2008, ApJ, 673, 1165
- Gautier et al. (2007) Gautier, III, T. N., Rieke, G. H., Stansberry, J., et al. 2007, ApJ, 667, 527
- Gorlova et al. (2007) Gorlova, N., Balog, Z., Rieke, G. H., et al. 2007, ApJ, 670, 516
- Gorlova et al. (2006) Gorlova, N., Rieke, G. H., Muzerolle, J., et al. 2006, ApJ, 649, 1028
- Hauschildt et al. (1999a) Hauschildt, P. H., Allard, F., & Baron, E. 1999a, ApJ, 512, 377
- Hauschildt et al. (1999b) Hauschildt, P. H., Allard, F., Ferguson, J., Baron, E., & Alexander, D. R. 1999b, ApJ, 525, 871
- Hayashi (1981) Hayashi, C. 1981, Progress of Theoretical Physics Supplement, 70, 35
- Hillenbrand et al. (2008) Hillenbrand, L. A., Carpenter, J. M., Kim, J. S., et al. 2008, ApJ, 677, 630
- Irwin et al. (2008) Irwin, J., Hodgkin, S., Aigrain, S., et al. 2008, MNRAS, 383, 1588
- Jeffries et al. (2006) Jeffries, R. D., Evans, P. A., Pye, J. P., & Briggs, K. R. 2006, MNRAS, 367, 781
- Jeffries et al. (2004) Jeffries, R. D., Naylor, T., Devey, C. R., & Totten, E. J. 2004, MNRAS, 351, 1401
- Jeffries & Oliveira (2005) Jeffries, R. D. & Oliveira, J. M. 2005, MNRAS, 358, 13
- Jeffries et al. (2003) Jeffries, R. D., Oliveira, J. M., Barrado y Navascués, D., & Stauffer, J. R. 2003, MNRAS, 343, 1271
- Kalas et al. (2004) Kalas, P., Liu, M. C., & Matthews, B. C. 2004, Science, 303, 1990
- Kennedy et al. (2007) Kennedy, G. M., Kenyon, S. J., & Bromley, B. C. 2007, Ap&SS, 311, 9
- Kenyon & Bromley (2004) Kenyon, S. J. & Bromley, B. C. 2004, ApJ, 602, L133
- Kenyon & Bromley (2005) Kenyon, S. J. & Bromley, B. C. 2005, AJ, 130, 269
- Kenyon & Bromley (2008) Kenyon, S. J. & Bromley, B. C. 2008, ApJ, submitted
- Kenyon & Hartmann (1995) Kenyon, S. J. & Hartmann, L. 1995, ApJS, 101, 117
- Lada (2006) Lada, C. J. 2006, ApJ, 640, L63
- Lada et al. (2006) Lada, C. J., Muench, A. A., Luhman, K. L., et al. 2006, AJ, 131, 1574
- Lestrade et al. (2006) Lestrade, J.-F., Wyatt, M. C., Bertoldi, F., Dent, W. R. F., & Menten, K. M. 2006, A&A, 460, 733
- Liu (2004) Liu, M. C. 2004, Science, 305, 1442
- Liu et al. (2004) Liu, M. C., Matthews, B. C., Williams, J. P., & Kalas, P. G. 2004, ApJ, 608, 526
- Low et al. (2005) Low, F. J., Smith, P. S., Werner, M., et al. 2005, ApJ, 631, 1170
- Lyra et al. (2006) Lyra, W., Moitinho, A., van der Bliek, N. S., & Alves, J. 2006, A&A, 453, 101
- Makovoz & Marleau (2005) Makovoz, D. & Marleau, F. R. 2005, PASP, 117, 1113
- Mamajek et al. (2004) Mamajek, E. E., Meyer, M. R., Hinz, P. M., et al. 2004, ApJ, 612, 496
- Mathioudakis & Doyle (1991) Mathioudakis, M. & Doyle, J. G. 1991, A&A, 244, 433
- Matthews et al. (2007) Matthews, B. C., Kalas, P. G., & Wyatt, M. C. 2007, ApJ, 663, 1103
- Meyer et al. (2007) Meyer, M. R., Backman, D. E., Weinberger, A. J., & Wyatt, M. C. 2007, in Protostars and Planets V, ed. B. Reipurth, D. Jewitt, & K. Keil, 573–588
- Meyer et al. (2008) Meyer, M. R., Carpenter, J. M., Mamajek, E. E., et al. 2008, ApJ, 673, L181
- Monet et al. (2003) Monet, D. G., Levine, S. E., Canzian, B., et al. 2003, AJ, 125, 984
- Moro-Martin et al. (2008) Moro-Martin, A., Wyatt, M. C., Malhotra, R., & Trilling, D. E. 2008, in The Solar System Beyond Neptune (Tucson: Univ of Arizona Press), ed. M. A. Barucci, H. Boehnhardt, D. P. Cruikshank, & A. Morbidelli, in press
- Mullan et al. (1989) Mullan, D. J., Stencel, R. E., & Backman, D. E. 1989, ApJ, 343, 400
- Muzerolle et al. (2006) Muzerolle, J., Adame, L., D’Alessio, P., et al. 2006, ApJ, 643, 1003
- Naylor & Jeffries (2006) Naylor, T. & Jeffries, R. D. 2006, MNRAS, 373, 1251
- Naylor et al. (2002) Naylor, T., Totten, E. J., Jeffries, R. D., et al. 2002, MNRAS, 335, 291
- Oliveira et al. (2003) Oliveira, J. M., Jeffries, R. D., Devey, C. R., et al. 2003, MNRAS, 342, 651
- Plavchan et al. (2005) Plavchan, P., Jura, M., & Lipscy, S. J. 2005, ApJ, 631, 1161
- Riaz et al. (2006) Riaz, B., Mullan, D. J., & Gizis, J. E. 2006, ApJ, 650, 1133
- Rieke et al. (2005) Rieke, G. H., Su, K. Y. L., Stansberry, J. A., et al. 2005, ApJ, 620, 1010
- Rieke et al. (2004) Rieke, G. H., Young, E. T., Engelbracht, C. W., et al. 2004, ApJS, 154, 25
- Robichon et al. (1999) Robichon, N., Arenou, F., Mermilliod, J.-C., & Turon, C. 1999, A&A, 345, 471
- Robitaille et al. (2007) Robitaille, T. P., Whitney, B. A., Indebetouw, R., & Wood, K. 2007, ApJS, 169, 328
- Scalo et al. (2007) Scalo, J., Kaltenegger, L., Segura, A. G., et al. 2007, Astrobiology, 7, 85
- Song et al. (2002) Song, I., Weinberger, A. J., Becklin, E. E., Zuckerman, B., & Chen, C. 2002, AJ, 124, 514
- Strubbe & Chiang (2006) Strubbe, L. E. & Chiang, E. I. 2006, ApJ, 648, 652
- Trilling et al. (2008) Trilling, D. E., Bryden, G., Beichman, C. A., et al. 2008, ApJ, 674, 1086
- Tsikoudi (1988) Tsikoudi, V. 1988, AJ, 95, 1797
- Weinberger et al. (2004) Weinberger, A. J., Becklin, E. E., Zuckerman, B., & Song, I. 2004, AJ, 127, 2246
- Winkler (1997) Winkler, H. 1997, MNRAS, 287, 481
- Young et al. (2004) Young, E. T., Lada, C. J., Teixeira, P., et al. 2004, ApJS, 154, 428