Near-Infrared Photometry of the Type IIn SN 2005ip:
The Case for Dust Condensation
Abstract
Near-infrared photometric observations of the Type IIn SN 2005ip in NGC 2906 reveal large fluxes (1.3 mJy) in the -band over more than 900 days. While warm dust can explain the late-time -band emission of SN 2005ip, the nature of the dust heating source is ambiguous. Shock heating of pre-existing dust by post-shocked gas is unlikely because the forward shock is moving too slowly to have traversed the expected dust-free cavity by the time observations first reveal the emission. While an infrared light echo model correctly predicts a near-infrared luminosity plateau, heating dust to the observed temperatures of 1400-1600 K at a relatively large distance from the supernova ( cm) requires an extraordinarily high early supernova luminosity ( L⊙). The evidence instead favors condensing dust in the cool, dense shell between the forward and reverse shocks. Both the initial dust temperature and the evolutionary trend towards lower temperatures are consistent with this scenario. We infer that radiation from the circumstellar interaction heats the dust. While this paper includes no spectroscopic confirmation, the photometry is comparable to other SNe that do show spectroscopic evidence for dust formation. Observations of dust formation in SNe are sparse, so these results provide a rare opportunity to consider SNe Type IIn as dust sources.
Subject headings:
circumstellar matter — supernovae: general — supernovae:individual: SN 2005ip — dust,extinction — infrared: stars1. Introduction
For nearly 40 years, core-collapse SN events have been considered as possible sources of dust in the universe (Cernuschi et al., 1967; Hoyle & Wickramasinghe, 1970). More recent studies have proposed that the core-collapse supernovae may be the primary sources of dust in the early universe (Todini & Ferrara, 2001; Nozawa et al., 2003; Dwek et al., 2007). Several models (Todini & Ferrara, 2001; Nozawa et al., 2003, 2008) succeed in producing the large amounts of dust observed at high redshifts, and recent data present the first evidence for a supernova origin for dust in an object at (Maiolino et al., 2004).
Nonetheless, direct observational evidence for dust formation in supernovae remains sparse, even in the local universe (Meikle et al., 2007, and references therein). Any newly formed dust would produce a late-time near-infrared excess in comparison to the blackbody optical spectrum. Merrill (1980) was the first to detect such an infrared excess from a supernova (SN 1979C). Since then, only a handful of near-infrared excesses associated with core-collapse events have been observed (e.g. Dwek & Arendt, 1992; Gerardy et al., 2002; Pozzo et al., 2004; Meikle et al., 2006; Smith et al., 2008, and references therein).
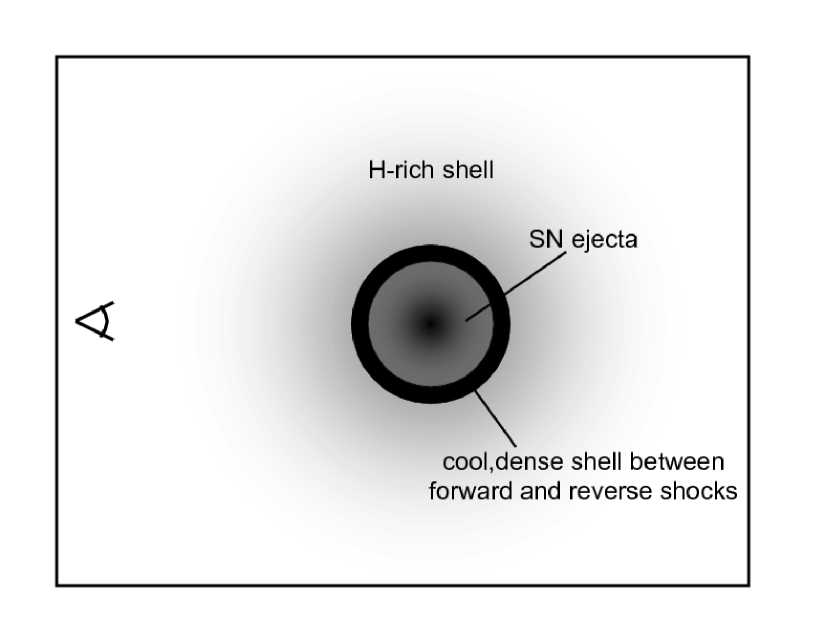
Late-time near-infrared emission, however, is not unique to dust formation. Several possible mechanisms may give rise to such an excess due to the complex nature of the surrounding environment of most core-collapse supernovae (see Figure 1). (1) As the ejecta expand and cool, dust condenses and is radiatively heated. (2) The hot gas behind the forward shock collisionally heats pre-existing circumstellar gas and dust. (3) The SN peak luminosity heats pre-existing dust and produces an “IR echo.” (4) Dust condenses in either the forward or reverse shocks and is heated by radiative shock emission.
The first scenario requires dust to condense from the ejecta as it expands and cools. The physical conditions in an expanding SN support this possibility. In particular, large abundances of the necessary elements, cooling of the ejecta via expansion, and dynamical instabilities can result in dust formation (Lucy et al., 1991; Dwek et al., 1992; Meikle et al., 1993; Roche et al., 1993). In this scenario the primary energy source is the radioactive power released in the expanding gas, which sets the luminosity of the dust. It is possible, however, for other energy sources to exist, such as circumstellar interactions.
The second scenario describes pre-existing circumstellar dust heated directly by shock interactions. The scenario is more likely to occur at later times. Assuming a spherically symmetric circumstellar distribution of dust, Dwek (1983) shows that a SN peak-luminosity of L⊙ creates a dust free cavity, via photo-evaporation, with a radius of cm (0.1 light years). For typical expansion velocities ( km s-1), this cavity delays the onset of emission by a couple of years. In addition, dust sputtering may limit the grain radiation efficiency so that only a small portion of the total shock power is converted into radiation (Draine, 1981).
In the third scenario, the energy from the SN peak-luminosity once again creates a dust free cavity. The remaining shell of dust warms to high temperatures but does not vaporize. Due to light travel time effects, the thermal radiation from the dust grains reaches the observer over an extended period of time (Dwek, 1983). The infrared luminosity plateau occurs on year long time scales, which are set by the light travel time across the inner edge of the cavity. An IR echo’s spectrum and temporal evolution are useful for estimating the mass-loss history of the progenitor star, and to investigate the geometry and composition of the circumstellar structure (Dwek, 1983, 1985; Emmering & Chevalier, 1988).
In the final scenario, the ejecta collide with the pre-existing circumstellar medium, which creates a forward shock. The circumstellar interaction decelerates the blast wave, thereby simultaneously creating a reverse shock. The deceleration converts some of the kinetic energy of the shock into X-rays and visible light. Dust grains are likely to condense in the cool, dense shell that forms behind the radiative shocks as they undergo a thermal instability (Pozzo et al., 2004). Typically, the post-shock conditions surrounding reverse shocks are more conducive to dust condensation as the chemically rich, dense ejecta pass through the shock front and cool.
The decelerated blast wave associated with the reverse shock is more likely to cool in sufficiently dense circumstellar environments. Type IIn events typically have the densest environments of any SNe, as they are defined by the “narrow” H lines that originate from clumps in the pre-existing dense H-rich shell that is moving at a relatively slow velocity (Schlegel, 1990). Therefore, one might suppose dust formation in the cool, dense shell behind the reverse shock to be associated with Type IIn events. Unfortunately, Type IIn events are rare, consisting of only 2-3% of all core-collapse SNe (Gal-Yam et al., 2007), and few well-studied events exist.
This paper presents an analysis of the observed late-time near-infrared emission in the Type IIn SN 2005ip from days 7-935 post-discovery. In §2, we present the observations, data reduction techniques, and photometry. In §3, we discuss the different possible dust heating mechanisms and compare the SN to SNe with similar characteristics. The observations suggest that either an IR echo or dust formation in the post-shocked gas explain the long lived IR excess, but that dust formation is more likely. §4 summarizes these results.
2. Observations
2.1. SN 2005ip
Supernova 2005ip was discovered in NGC 2906 on UT 2005 November 5 (Boles et al., 2005). NGC 2906 lies at a distance of 30 Mpc, given a host galaxy recession velocity of 2140 km s-1(de Vaucouleurs et al., 1991) and km s-1 Mpc-1 (Freedman et al., 2001). Early optical spectra suggested the discovery occurred a few weeks following the explosion (Modjaz et al., 2005). The presence of H in the spectrum led to the classification of the SN as a Type II event (Modjaz et al., 2005). Late spectra of SN 2005ip showed the development of a narrow H line that is characteristic of Type IIn supernovae (Smith et al., 2008, in prep). Various observers accumulated optical photometry of SN 2005ip over the first 100 days (Teamo 2007111http://www.astrosurf.com/snweb2/2005/05ip/05ipMeas.htm). The supernova was brightest, , at the time of the first observation. The fact that all data were obtained post-peak does not allow for the explosion date to be constrained. An unfiltered -band light curve beginning on day 10 post-discovery from Smith et al. (2008, in prep) shows a linear magnitude decline through day 150 post-discovery followed by luminosity plateau at that begins no later than day 300 and persists throughout the duration of our observations. Observations from Swift on day 461 reveal a magnitude and a keV X-ray luminosity of erg s-1 (Immler & Pooley, 2007).
2.2. Near-Infrared Photometry
Our observations of SN 2005ip consist of -,-, and -band images spanning from 2005 December through 2008 June, days 7-935 following discovery. All observations were made with FanCam, a 1024 1024 HAWAII-I HgCdTe imaging system on the University of Virginia’s 31-inch telescope at Fan Mountain, just outside of Charlottesville, VA (Kanneganti et al., 2008, in prep). Each epoch consists of fifteen minutes of integration in bands, which have detection limits at the 10 level of 0.066, 0.098, and 0.156 mJy (or 18.5, 17.5, and 16.5 mag), respectively. Individual exposures are sky background limited and have an integration time of either 30 or 60 seconds. Flat-field frames are composed of dusk and dawn sky observations. We employed standard near-infrared data reduction techniques in IRAF. The relatively small galaxy size made it possible to fit it into a single array quadrant. Empty quadrants were efficiently utilized as sky exposures. Data were taken with the galaxy placed in each quadrant and each quadrant was reduced separately. Ultimately, all reduced quadrants were coadded. Figure 2a shows a typical reduced -band image.
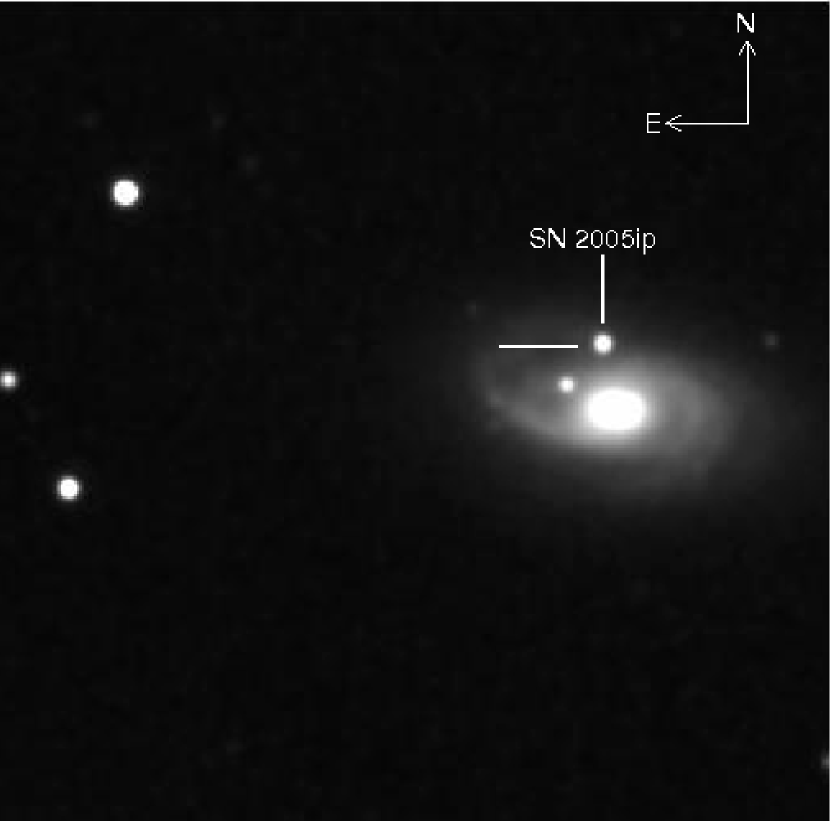
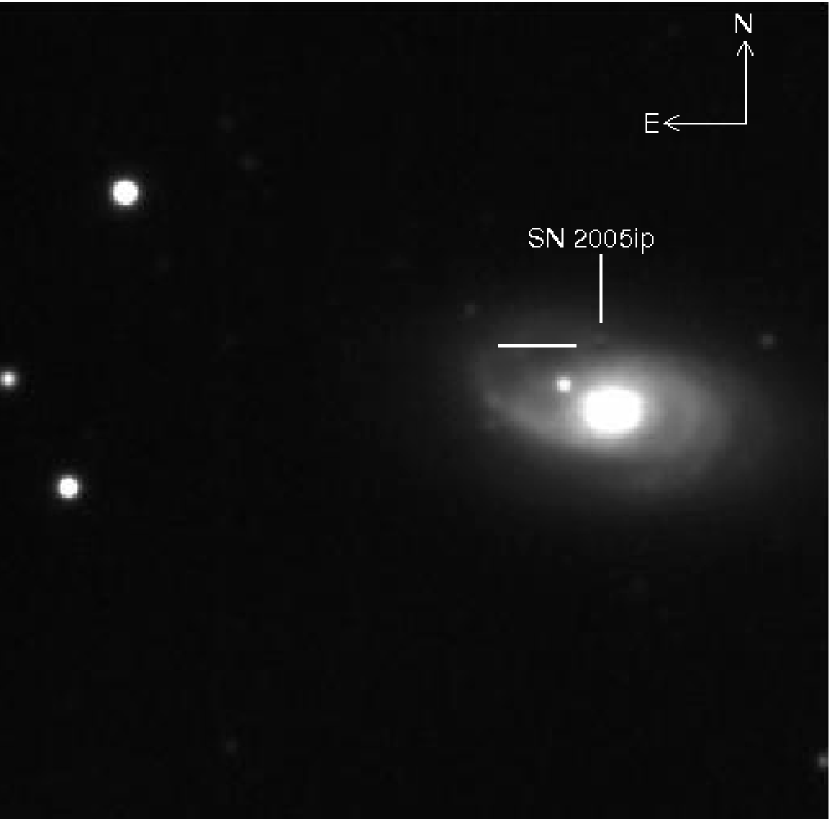
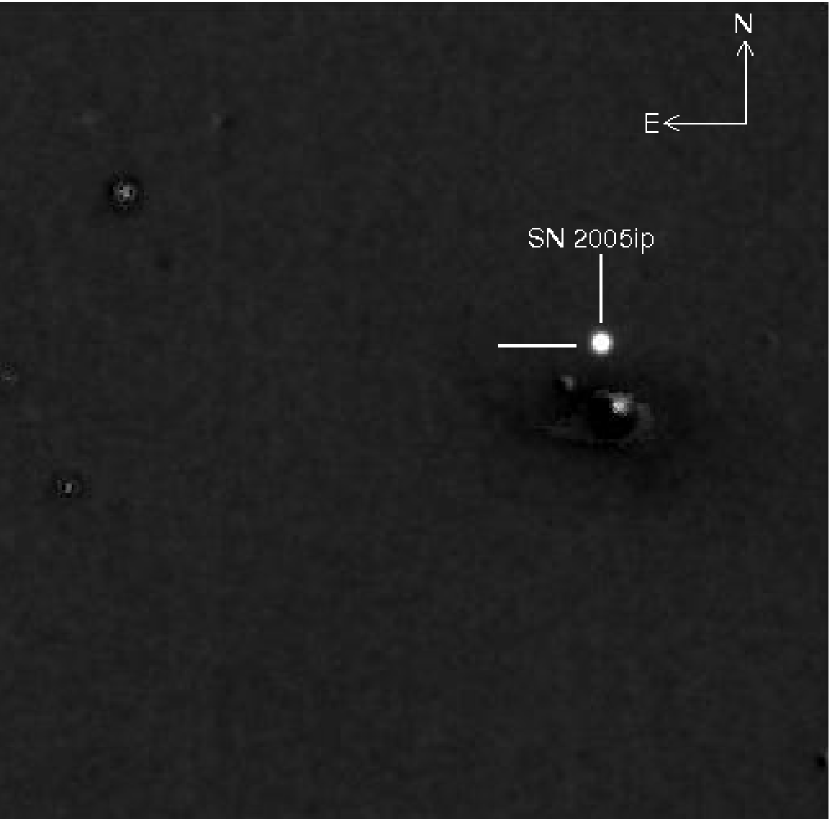
Template subtraction minimizes photometric confusion from the underlying galaxy. While there are no existing FanCam observations of the galaxy prior to SN 2005ip, IRAF’s DAOPHOT PSF and SUBSTAR packages provide the means to create and subtract an average PSF at the SN location for each epoch (Figure 2b). A coaddition of each epoch yields a master template that is deeper and smoother than any individual epoch. The subtraction of the template from each epoch leaves only the SN (Figure 2c). To ensure a clean subtraction, individual and template PSFs are scaled to match in shape and intensity using IRAF’s PSFMATCH package. We performed photometry with IRAF’s APPHOT package, implementing an 8-pixel radius aperture and a 3-pixel wide annulus with an 8-pixel inner radius. For magnitude calibration, the SN is compared to three 2MASS reference stars located in the eastern part of Figure 2.
| JD | Epoch | J | H | Ks | J | H | Ks |
|---|---|---|---|---|---|---|---|
| (2450000+) | (days) | (mag) | (mag) | (mag) | (mJy) | (mJy) | (mJy) |
| 3686.5 | 7.0 | 14.42(0.01) | - | 13.87(0.01) | 2.84(0.03) | - | 1.75(0.02) |
| 3688.0 | 8.0 | 14.41(0.01) | - | 13.93(0.02) | 2.88(0.03) | - | 1.66(0.03) |
| 3743.0 | 63.0 | 15.42(0.03) | 14.91(0.05) | 14.12(0.03) | 1.14(0.03) | 1.07(0.05) | 1.39(0.03) |
| 3763.1 | 83.0 | 15.51(0.03) | 14.71(0.03) | 13.82(0.02) | 1.04(0.03) | 1.28(0.04) | 1.83(0.03) |
| 3773.0 | 93.0 | 15.59(0.03) | 14.66(0.03) | 13.75(0.01) | 0.97(0.02) | 1.34(0.04) | 1.96(0.03) |
| 3799.5 | 120.0 | 15.84(0.03) | 14.66(0.03) | 13.67(0.01) | 0.77(0.02) | 1.34(0.04) | 2.11(0.03) |
| 3830.7 | 151.0 | 16.08(0.04) | 14.77(0.03) | 13.72(0.01) | 0.62(0.02) | 1.21(0.04) | 2.01(0.03) |
| 3850.5 | 171.0 | 16.21(0.05) | 14.81(0.04) | 13.75(0.02) | 0.54(0.02) | 1.16(0.04) | 1.97(0.04) |
| 3865.5 | 186.0 | 15.96(0.04) | 14.75(0.04) | 13.67(0.01) | 0.69(0.02) | 1.23(0.04) | 2.12(0.03) |
| 3879.5 | 200.0 | 16.05(0.05) | 14.78(0.04) | 13.67(0.02) | 0.63(0.03) | 1.20(0.04) | 2.10(0.03) |
| 4030.9 | 351.0 | 16.25(0.05) | - | 13.75(0.01) | 0.53(0.02) | - | 1.96(0.03) |
| 4112.0 | 432.0 | 16.49(0.06) | 15.20(0.05) | 13.87(0.01) | 0.42(0.02) | 0.82(0.04) | 1.75(0.02) |
| 4159.8 | 480.0 | 16.60(0.07) | 15.15(0.05) | 13.89(0.02) | 0.38(0.02) | 0.85(0.04) | 1.73(0.03) |
| 4227.6 | 548.0 | 16.66(0.08) | 15.23(0.06) | 13.96(0.02) | 0.36(0.03) | 0.79(0.04) | 1.62(0.03) |
| 4367.9 | 688.0 | 16.76(0.08) | 15.48(0.07) | 13.92(0.02) | 0.33(0.02) | 0.63(0.04) | 1.68(0.03) |
| 4406.8 | 722.0 | 16.85(0.09) | 15.52(0.07) | 14.03(0.02) | 0.30(0.03) | 0.61(0.04) | 1.52(0.03) |
| 4452.9 | 767.0 | 16.94(0.11) | 15.67(0.08) | 14.07(0.02) | 0.28(0.03) | 0.53(0.04) | 1.46(0.02) |
| 4516.8 | 831.0 | - | 15.87(0.11) | 14.14(0.03) | - | 0.44(0.05) | 1.37(0.04) |
| 4537.6 | 852.0 | 17.03(0.10) | 15.80(0.09) | 14.10(0.02) | 0.26(0.02) | 0.47(0.04) | 1.42(0.03) |
| 4580.6 | 895.0 | 17.01(0.10) | 15.83(0.09) | 14.12(0.02) | 0.26(0.02) | 0.45(0.04) | 1.40(0.02) |
| 4620.6 | 935.0 | 17.17(0.12) | 16.14(0.15) | 14.18(0.05) | 0.23(0.03) | 0.34(0.05) | 1.32(0.06) |

| Epoch | J-H | J-Ks | H-Ks |
|---|---|---|---|
| (days) | (mag) | (mag) | (mag) |
| 7 | - | 0.55(0.02) | - |
| 8 | - | 0.48(0.02) | - |
| 63 | 0.51(0.06) | 1.30(0.04) | 0.78(0.06) |
| 83 | 0.81(0.04) | 1.69(0.03) | 0.89(0.04) |
| 93 | 0.93(0.04) | 1.85(0.03) | 0.92(0.03) |
| 120 | 1.18(0.05) | 2.17(0.04) | 0.99(0.03) |
| 151 | 1.31(0.06) | 2.36(0.05) | 1.05(0.04) |
| 171 | 1.40(0.06) | 2.47(0.05) | 1.07(0.04) |
| 186 | 1.21(0.05) | 2.30(0.04) | 1.09(0.04) |
| 200 | 1.27(0.06) | 2.38(0.05) | 1.11(0.04) |
| 351 | - | 2.50(0.05) | - |
| 432 | 1.29(0.08) | 2.62(0.06) | 1.33(0.05) |
| 480 | 1.45(0.08) | 2.72(0.07) | 1.27(0.05) |
| 548 | 1.43(0.09) | 2.70(0.08) | 1.27(0.06) |
| 688 | 1.29(0.11) | 2.85(0.08) | 1.56(0.07) |
| 722 | 1.35(0.11) | 2.84(0.09) | 1.49(0.07) |
| 767 | 1.29(0.13) | 2.89(0.11) | 1.60(0.08) |
| 831 | -15.87(0.11) | -14.14(0.03) | 1.73(0.12) |
| 852 | 1.24(0.14) | 2.94(0.10) | 1.70(0.09) |
| 895 | 1.18(0.13) | 2.90(0.10) | 1.72(0.09) |
| 935 | 1.04(0.19) | 2.99(0.13) | 1.95(0.16) |
This template subtraction method yields results similar to, but less noisy than, other techniques, such as aperture photometry and PSF photometry without template subtraction. Table 1 lists the photometry and Figure 3 plots the light curve. The -band magnitude remains fairly constant at 14.2 mag (a flux of 1.3 mJy) for the duration of the observations, even as the -band declines. A notable ‘kink’ occurs at day 200, although we do not speculate on the cause in this paper. Table 2 lists the near-infrared color evolution. Figure 4 shows the color to quickly redden between 50 and 200 days. This trend becomes more gradual and continues throughout the last observation epoch.
3. Analysis and Discussion
3.1. Temperature and Luminosity Evolution
Figure 5 shows the near-infrared fluxes. Matching the colors to the Planck function, presuming a dust emission/absorption efficiency, , establishes a near-infrared dust temperature. The flux of a single dust particle of radius at a temperature and wavelength is given by
| (1) |
where is the Planck function. The emission/absorption efficiency is given as
| (2) | |||
| (3) |
where is an integer. For large grain sizes (e.g. µm), because the dust acts as a blackbody. For smaller grains (i.e. ), . We consider the cases =0, 1, and 2 to account for both large grains that are associated with condensing dust (Pozzo et al., 2004) and smaller grains that are associated with pre-existing, optically thin dust, which is characterized by and emission/absorption efficiencies (Dwek et al., 1983).

Figure 5 plots the corresponding Planck curves over the original fluxes. The fits exclude the -band fluxes because of SN photospheric flux and line emission contamination, especially at early times when the photospheric temperature is 10,000 K. At these early times, the -band flux may also contain some contribution from the SN photosphere. By later times, however, we presume the photosphere has faded sufficiently so that the warm dust dominates the flux. With only 2 data points for each epoch there is no clear ‘best’ fit, so it is necessary to consider all cases.
Overall, the Planck peaks trend towards longer wavelengths/cooler temperatures. Table 3 lists the color temperatures for each emission/absorption efficiency at each epoch. Figure 6a plots the color temperature evolution. In all cases, the fading SN photosphere contributes to the dramatic temperature decline over the first 150 days. Although the exact point at which the dust temperature begins to dominate is unknown, we presume the photospheric component to decline sufficiently below the dust temperature after 150 days, at which point the temperature begins a slow, steady decline. While the chosen efficiency can alter the derived dust temperatures at early times by a few hundred Kelvin, these temperatures are less than or equal to the dust vaporization temperature ( K). Over the next 2 years, the temperatures drop to 1000 K. Considering the observations are made at near-infrared wavelengths, they probe the warmest and most luminous grains. Cooler dust may also be present, but its emission peaks at wavelengths longer than those observed here.
In contrast to the decreasing dust temperature, the dust luminosity plateaus early on and does not decline throughout the extent of the observations. Assuming a distance of 30 Mpc, integrating the Planck curves over all wavelengths yields a lower limit to the bolometric dust luminosity, shown in Figure 6b and listed in Table 3. Again, this calculation does not account for cooler dust that could contribute at longer wavelengths. Throughout the entire set of observations, the dust luminosity remains at erg s-1.
| Epoch | Tbb | T | T | Lbb | L | L | Lradioactive |
|---|---|---|---|---|---|---|---|
| (d) | (K) | (K) | (K) | ||||
| 7 | - | - | - | - | - | - | 42.09 |
| 8 | - | - | - | - | - | - | 42.09 |
| 63 | 1969(89) | 1547(56) | 1279(39) | 41.43(0.03) | 41.38(0.03) | 41.34(0.03) | 41.86 |
| 83 | 1809(47) | 1449(31) | 1213(22) | 41.53(0.01) | 41.48(0.02) | 41.43(0.02) | 41.80 |
| 93 | 1765(44) | 1422(29) | 1194(20) | 41.57(0.01) | 41.50(0.01) | 41.46(0.01) | 41.75 |
| 120 | 1667(38) | 1359(26) | 1149(18) | 41.59(0.01) | 41.53(0.01) | 41.49(0.01) | 41.64 |
| 151 | 1599(39) | 1314(27) | 1118(19) | 41.57(0.01) | 41.50(0.01) | 41.46(0.01) | 41.53 |
| 171 | 1582(45) | 1303(31) | 1110(22) | 41.56(0.02) | 41.50(0.02) | 41.46(0.02) | 41.45 |
| 186 | 1561(38) | 1289(26) | 1100(19) | 41.60(0.01) | 41.53(0.01) | 41.49(0.01) | 41.39 |
| 200 | 1538(38) | 1273(26) | 1088(19) | 41.59(0.01) | 41.53(0.01) | 41.49(0.02) | 41.34 |
| 351 | - | - | - | - | - | - | 40.75 |
| 432 | 1345(39) | 1140(28) | 990(21) | 41.53(0.02) | 41.48(0.02) | 41.42(0.02) | 40.43 |
| 480 | 1390(41) | 1172(29) | 1013(22) | 41.53(0.02) | 41.46(0.02) | 41.41(0.02) | 40.25 |
| 548 | 1386(48) | 1169(34) | 1012(26) | 41.50(0.02) | 41.43(0.02) | 41.38(0.02) | 39.98 |
| 688 | 1186(42) | 1024(31) | 902(24) | 41.59(0.02) | 41.50(0.02) | 41.43(0.02) | 39.43 |
| 722 | 1229(45) | 1056(34) | 926(26) | 41.52(0.02) | 41.43(0.02) | 41.38(0.02) | 39.31 |
| 767 | 1163(45) | 1007(33) | 888(26) | 41.53(0.02) | 41.45(0.02) | 41.39(0.02) | 39.14 |
| 831 | 1093(59) | 954(45) | 847(35) | 41.55(0.03) | 41.46(0.03) | 41.39(0.04) | 38.89 |
| 852 | 1108(48) | 966(36) | 856(28) | 41.56(0.03) | 41.46(0.03) | 41.39(0.03) | 38.82 |
| 895 | 1098(46) | 958(35) | 850(28) | 41.56(0.02) | 41.46(0.03) | 41.39(0.03) | 38.67 |
| 935 | 991(64) | 876(50) | 785(40) | 41.63(0.04) | 41.52(0.04) | 41.43(0.04) | 38.52 |
3.2. Comparison to Previous SNe
Comparing SN 2005ip photometry to prior, well-studied events can help expose the dust heating mechanism. We find three well-sampled SNe with similar bright near-infrared late-time emission: SN 1998S (Fassia et al., 2000; Pozzo et al., 2004), SN 1995N (Gerardy et al., 2002), and SN 2006jc (Sakon et al., 2007; Smith et al., 2008; Mattila et al., 2008; Nozawa et al., 2008; Di Carlo et al., 2008). The associated spectra of these SNe reveal further details about the surrounding environment and the nature of the infrared emission.
Type IIn SN 1998S is most comparable to SN 2005ip, with similar luminosities and temperatures, although a decline in the -band luminosity is observed as early as day 333 (Fassia et al., 2000; Pooley et al., 2002; Pozzo et al., 2004). Pozzo et al. (2004) conclude dust condensation in the cool, dense shell behind the reverse shock is responsible for the late-time luminosity. They do not consider the forward shock given the increased likelihood for dust condensation in the post-shocked ejecta. All observations are consistent with this scenario. The observed optical line profiles likely arise from the low-ionization gas in the cooling shock (Chevalier & Fransson, 1994). The coincidence of the line velocities with the velocity of the dust shell (derived from the estimated shell radius from a blackbody approximation versus the time since the explosion) suggests a physical relationship between the two. The condensing dust also explains the fading central and redshifted H peaks with respect to the blueshifted peak observed by Gerardy et al. (2002). Fassia et al. (2001) observe CO emission to develop at the same time the absorption is observed. Finally, the pure blackbody fits of the dust (=0) are more suggestive of dust condensing in optically thick lumps than pre-existing, optically thin dust.


Type IIn SN 1995N also shows comparable temperatures and luminosities to SN 2005ip (Fox et al., 2000; Gerardy et al., 2002; Pastorello et al., 2005). Similar to SN 2005ip, the luminosity plateau extends all the way through day , after which a decline was observed out to day 2413 (Gerardy et al., 2002). Gerardy et al. (2002) do not consider dust condensation, but instead suggest the dust is heated by either an IR echo or by the X-rays produced in direct circumstellar interaction heating of pre-existing dust. While the IR echo model adequately describes the photometric evolution, the implied dust cavity radius, created via heating and vaporization by the peak SN luminosity, requires an unusually bright peak luminosity. Instead, the authors suggest an event prior to the core collapse could have cleared out the large dust cavity required in this instance. Alternatively, the authors’ circumstellar medium interaction model does not require such a large dust cavity. The pre-existing dust is heated by X-ray and UV emissions produced by the much more slowly evolving shock interactions with a dense circumstellar medium.
Interestingly, Gerardy et al. (2002) rule out direct collisional heating of pre-existing dust by the hot, post-shocked electrons. The authors argue dust temperatures of K require prohibitively high gas densities ( cm-3 for K). However, we find these densities are not required in this scenario. For = 0.1 µm silicate grains and a gas temperature K, Dwek et al. (2008) show in their figure 1 that for dust temperatures of 800 K, gas densities are only . These densities are not prohibitively high and are, in fact, close to what would be expected for typical progenitor mass loss rates ( M⊙ yr-1) and wind velocities () at radii of cm.
The authors also argue that collisional heating does not predict the observed drop in the infrared luminosity before its X-ray counterpart. We find, however, that the sputtering lifetime, , of the dust grains is short enough that there should not necessarily be a correlation between the infrared and X-ray luminosities. The sputtering lifetime at gas temperatures above 106 K given by (Dwek & Arendt, 1992) is
| (4) |
For the grain size ( = 0.1 µm) and gas densities () above, year, which is shorter than the observed light plateau in SN 1995N. In such a short period of time, infrared emission from collisionally heated dust will decrease as the larger dust grains are destroyed. These effects could explain the lack of correlation between the infrared and X-ray luminosities. Nonetheless, collisional heating is still unlikely in this case. Draine (1981) shows that collisionally heated grains radiate only of the shock power before the grains are sputtered, thereby limiting the contribution of infrared emission from collisionally heated dust.
SN 2006jc also shows an extended period of increased late-time infrared emission. Unlike the previous two examples, SN 2006jc is a Type Ib event with a dense circumstellar medium that is likely associated with a LBV-like outburst originating from the progenitor at -730 days (Yamaoka et al., 2006; Pastorello et al., 2007). Between days 51 and 75, the supernova undergoes a brightening at near-infrared wavelengths (Arkharov et al., 2006; Di Carlo et al., 2008). On day 75, Smith et al. (2008) measured a luminosity and temperature K. The temperature stayed constant for only 1 month and then cooled. Throughout this time period, X-rays indicate interaction of the supernova shock with the circumstellar shell created by the previous LBV outburst (Immler et al., 2008). The SN continued to remain bright at infrared wavelengths through day 493, which was the last observation epoch (Mattila et al., 2008; Di Carlo et al., 2008).


While warm dust is the widely accepted source of the late-time near-infrared emission, the origin of the dust is debated. Smith et al. (2008) argue the dust is newly formed based on (1) the development of a red/IR continuum consistent with the temperature of newly formed graphite grains or slightly hotter silicate grains, (2) the coincidental fading of the redshifted wings of the narrow He I emission lines, and (3) a simultaneous decline in the expected optical flux (Foley et al., 2007) and brightening in near-infrared. Sakon et al. (2007) and Nozawa et al. (2008) propose the dust condenses in the freely expanding ejecta. Both Smith et al. (2008) and Mattila et al. (2008) reject this scenario because it cannot explain the observed spectral line reddening. Instead, these authors favor dust condensation in the cool, dense shell created as the supernova shock interacts with the circumstellar medium. Smith et al. (2008) favor dust condensation in the reverse shock because of the observed carbon-rich features that are consistent with enriched ejecta encountering the reverse shock. In contrast, Mattila et al. (2008) conclude the reverse shock would not be radiative and, therefore, not conducive to dust formation. Instead, the authors argue for dust condensation in the cool, dense shell behind the forward shock.
In any case, the temperature remains constant for about one month at early times. Smith et al. (2008) argue that if there is a sufficient amount of circumstellar material, then grains will continue to form at the vaporization temperature. To produce the observed luminosity of erg s-1 by cooling through 1600 K, the particle condensation rate is given as , where is the thermal energy per particle. For dust grains, the thermal energy per particle is given as , where is the dust heat capacity (Draine & Li, 2001) and is 1600 if we assume the dust cools immediately and contributes only to the instantaneous luminosity. In this case, we calculate that the dust must condense on the order of 1000 M⊙ day-1. This unrealistic mass condensation rate indicates that there must be an additional heating source to power the observed infrared luminosity. Given the optical light curve, which is powered by radioactivity, quickly declines (Foley et al., 2007) at about the same time as Arkharov et al. (2006) observe near-infrared brightening suggests that the newly formed dust is absorbing the optical emission from the central supernova. In this case, the likely dust heating source is the photospheric emission from radioactivity. Mattila et al. (2008) similarly argue that the cooling of the newly formed grains is insufficient to account for the observed near-infrared luminosity and conclude a similar heating source for their dust condensation scenario.
3.3. The Source of the Infrared Excess in SN 2005ip
Warm dust surrounding SN 2005ip is the likely source of the near-infrared excess. As discussed in §1, there are several possible explanations for the large late-time -band luminosity: dust condensation in the ejecta, collisional heating in circumstellar medium shock interaction, an infrared echo, and dust condensation in the cool, dense shell behind either the forward or reverse shocks. This section briefly explores each possibility in order to distinguish between the different scenarios. SNe 1998S, 1995N, and 2006jc provide important points of reference.
3.3.1 Dust Condensation in the Unshocked Ejecta
Dust condensation may occur in the SN ejecta as it expands and cools. The available power in the expanding gas, primarily from radioactive decay, dictates the temperature and luminosity evolution of the grains. The decay of 56Co, with a half-life of 88 days, dominates the plausible radioactive power sources over the first hundreds of days. Other radioactive sources with longer half-lives become dominant at later times. Woosley et al. (1989) describe the details of radioactive energetics in supernovae. For SN 2005ip, the radioactive luminosity is larger than the observed dust luminosities at early times, but later falls well below the observed dust luminosity (Figure 6), for an assumed of 56Ni formed in the explosion. Furthermore, the observed dust luminosity varies slowly and does not match the radioactive decay rate of 56Co. While dust condensation may have occurred in the freely expanding ejecta of SN 2005ip, the available radioactive power cannot produce the observed dust grain luminosities at late times.
3.3.2 Collisional Heating
As the forward shock expands into the circumstellar medium, the hot post-shocked electrons may collisionally heat pre-existing dust grains produced by the progenitor wind. To heat the dust to the observed temperatures (T 1400-1600 K), figure 1 of Dwek et al. (2008) shows that the required gas densities are high, (), assuming post-shock gas temperatures on order of K. The sputtering effects for such high gas densities would significantly limit the contribution of infrared emission from collisionally heated dust throughout the duration of the observations.
A stronger argument against this scenario is the inconsistency in the time lag between the SN and the observed infrared emission. The SN peak luminosity vaporizes all dust grains within a radius that, for a dust emission/absorption efficiency , is proportional to the supernova’s peak luminosity (Dwek, 1983),
| (5) |
For a SN with a peak UV-optical bolometric luminosity of L⊙ with an exponential decline rate time-scale of 25 days (L⊙), Dwek (1983, 1985) shows cm (0.06 light years) for carbon-rich grains () and cm (0.31 light years) for oxygen-rich grains (). While the very early evolution of SN 2005ip is not well known, an early spectrum of SN 2005ip (Modjaz, private communication) and -band photometry (Smith et al., 2008, in prep) indicate an observed luminosity of L⊙ and an exponential time-scale of 35 days. Considering the supernova was not detected until a few weeks past maximum, the actual peak is most likely greater by a factor of a few, which is comparable to the supernova peak luminosity used by Dwek (1983) as described above.
The size of this dust cavity implies a time lag between the initial explosion and the onset of infrared emission equal to the shock propagation time across the dust free radius. Using the minimum of the H absorption line, Modjaz et al. (2005) measure the SN expansion velocity to be cm s-1 (0.05) at an early age. This speed refers to the photosphere and there is presumably higher velocity gas, but there is also likely to be deceleration resulting from the interaction. At this speed the shock must travel for 450 days before encountering the dust, assuming the dust cavity radius for carbon-rich grains given above, and 2300 days for the oxygen-rich grains. Figure 4, however, shows a considerably shorter time delay before a detectable infrared excess.
3.3.3 IR Echo
The IR echo model given by Dwek (1983) is tempting to explain SN 2005ip because it predicts an extended luminosity plateau, as observed in Figure 6b. Again, the fading photosphere is responsible for the large temperatures and rapidly evolving luminosity over the first 150 days in Figure 6b. Once the photosphere fades sufficiently, the dust temperature is 1400-1600 K. This temperature is approximately the dust vaporization temperature, which is consistent with the dust lying just beyond the cavity predicted by the IR echo model.
Assuming the IR echo scenario to be correct, the duration of the -band plateau (900 days) indicates the dust cavity radius must be light year ( cm). Given the relationship in equation (5), this radius would imply a peak luminosity L⊙. This luminosity is times larger than the estimate made in § 3.3.2. Assuming a fairly exponential decay (Smith et al., 2008, in prep), the total radiated energy from the supernova over the first few weeks is approximately ergs.
Given the infrared luminosity plateau in Figure 6b, the total radiated infrared energy through day 935 is approximately ergs. This energy is only a lower limit because little decline of the infrared flux has been observed. Furthermore, this luminosity does not account for cooler dust contributions. With the simplified assumption that these grains are emitting as blackbodies, the optical depth is approximated as , which, like the infrared energy, is also a lower limit. This optical depth is consistent with the ultraviolet/optical observations of the supernova, which do not indicate a large amount of reddening ( on day 461) (Immler & Pooley, 2007).
The optical depth gives a good estimate of the gas mass loss from the progenitor. The above optical depth corresponds to a visual extinction . Assuming dust properties comparable to the Milky Way’s interstellar medium, the column density is given as . Given the inner dust cavity radius derived above, cm, the total mass loss is then . Assuming a wind velocity of 10 km s-1, the mass loss rate is M⊙ yr-1, which agrees with measured values of typical SN winds.
Despite the consistency in the above arguments, the required luminosity for this scenario is remarkably high for a SN and is comparable to the most luminous events that have ever been observed (Quimby et al., 2007). Even if an eruption prior to the core collapse could have produced the large dust cavity, the same peak luminosity is required to warm the dust to the observed temperatures. Early time optical observations do not suggest that the SN was unusually bright at maximum (Teamo 2007, Smith et al., 2008, in prep). An IR echo, while able to adequately predict an extended luminosity plateau, is not the likely source of the late-time infrared emission in this case.
3.3.4 Dust Condensation in Post-Shocked Gas
A plausible source of warm dust in SN 2005ip is dust condensation in the shocked region that results from the collision of the ejecta with the pre-existing circumstellar medium. If the shocked gas is able to efficiently cool, the high pressure in the region results in gas densities cm-3 when the temperature drops to K. The shocked region is bounded by a forward shock in the circumstellar gas and a reverse shock in the supernova ejecta. Radiative cooling is more likely at the reverse shock because of the higher density, lower shock velocity, and the possibility of heavy element enrichment. Cooling at the forward shock is less likely, but the presence of clumps in the circumstellar medium, as indicated by the relatively narrow lines observed in SNe IIn, may allow radiative shocks.
While we cannot provide any direct spectroscopic evidence at this time to support dust condensation in a particular shock front, the available photometry is consistent with dust condensation in the shocked region. The observed dust temperatures and luminosities (both infrared and X-ray) are similar to SNe 1998S, 1995N, and 2006jc. Like SN 2005ip, these three supernovae have associated X-rays (Fox et al., 2000; Pooley et al., 2002; Immler et al., 2008), which are evidence for interaction of the supernova shock with the circumstellar gas. These results indicate that the source of the infrared emission is most likely associated with the shock interaction region. While SN 1995N was the only one of these supernovae not previously associated with dust condensation in the reverse shock, we consider the possibility below in §4.
The dust temperature () on day is also consistent with the condensation temperature of carbon-rich grains. Assuming the dust shell emits as a single, spherical blackbody (), a minimum radius of cm is consistent with the observed luminosity. This radius corresponds to a shock expansion velocity of , where the range is related to the grain composition. The upper part of this range is quite reasonable. Unlike the IR echo scenario, this picture is physically coherent and does not require an unreasonably high luminosity.
The dust equilibrium temperature is ultimately determined by a balance of heating and cooling. In this case, the dust heating mechanism is likely radiative shock emission. While the observed X-ray luminosity on day 466 is only erg s-1(Immler & Pooley, 2007), the corresponding optical luminosity is erg s-1, which is deduced from the magnitude at this time. This luminosity is comparable to the observed infrared luminosity (). The -band luminosity plateau (Smith et al., 2008, in prep) suggests that this visible component persists throughout the duration of our observations and, if absorbed by the newly formed dust, is a significant source of heat for the dust grains.
As the cool, dense shell expands, the radiation field from the shock emission becomes diluted and we expect the dust temperature to vary as . Assuming an expansion velocity of , by day the dust shell radius would have expanded by about a factor of 3 and the temperature would have dropped from K to K. Figure 6b shows a decreasing with time, although the decline appears to be slightly weaker than expected. This discrepancy is most likely related to the accuracy of our assumptions involving expansion velocity and grain composition.
4. Discussion and Conclusions
This paper presented near-infrared observations of SN 2005ip for the first 935 days following detection. A large -band luminosity persists even as the supernova’s -band luminosity falls. Among a variety of potential mechanisms, dust condensation in the cool, dense shell downstream from the reverse shock is the likely source of the observed infrared emission.
We are able to rule out other mechanisms for late-time near-infrared emission. While dust condensation in the supernova ejecta is a likely possibility, the duration of the observed near-infrared light curve is inconsistent with the quickly declining radioactive heating source. Shock/mechanical heating of pre-existing dust grains from prior mass loss is not possible because the near infrared excess appears quickly (100 days), providing insufficient time for the expanding ejecta to cross the dust-free cavity formed by the supernova. An IR echo successfully explains the fairly uniform luminosity over the period of observation. The duration of the infrared excess, however, implies a cavity size that requires a peak supernova luminosity that is much larger than observed for SN 2005ip and is comparable to the most luminous supernova ever observed.
On the other hand, there is mounting evidence to support dust condensation in the shock interaction region. SN 2005ip shares many properties with SNe 1998S and 2006jc, for which spectra reveal direct evidence of dust condensation in the reverse shock (Pozzo et al., 2004; Smith et al., 2008, in prep). While we currently have no such spectra for SN 2005ip, the observed infrared luminosities and temperatures are consistent with dust forming in shocked, cooled gas. The observed X-rays indicate the infrared emission is most likely associated with the shock interaction region. Furthermore, the initial dust temperature of K is consistent with the dust condensation temperature of carbon-rich grains, which we expect to find in the ejecta encountering the reverse shock. The temperature evolution is also somewhat consistent with the decline predicted by an expanding cool, dense shell and diluted radiation field. Unlike the IR echo, this scenario is physically plausible and a large initial luminosity is not required.
Of course, near-infrared photometry is only a small part of a much larger picture. Infrared spectra can better constrain the dust temperature, infrared flux, and emission/absorption efficiency than can be obtained with near-infrared photometry alone. Mid-infrared spectra also hold the prospects of revealing the mineralogy of the heated dust, distinguishing between carbon-rich (graphite) and oxygen-rich (silicate) grains. Based on the dust composition and mass loss history, the nature of the progenitor system may be deduced. Optical spectra are also of interest in that they can potentially reveal more evidence for dust formation and heating via circumstellar interaction (e.g. Fransson et al., 2002)
The overall similarity between SN 1995N and SN 2005ip suggests that SN 1995N be considered in the context of the dust condensation model, as opposed to the echo model favored by Gerardy et al. (2002). Indeed, Pastorello et al. (2005) show that the late-time optical and infrared luminosities of SN 1995N are comparable, which suggests a correlation between the ejecta/circumstellar medium interaction and the warm dust. The IR echo model also predicts a optical light echo from the scattered light, as well as an infrared echo produced by the absorption of the supernova peak luminosity (Chevalier, 1986). Yet detailed spectroscopic observations of SN 1995N suggest the late visible emission is due to circumstellar interaction and not an echo (Fransson et al., 2002). These spectra reveal evidence for absorption in the diminution of the red sides of emission lines compared to the blue sides, as would be expected with dust formation. Furthermore, the authors present evidence for an increased helium abundance, CNO-burning products, and Ly-pumped fluorescence of Fe II lines, all of which suggest a complex interaction between the ejecta and a pre-existing, dense circumstellar medium. The dust temperature of SN 1995N on day 730, K, is slightly smaller than for SN 2005ip. While this difference may be not be statistically significant, it is possible that SN 1995N had either a significantly higher expansion velocity or a different grain composition.
Our discussion of SN 1995N and the data for SN 2005ip indicate that Type IIn SNe may be sources of dust in our universe. This association would explain the consistent late-time infrared emission observed in several Type IIn events (e.g. Pastorello et al., 2002; Gerardy et al., 2002; Pozzo et al., 2004). The rarity of Type IIn events, which represent only 2-3% of all core-collapse SNe (Gal-Yam et al., 2007), makes collecting complete light curves difficult. Nonetheless, an interesting study would include follow-up observations of all Type IIn events over the past several years to determine which events are still bright in the infrared. We also reiterate the call by Gerardy et al. (2002) for simultaneous UV and X-Ray observations to better constrain and the amount of shock radiation being reprocessed by the dust grains.
References
- Arkharov et al. (2006) Arkharov, A., Efimova, N., Leoni, R., Paola, A. D., Carlo, E. D., & Dolci, M. 2006, The Astronomer’s Telegram, 961, 1
- Boles et al. (2005) Boles, T., Nakano, S., & Itagaki, K. 2005, Central Bureau Electronic Telegrams, 275, 1 (2005). Edited by Green, D. W. E., 275, 1
- Cernuschi et al. (1967) Cernuschi, F., Marsicano, F., & Codina, S. 1967, Annales d’Astrophysique, 30, 1039
- Chevalier (1986) Chevalier, R. A. 1986, ApJ, 308, 225
- Chevalier & Fransson (1994) Chevalier, R. A., & Fransson, C. 1994, ApJ, 420, 268
- de Vaucouleurs et al. (1991) de Vaucouleurs, G., de Vaucouleurs, A., Corwin, Jr., H. G., Buta, R. J., Paturel, G., & Fouque, P. 1991, Third Reference Catalogue of Bright Galaxies (Volume 1-3, XII, 2069 pp. 7 figs.. Springer-Verlag Berlin Heidelberg New York)
- Di Carlo et al. (2008) Di Carlo, E., Corsi, C., Arkharov, A. A., Massi, F., Larionov, V. M., Efimova, N. V., Dolci, M., Napoleone, N., & Di Paola, A. 2008, ApJ, 684, 471
- Draine (1981) Draine, B. T. 1981, ApJ, 245, 880
- Draine & Li (2001) Draine, B. T., & Li, A. 2001, ApJ, 551, 807
- Dwek (1983) Dwek, E. 1983, ApJ, 274, 175
- Dwek (1985) —. 1985, ApJ, 297, 719
- Dwek et al. (1983) Dwek, E., A’Hearn, M. F., Becklin, E. E., Brown, R. H., Capps, R. W., Dinerstein, H. L., Gatley, I., Morrison, D., Telesco, C. M., Tokunaga, A. T., Werner, M. W., & Wynn-Williams, C. G. 1983, ApJ, 274, 168
- Dwek & Arendt (1992) Dwek, E., & Arendt, R. G. 1992, ARA&A, 30, 11
- Dwek et al. (2008) Dwek, E., Arendt, R. G., Bouchet, P., Burrows, D. N., Challis, P., Danziger, I. J., De Buizer, J. M., Gehrz, R. D., Kirshner, R. P., McCray, R., Park, S., Polomski, E. F., & Woodward, C. E. 2008, ApJ, 676, 1029
- Dwek et al. (2007) Dwek, E., Galliano, F., & Jones, A. P. 2007, ApJ, 662, 927
- Dwek et al. (1992) Dwek, E., Moseley, S. H., Glaccum, W., Graham, J. R., Loewenstein, R. F., Silverberg, R. F., & Smith, R. K. 1992, ApJ, 389, L21
- Emmering & Chevalier (1988) Emmering, R. T., & Chevalier, R. A. 1988, AJ, 95, 152
- Fassia et al. (2001) Fassia, A., Meikle, W. P. S., Chugai, N., Geballe, T. R., Lundqvist, P., Walton, N. A., Pollacco, D., Veilleux, S., Wright, G. S., Pettini, M., Kerr, T., Puchnarewicz, E., Puxley, P., Irwin, M., Packham, C., Smartt, S. J., & Harmer, D. 2001, MNRAS, 325, 907
- Fassia et al. (2000) Fassia, A., Meikle, W. P. S., Vacca, W. D., Kemp, S. N., Walton, N. A., Pollacco, D. L., Smartt, S., Oscoz, A., Aragón-Salamanca, A., Bennett, S., Hawarden, T. G., Alonso, A., Alcalde, D., Pedrosa, A., Telting, J., Arevalo, M. J., Deeg, H. J., Garzón, F., Gómez-Roldán, A., Gómez, G., Gutiérrez, C., López, S., Rozas, M., Serra-Ricart, M., & Zapatero-Osorio, M. R. 2000, MNRAS, 318, 1093
- Foley et al. (2007) Foley, R. J., Smith, N., Ganeshalingam, M., Li, W., Chornock, R., & Filippenko, A. V. 2007, ApJ, 657, L105
- Fox et al. (2000) Fox, D. W., Lewin, W. H. G., Fabian, A., Iwasawa, K., Terlevich, R., Zimmermann, H. U., Aschenbach, B., Weiler, K., Van Dyk, S., Chevalier, R., Rutledge, R., Inoue, H., & Uno, S. 2000, MNRAS, 319, 1154
- Fransson et al. (2002) Fransson, C., Chevalier, R. A., Filippenko, A. V., Leibundgut, B., Barth, A. J., Fesen, R. A., Kirshner, R. P., Leonard, D. C., Li, W., Lundqvist, P., Sollerman, J., & Van Dyk, S. D. 2002, ApJ, 572, 350
- Freedman et al. (2001) Freedman, W. L., Madore, B. F., Gibson, B. K., Ferrarese, L., Kelson, D. D., Sakai, S., Mould, J. R., Kennicutt, Jr., R. C., Ford, H. C., Graham, J. A., Huchra, J. P., Hughes, S. M. G., Illingworth, G. D., Macri, L. M., & Stetson, P. B. 2001, ApJ, 553, 47
- Gal-Yam et al. (2007) Gal-Yam, A., Leonard, D. C., Fox, D. B., Cenko, S. B., Soderberg, A. M., Moon, D.-S., Sand, D. J., Li, W., Filippenko, A. V., Aldering, G., & Copin, Y. 2007, ApJ, 656, 372
- Gerardy et al. (2002) Gerardy, C. L., Fesen, R. A., Nomoto, K., Garnavich, P. M., Jha, S., Challis, P. M., Kirshner, R. P., Höflich, P., & Wheeler, J. C. 2002, ApJ, 575, 1007
- Hoyle & Wickramasinghe (1970) Hoyle, F., & Wickramasinghe, N. C. 1970, Nature, 226, 62
- Immler et al. (2008) Immler, S., Modjaz, M., Landsman, W., Bufano, F., Brown, P. J., Milne, P., Dessart, L., Holland, S. T., Koss, M., Pooley, D., Kirshner, R. P., Filippenko, A. V., Panagia, N., Chevalier, R. A., Mazzali, P. A., Gehrels, N., Petre, R., Burrows, D. N., Nousek, J. A., Roming, P. W. A., Pian, E., Soderberg, A. M., & Greiner, J. 2008, ApJ, 674, L85
- Immler & Pooley (2007) Immler, S., & Pooley, D. 2007, The Astronomer’s Telegram, 1004, 1
- Kanneganti et al. (2008, in prep) Kanneganti, S., Park, C., Skrutskie, M., Wilson, J., & Nelson, M. 2008, in prep, FANCAM, A Near-Infrared Imager at Fan Mountain Observatory
- Lucy et al. (1991) Lucy, L. B., Danziger, I. J., Gouiffes, C., & Bouchet, P. 1991, in Supernovae. The Tenth Santa Cruz Workshop in Astronomy and Astrophysics, held July 9-21, 1989, Lick Observatory. Editor, S.E. Woosley, ed. S. E. Woosley, 82
- Maiolino et al. (2004) Maiolino, R., Schneider, R., Oliva, E., Bianchi, S., Ferrara, A., Mannucci, F., Pedani, M., & Roca Sogorb, M. 2004, Nature, 431, 533
- Mattila et al. (2008) Mattila, S., Meikle, W. P. S., Lundqvist, P., Pastorello, A., Kotak, R., Eldridge, J., Smartt, S., Adamson, A., Gerardy, C. L., Rizzi, L., Stephens, A. W., & van Dyk, S. D. 2008, MNRAS, 389, 141
- Meikle et al. (2006) Meikle, W. P. S., Mattila, S., Gerardy, C. L., Kotak, R., Pozzo, M., van Dyk, S. D., Farrah, D., Fesen, R. A., Filippenko, A. V., Fransson, C., Lundqvist, P., Sollerman, J., & Wheeler, J. C. 2006, ApJ, 649, 332
- Meikle et al. (2007) Meikle, W. P. S., Mattila, S., Pastorello, A., Gerardy, C. L., Kotak, R., Sollerman, J., Van Dyk, S. D., Farrah, D., Filippenko, A. V., Höflich, P., Lundqvist, P., Pozzo, M., & Wheeler, J. C. 2007, ApJ, 665, 608
- Meikle et al. (1993) Meikle, W. P. S., Spyromilio, J., Allen, D. A., Varani, G.-F., & Cumming, R. J. 1993, MNRAS, 261, 535
- Merrill (1980) Merrill, K. M. 1980, IAU Circ., 3444, 3
- Modjaz et al. (2005) Modjaz, M., Kirshner, R., Challis, P., & Calkins, M. 2005, IAU Circ., 8628, 2
- Nozawa et al. (2008) Nozawa, T., Kozasa, T., Tominaga, N., Sakon, I., Tanaka, M., Suzuki, T., Nomoto, K., Maeda, K., Umeda, H., Limongi, M., & Onaka, T. 2008, ApJ, 684, 1343
- Nozawa et al. (2003) Nozawa, T., Kozasa, T., Umeda, H., Maeda, K., & Nomoto, K. 2003, ApJ, 598, 785
- Pastorello et al. (2005) Pastorello, A., Aretxaga, I., Zampieri, L., Mucciarelli, P., & Benetti, S. 2005, in Astronomical Society of the Pacific Conference Series, Vol. 342, 1604-2004: Supernovae as Cosmological Lighthouses, ed. M. Turatto, S. Benetti, L. Zampieri, & W. Shea, 285
- Pastorello et al. (2007) Pastorello, A., Smartt, S. J., Mattila, S., Eldridge, J. J., Young, D., Itagaki, K., Yamaoka, H., Navasardyan, H., Valenti, S., Patat, F., Agnoletto, I., Augusteijn, T., Benetti, S., Cappellaro, E., Boles, T., Bonnet-Bidaud, J.-M., Botticella, M. T., Bufano, F., Cao, C., Deng, J., Dennefeld, M., Elias-Rosa, N., Harutyunyan, A., Keenan, F. P., Iijima, T., Lorenzi, V., Mazzali, P. A., Meng, X., Nakano, S., Nielsen, T. B., Smoker, J. V., Stanishev, V., Turatto, M., Xu, D., & Zampieri, L. 2007, Nature, 447, 829
- Pastorello et al. (2002) Pastorello, A., Turatto, M., Benetti, S., Cappellaro, E., Danziger, I. J., Mazzali, P. A., Patat, F., Filippenko, A. V., Schlegel, D. J., & Matheson, T. 2002, MNRAS, 333, 27
- Pooley et al. (2002) Pooley, D., Lewin, W. H. G., Fox, D. W., Miller, J. M., Lacey, C. K., Van Dyk, S. D., Weiler, K. W., Sramek, R. A., Filippenko, A. V., Leonard, D. C., Immler, S., Chevalier, R. A., Fabian, A. C., Fransson, C., & Nomoto, K. 2002, ApJ, 572, 932
- Pozzo et al. (2004) Pozzo, M., Meikle, W. P. S., Fassia, A., Geballe, T., Lundqvist, P., Chugai, N. N., & Sollerman, J. 2004, MNRAS, 352, 457
- Quimby et al. (2007) Quimby, R. M., Aldering, G., Wheeler, J. C., Höflich, P., Akerlof, C. W., & Rykoff, E. S. 2007, ApJ, 668, L99
- Roche et al. (1993) Roche, P. F., Aitken, D. K., & Smith, C. H. 1993, MNRAS, 261, 522
- Sakon et al. (2007) Sakon, I., Wada, T., Ohyama, Y., Ishihara, D., Tanabé, T., Kaneda, H., Onaka, T., Tominaga, N., Tanaka, M., Suzuki, T., Umeda, H., Nomoto, K., Nozawa, T., Kozasa, T., Minezaki, T., Yoshii, Y., Ohyabu, S., Usui, F., Matsuhara, H., Nakagawa, T., & Murakami, H. 2007, ArXiv: 0711.4801
- Schlegel (1990) Schlegel, E. M. 1990, MNRAS, 244, 269
- Smith et al. (2008) Smith, N., Foley, R. J., & Filippenko, A. V. 2008, ApJ, 680, 568
- Smith et al. (2008, in prep) Smith et al., N. 2008, in prep
- Todini & Ferrara (2001) Todini, P., & Ferrara, A. 2001, MNRAS, 325, 726
- Woosley et al. (1989) Woosley, S. E., Hartmann, D., & Pinto, P. A. 1989, ApJ, 346, 395
- Yamaoka et al. (2006) Yamaoka, H., Nakano, S., & Itagaki, K. 2006, Central Bureau Electronic Telegrams, 666, 2