A Quantum Imager for Intensity Correlated Photons
Abstract
We report on a device capable of imaging second-order spatio-temporal correlations between photons. The imager is based on a monolithic array of single-photon avalanche diodes (SPADs) implemented in CMOS technology and a simple algorithm to treat multiphoton time-of-arrival distributions from different SPAD pairs. It is capable of ps temporal resolution with fluxes as low as photons/s at room temperature. An important application might be the local imaging of as a means of confirming the presence of true Bose-Einstein macroscopic coherence (BEC) of cavity exciton polaritons.
Recent experiments [1, 2, 3, 4] have reported the Bose-Einstein condensation (BEC) phase transition in polariton system in a semiconductor microcavity. The macroscopic quantum degeneracy is typically detected by probing the statistical properties of light emitted from a microcavity, under the presumption that the statistics of the exciton polaritons are faithfully transferred to the emanating photons.
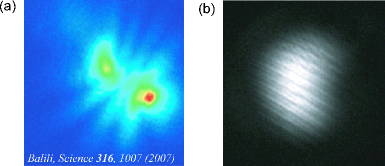
It has been further assumed that observation of the interference fringes similar to those in Michelson or Young interferometers (figure 1(a)) is sufficient to establish the fact of macroscopic coherence in polariton system. [1, 4, 5] Two points on the wave front separated by a distance produce intensity pattern , such that the fringe visibility measures the magnitude of the first-order correlation function. But simply measuring this quantity alone is ambiguous because a coherent light source (e.g., a photon laser or decaying polariton BEC) can exhibit the same first-order correlations as a chaotic (or thermal) light source (e.g. Hg-Ar discharge lamp in figure 1(b)). Table 1 shows that proper disambiguation of a coherent state also requires measurement of the second-order correlation function associated with intensity noise correlations. Here, is the light intensity at a point and time . The minimal condition to confirm the BEC phase transition in a polariton system then becomes (third column of Table 1). So far, very few theoretical and experimental studies of the second-order correlations in a polariton system were limited to the point in the momentum space (in the lateral cavity direction), reporting thus a spatially-averaged value of and ignoring the fact that 2D BEC can be achieved only in spatially confined systems. As a consequence, the model of Ref.[6] predicts increasing correlation peak height with polariton number caused by the strong scattering effects above the critical threshold density. Such behaviour for polaritons at has been confirmed in Ref.[7], while the experimental results of Ref.[8] disagree with such behaviour. To confirm the BEC phase transition in a polariton system, one needs to distinguish the presence of both coherent condensate (=1) and thermal noncondensate () fractions, which can be achieved by local measurement of the first-order and second-order correlations. However, the small dimensions of the polariton distribution in the microcavity, means that such measurements must be capable of resolving a spatial dependence in . All these requirements demand an integrated monolithic photon detector, like a camera, but capable of imaging intensity noise correlations.
| Function | Incoherent | Coherent | Chaotic |
|---|---|---|---|
| 0 | 1 | 1 | |
| 1 | 1 | 2 |
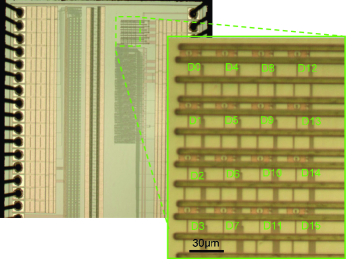
In this letter, we present an imaging device allowing the second-order (intensity) correlations of a field to be probed locally. The current implementation comprises a silicon array of single-photon avalanche diodes (SPADs) implemented in 0.35 CMOS technology [9]. The device incorporates on-chip high bandwidth I/O circuitry (figure 2) for off-chip data processing of multi photon arrivals. We demonstrate the operational performance of our monolithic -imager in a miniature replication of the Hanbury Brown and Twiss (HBT) stellar interferometer [10].
Each pixel in our SPAD array is based on an avalanche photodiode operating in the Geiger mode. The -diameter active region of a SPAD n-well pixel consists of a p+-n junction reverse-biased above its breakdown voltage. When a photon is absorbed in the multiplication region, an avalanche is triggered with a certain probability. The measured single photon detection probability of such 0.35-CMOS SPAD pixels is 25 at 546 nm wavelength and 4 V excess voltage above the breakdown threshold. (The detection probability is 40% at the peak sensitivity wavelength 450 nm [9].) The avalanche breakdown is subsequently quenched by an on-chip ballast resistor, which is used to read out the photodetection events. Its value defines the dead time of the detector which is 15 ns for each SPAD pixel of the 4x4 array considered here. The chip comprises built-in high-bandwidth electronics to convert Geiger pulses into digital signals for off-chip data processing. This design drastically improves the signal-to-noise ratio. At room temperature, the lowest detectable photon flux is set by the dark count rate (DCR) of SPADs in the – Hz range. Such low DCR is achieved by using small n-wells of diameter . The lowest detectable photon flux density in our experiments is , well below the level in polariton BEC experiments. The array pitches are horizontal and vertical. All detectors in the array have separate parallel outputs so that simultaneous pairwise measurements are possible at a temporal resolution limited by the SPAD jitter characteristics ( ps).
The pairwise intensity noise correlations are computed using an external four-channel GHz bandwidth digital oscilloscope (Wavemaster 8600A, LeCroy) by programming it with an algorithmic version of equation (1):
| (1) |
where integers enumerate detector pixels, and are discrete random variables whose values (no event) or (photon detection) correspond to the binary data stream (figure 3(a)) emanating from any pair of detectors and , respectively. The spatial lag is set by the separation of the detector pair within the SPAD array. Time-lag increments are set by multiples of temporal resolution , where is the width of measurement window and is the overall number of measurements series.
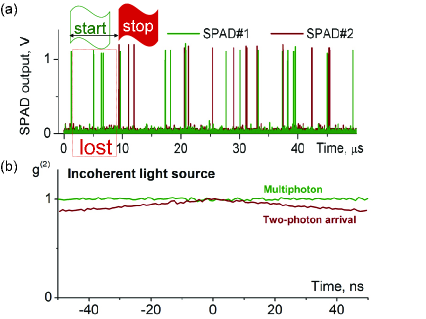
Unlike conventional detection methods based on start-stop timing histograms of delayed single photon arrivals [figure 3(a)], our approach implements properly normalized multiphoton distribution which is robust against missing detection events, the impact of Poisson-like distribution decay at large and intensity modulation. Equation (1) permits any count rates and temporal window of interest and does not require a statistical hypothesis to normalize . Figure 3(b) shows the benefits of our technique by comparing measurements of incoherent broad-band light using multiphoton arrivals and the standard two-photon histogram.
In figure 3(b), for the standard approach based on time-delayed coincidence events, the histogram was acquired and then normalized assuming that at the lag there should be no correlations for incoherent light source (i.e., assuming that ). We shall remind that a probability distribution of time intervals between two consecutive photons is for a Poisson process [11, 12] and that for a multi-mode Gaussian (chaotic light) and a coherent (Poisson statistics) states these distributions are the same [13]. Therefore, when normalized in such way, the standard method shows the onset of Poisson distribution for large time lag . Thus in fig 3(b), the average count rate at detectors is MHz, and for ns, the error is . The conventional procedure is thus limited by the small count rate and temporal window width product. At the same time, our approach produces the correct correlations independent of the measurement interval and the photon flux intensity.
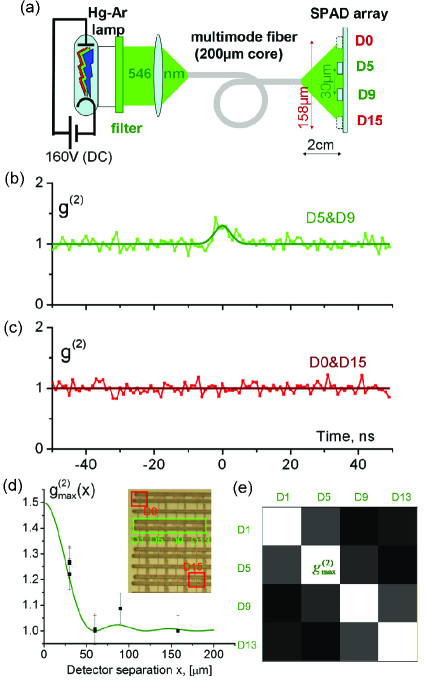
The -imager was tested by measuring the statistical properties of an extended thermal light source. As a model system for a quasi-monochromatic chaotic light source, we used a Hg-Ar spectral wavelength calibration lamp (bulb CAL-2000-B, Ocean Optics) with U-folded discharge and cold cathode. This lamp, designed for operation in the AC regime, also operated well with a DC power supply ( V @ mA). To start the discharge, we used the original AC power supply of CAL2000 source which was connected in parallel with a DC source via a filter ( inductance) such that the AC supply was gradually turned off while the DC source was gradually turned on.
The light emitted by the lamp was transmitted through a nm bandpass filter (FL543.5-10, Thorlabs), which keeps only the emission at the green line of mercury ( nm). The light then was injected into a m long multimode fiber (figure 4(a)) with core diameter . The other end of the fiber was used to illuminate the SPAD array placed in the far field zone of the fiber end, at a distance cm from the fiber [figure 4(a)]. The numerical aperture of the fiber (NA=0.22) assumes that the whole SPAD array is over illuminated. Such extended thermal light source is of the angular width rad and exhibits first-order correlations (figure 1(b)), when SPAD array is replaced by Young double-pinhole interferometer (not shown in the figure).
The second-order spatio-temporal correlations for a non-polarized single-mode chaotic light source are determined by the first-order correlations [11, 14, 15] with coherence time due to the inhomogeneous broadening (FWHM) of the emission line
| (2) |
where the second term in the right hand side takes into account the decorrelation effects due to unpolarized light (the coefficient ), the zero-delay degree of spatial coherence and the Gaussian profile of the delayed first-order correlation function for an inhomogeneously-broadened line.
To examine the temporal correlations, we used detector pairs in the middle of the array as well pairs at diagonally opposite corners, thus providing correlations between two different regions separated by and , respectively. At small separation (figure 4(b)), the data shows an excess of coincidences . At large distance, detector counts are uncorrelated (figure 4(c)).
At temporal resolution of the scope ns, the measured coherence time is 5.2 ns such that the impact of integration effects on measured correlation peak width and height is less than 2 . [16] The corresponding linewidth of the source is (FWHM), which is less than the Doppler width of the green line of Hg and can be attributed to the Dicke linewidth narrowing due to the buffering effect of Ar in the lamp bulb.
The spatial oscillations of due to the spatial coherence factor in (2) were measured by selecting detector pairs from a row of the array (D1–D13 row in figure 2) with detector separation 30, 60 and 90 m. Figure 4(d) shows the correlation excess at zero-delay is well fitted by a function in equation (2), yielding the angular width of the source rad, close to the estimated value.
Being limited by the number of acquisition channels, we were able to record simultaneous correlations between four independent detectors. In figure 4 (e), measured along the array row is plotted as a pairwise correlation map . In this image map, the spatial oscillations of the coherence factor are clearly visible.
In conclusion, we have presented a -imager built with conventional CMOS technology, which is capable of measuring second-order spatio-temporal correlated photons and thereby offers an important means for verifying the existence of a BEC state of cavity exciton polaritons. Future work will include the development of larger arrays of SPADs, the integration of on-chip data processing based on equation (1), and the extension to other -imaging applications.
References
References
- [1] Kasprzak J et al 2006 Nature 443 409–414
- [2] Deng H, Press D, Götzinger S, Solomon G S, Hey R and Ploog K H and Yamamoto Y 2006 Phys. Rev. Lett. 97 146402
- [3] Christopoulos S et al 2007 Phys. Rev. Lett. 98 126405
- [4] Balili R, Hartwell V, Snoke D, Pfeiffer L, and West K, 2007 Science 316 1007–1010
- [5] Snoke D W 2003 Phys. Stat. Sol. (b) 238 389–396
- [6] Schwendimann P and Quattropani A 2008 Phys. Rev. B 77 085317
- [7] Kasprzak J, Richard M, Baas A, Deveaud B, André R, Poizat J-Ph, and Le Si Dang 2008 Phys. Rev. Lett. 100 067402
- [8] Deng H, Weihs G, Santori Ch, Bloch J, Yamamoto Y 2002 Science 298 199–202
- [9] Niclass C, Sergio M, Charbon E 2006, Proc. SPIE Optics East (Boston) vol 6372 (Bellingham: SPIE–The International Society for Optical Engineering) p 63720S
- [10] Hanbury Brown R and Twiss R Q 1956 Nature 178 1046-1048
- [11] Glauber R J 2007 Ann. Phys. (Leipzig) 16 6- 24
- [12] Saleh B E A 1973 J. Phys. A: Math., Nucl. Gen. 6 L161–L164
- [13] Arecchi F T 1965 ”Measurement of the statistical distribution of gaussian and laser sources” Phys. Rev. Lett. 15 912–916
- [14] Glauber R J 1963 Phys. Rev. 130 2529
- [15] Glauber R J 1963 Phys. Rev. 131 2766
- [16] Scarl D B 1966 Phys. Rev. Lett. 17 663