Infrared study of the southern Galactic star forming regions associated with IRAS 10049-5657 and IRAS 10031-5632
Abstract
We investigate the physical conditions of the interstellar medium and stellar components in the regions of the southern Galactic star forming complexes associated with IRAS 10049-5657 and IRAS 10031-5632. These regions have been mapped simultaneously in two far infrared bands ( 150 & 210 m), with angular resolution using the TIFR 1-m balloon borne telescope. Spatial distribution of the temperature of cool dust and optical depth at 200 m have been obtained taking advantage of the similar beams in the two bands. The HIRES processed IRAS maps at 12, 25, 60 and 100 m have been used for comparison. Using the 2MASS near infrared sources, we find the stellar populations of the embedded young clusters. A rich cluster of OB stars is seen in the IRAS 10049-5657 region. The fits to the stellar density radial profile of the cluster associated with IRAS 10049-5657 has been explored with inverse radius profile as well as the King’s profile; the cluster radius is obtained to be pc. The source in the cluster closest to the IRAS peak is IRA-7 which lies above the zero age main sequence curve of spectral type O5 in the colour-magnitude diagram. Unlike IRAS 10049-5657, a small cluster comprising of a few deeply embedded sources is seen at the location of IRAS 10031-5632. Self consistent radiative transfer modelling aimed at extracting important physical and geometrical details of the two IRAS sources show that the best fit models are in good agreement with the observed spectral energy distributions. The geometric details of the associated cloud and optical depths () have been estimated. A uniform density distribution of dust and gas is implied for both the sources. In addition, the infrared ionic fine-structure line emission from gas has been modelled for both these regions and compared with data from IRAS-Low Resolution Spectrometer. For IRAS 10049-5657, the observed and modelled luminosities for most lines agree to within a factor of four while for IRAS 10031-5632, we find a discrepancy of a factor of 100 and it is likely that some basic assumptions of the model are not valid in this case.
1 Introduction
HII regions are astronomical sources that represent early stages of deeply embedded high mass (O or early B) stars. Their study can provide vital information about high mass star formation as well as their interaction with the parent molecular cloud. Being deeply embedded in interstellar cloud including the dust component, almost all of their energy is absorbed and re-emitted in the infrared wavebands. IRAS 10049-5657 (G282.0-1.2) and IRAS 10031-5632 (G281.6-1.0) are Galactic star forming regions in the southern sky, which are generally less-studied. Radio measurements indicate that IRAS 10049-5657 is an extended HII region (Hill, 1968; Manchester, 1969).
A number of distance estimates to IRAS 10049-5657 can be found in the literature, ranging from 5.1 to 7.1 kpc. Here we use the distance of 6.3 kpc estimated by Caswell & Haynes (1987) based on radio recombination line measurements (for R⊙ = 8.5 kpc and Galactic rotation velocity = 220 km s-1 at R⊙). The distance to IRAS 10031-5632 is estimated to be 3.7 kpc (Caswell & Haynes, 1987).
Recently, it has been concluded that IRAS 10049-5657 complex harbours a very massive OB star cluster (Bik et al. 2005; Hanson et al., 2003). Bik et al. (2005) have carried out near-infrared K-band spectroscopy of few members of this cluster and find two very massive (O3-O4) stars here. IRAS 10049-5657 has been studied as a part of surveys for the search of emission lines including masers. Formaldehyde absorption has been detected towards this source at 4.8 GHz (Whiteoak and Gardner, 1974) and 14.5 GHz (Gardner and Whiteoak, 1984). Whiteoak et al (1982) detected CO (1-0) line emission from this source using the 4-m radio telescope of CSIRO. Search for methanol transition (Peng and Whiteoak, 1992), methanol maser (Schutte et al, 1993) and OH maser (Cohen et al, 1995) close to this source have led to negative results. IRAS 10049-5657 has been imaged by Puchalla et al. (2002) at 42 GHz using the Mobile Anisotropy Telescope on Cerro Toco (MAT/TOCO) and an integrated flux of Jy within a 0.3∘ circular beam has been obtained by them. Both these regions, IRAS 10049-5657 and IRAS 10031-5632 have been studied as a part of the Parkes-MIT-NRAO (PMN) survey (Kuchar and Clark, 1997). They find the peak radio flux density of IRAS 10049-5657 and IRAS 10031-5632 at 5 GHz to be 25.7 Jy/beam and 1.0 Jy/beam, respectively, where the beam is . CS (2-1) line emission has been observed close to both these regions (Bronfman et al., 1996) using the SEST telescope. The IRAS-LRS (Low Resolution Spectrometer) spectrum of IRAS 10031-5632 shows strong [Ne II] emission line at 12.8 m (de Muizon et al., 1990; Simpson & Rubin, 1990), a relatively weak [S III] emission line at 18.7 m as well as emission in the Unidentified Infrared Bands (UIBs) at 7.7, 8.6 and 11.3 (Zavagno et al., 1992; de Muizon et al., 1990). Water vapor maser (Braz et al. 1989) as well as methanol maser (Schutte et al. 1993) have not been found close to IRAS 10031-5632.
The less known southern Galactic massive star forming regions are being studied under a long-term program which involves observing these sources in far infrared (Vig et al. 2007, Ojha et al. 2002, Karnik et al. 2001, Ghosh et al. 2000, Verma et al. 1994). In this paper, we present a systematic study of the star forming regions associated with IRAS 10049-5657 and IRAS 10031-5632. The star forming region associated with IRAS 10049-5657 is believed to harbour a cluster of very massive stars. IRAS 10031-5632 is, on the other hand, a young star forming region with few members belonging to the cluster. We have carried out an infrared study of these southern Galactic HII regions in detail with the aim of understanding the energetics, physical sizes, the spatial distribution of interstellar dust and its temperature as well as the associated young clusters. Section 2 describes observations and other data sets used. Section 3 describes the results and in Section 4, radiative transfer modelling of these sources is presented. A comprehensive discussion of these sources is carried out in Section 5 and a brief summary is presented in Section 6.
2 Observations and data reduction
2.1 Far infrared observations
The Galactic star forming regions associated with IRAS 10049-5657 and IRAS 10031-5632 have been observed using the two-band far infrared (FIR) photometer system at the Cassegrain focus of the TIFR 100 cm (f/8) balloon borne telescope. The observations were carried out during the balloon flight from the TIFR Balloon Facility, Hyderabad in India (latitude north, longitude east) on Feb 20, 1994. Details of the telescope and the observational procedure are given by Ghosh et al (1988). The two FIR bands use a pair of 23 composite silicon bolometer arrays, cooled to 0.3K by liquid 3He which view identical parts of the sky simultaneously. The field of view of each detector is . The absolute positions were established from the detections of catalogued stars with an optical photometer located at the focal plane of the telescope, simultaneously during the FIR observations. The planet Jupiter was observed at the beginning as well as at the end of the flight. The observations of Jupiter were used for the absolute flux calibration of the two band FIR photometer (12 channels) as well as for the determination of the Point Spread Function (PSF). The spectral response of each band of the FIR photometer was determined in the laboratory using a Michelson interferometer and a Golay cell as a comparison detector. The two FIR wavebands will be referred to as 150 and 210 bands corresponding to the for 30 K source with emissivity law.
The region around IRAS 10049-5657 () and IRAS 10031-5632 () was mapped by raster scanning the region of the sky in cross-elevation with steps in elevation at the end of each scan. The FIR signals were gridded into a matrix with a pixel size of . The deconvolution of the observed chopped signal matrix was carried out using the Maximum Entropy Method similar to that of Gull & Daniell (1978) (for details see Ghosh et al, 1988). An angular resolution of has been achieved in the FIR maps using this method.
2.2 Other datasets used
2.2.1 IRAS
The data from the Infrared Astronomical Satellite (IRAS) survey in the four bands (12, 25, 60 and 100 ) for IRAS 10049-5657 and IRAS 10031-5632 were HIRES (High Resolution processing using Maximum Correlation Method; Aumann et al., 1990) processed at the Infrared Processing and Analysis Center (IPAC, Caltech) to obtain high angular resolution maps. The flux densities of the sources within a circular region of diameter (centered on the peak) have been extracted from these images. IRAS 10031-5632 appears in IRAS-LRS Catalog (IRAS Science Team, 1986) while the LRS spectrum of IRAS 10049-5657 is presented by Volk & Cohen (1989). These spectra, in the wavelength range 8-22 , and the flux densities have been used for constructing the spectral energy distributions (SEDs).
2.2.2 MSX
The Midcourse Space Experiment111 This research made use of data products from the Midcourse Space Experiment. Processing of the data was funded by the Ballistic Missile Defense Organization with additional support from NASA Office of Space Science. This research has also made use of the NASA/ IPAC Infrared Science Archive, which is operated by the Jet Propulsion Laboratory, Caltech, under contract with the NASA. (MSX) surveyed the entire Galactic plane within b in four mid infrared wavebands: 8.3, 12.1, 14.7 and 21.3 at a spatial resolution of (Price et al., 2001). The panoramic images of the Galactic plane survey of MSX were taken from IPAC. The images of IRAS 10049-5657 and IRAS 10031-5632 were used to extract the sources and obtain the flux densities within a circular region of diameter in order to construct the SEDs. Point sources close to these star forming regions have been selected from MSX Point Source Catalog Version 2.3 (Egan et al., 2003) and cross-correlated with 2MASS sources (see Sect. 2.2.3).
2.2.3 2MASS
The point sources around the regions IRAS 10049-5657 and IRAS 10031-5632 were selected from the Two Micron All Sky Survey222This publication makes use of data products from the Two Micron All Sky Survey, which is a joint project of the University of Massachusetts and the Infrared Processing and Analysis Center/California Institute of Technology, funded by the NASA and the NSF. (2MASS) Point Source Catalog (PSC). The 2MASS PSC is complete down to J , H and K mag for S/N, in the absence of confusion. The 2MASS sources used in this study are those with good photometric quality (rdflg ). The J, H and Ks magnitudes of the selected sources have been used to construct colour-magnitude (CM) and colour-colour (CC) diagrams which have been used to study the embedded clusters in these regions. The JHKs magnitudes and images were taken from IPAC.
2.2.4 SUMSS
The Sydney University Molonglo Sky Survey (SUMSS) is a radio imaging survey of the sky south of declination (Bock et al., 1999). This survey uses the Molonglo Observatory Synthesis Telescope333The MOST is operated by the University of Sydney and supported in parts by grants from the Australian Research Council. (MOST), operating at 843 MHz with a bandwidth of 3 MHz. The synthesised beam size is cosec. The SUMSS radio images of IRAS 10049-5657 and IRAS 10031-5632 have been used to study the distribution of ionised gas around this region.
3 Results
In this section, we present the results obtained from the observations as well as from the available data. As our study includes a wide wavelength range (near infrared to radio), we classify our results according to those for the dust and gas components (interstellar medium) versus the stellar component for both the regions, IRAS 10049-5657 and IRAS 10031-5632.
3.1 IRAS 10049-5657
3.1.1 Interstellar medium
The deconvolved maps of IRAS 10049-5657 at 150 and 210 m are presented in Fig. 1. Figure 1 (left) shows emission from the IRAS 10049-5657 region at 150 m while Fig. 1 (right) shows the emission at 210 m, from the complete region () mapped by the telescope. The angular size (50% contour level) of IRAS 10049-5657 at 150 and 210 m is . The FIR emission in these maps samples the cold dust around these regions. IRAS 10049-5657 is well resolved in both the bands. The FIR emission in this region shows extension towards north-east in both the bands. This emission towards the north-east extends to a larger scale in the 210 m map in Fig. 1 (right). Taking advantage of the simultaneous observations in the two bands, with almost identical field of view, we have generated maps of the dust temperature () and optical depth at 200 m (). The dust temperature T(150/210) and optical depth () maps are shown in Fig. 2. For these maps, we have assumed dust emissivity of the form . The temperature distribution shows plateaus of maximum (60 K) towards north-west and south-east of the FIR peak. We have detected dust as cold as 20 K. The peak optical depth at 200 m is determined to be and is located at the position of the peak of FIR emission. Another peak is seen to the west of the maximum optical depth with an extension corresponding to north-east. The IRAS-HIRES maps of the region around IRAS 10049-5657 at 12, 25, 60 and 100 m are shown in Fig. 3. The achieved angular resolutions are at 12 and 25 µm, at 60 , at 100 . The flux densities of IRAS 10049-5657 integrated over diameter, centered on the peak, from the TIFR and IRAS-HIRES maps are listed in Table 1.
We have modelled thermal continuum emission from interstellar dust alongwith the emission in Unidentified Infrared Bands (UIBs), using mid-IR data from the MSX Galactic Plane Survey in the 8.3, 12.1, 14.7 and 21.3 bands. This has been carried out using the scheme developed by Ghosh & Ojha (2002). In this scheme, the emission from each () pixel in the MSX images is modelled to be a combination of two components: (i) thermal continuum from the warm dust grains (gray body) and (ii) the emission from the UIB features falling within the MSX band. The scheme assumes that dust emissivity follows the power law of the form and the total radiance due to UIBs in the 12 m band is proportional to that in the 8 m band. The spatial distribution of UIB emission predicted by this scheme is presented in Fig. 4. The morphology of UIB emission shows extensions towards the south-west near the peak as well as due north-west at the fainter levels. The peak strength of the modelled UIB emission is W m-2 Sr-1 and is close () to the IRAS position. Table 1 also lists the flux densities of IRAS 10049-5657 from MSX maps integrated within a circular region of diameter .
The SUMSS radio continuum emission from the region around IRAS 10049-5657 at 843 MHz is shown in Fig. 5. A dynamic range of is achieved in this region (peak flux is 4.3 Jy/beam; rms noise is mJy/beam). The radio emission peaks at ( = , = -57∘ 12 40.0). The integrated radio flux density is Jy over 43.6 arcmin2.
3.1.2 Stellar component
The distribution of near-infrared sources (selected from 2MASS PSC) in the region around IRAS 10049-5657 was investigated. A higher density of sources close to the IRAS 10049-5657 region compared to neighbouring regions implied an embedded cluster. We have used 2MASS sources to study the nature of embedded cluster. We first estimate the cluster radius. For this, we select a large region of radius around the IRAS peak. To account for the contribution from the field stars (for background determination), we select a control field which is 20′ to the east of IRAS 10049-5657. The centre of the cluster was estimated by convolving a gaussian with the stellar distribution and taking the point of maximum density as the centre. To determine the radial profile, the cluster region was divided into a number of concentric annuli with respect to the cluster centre. The surface number density of stars were obtained by counting them in each 7′′ annulus and dividing by the annulus area. The King’s model, , and the inverse radius model, , of the following functional forms are fitted to the surface density radial profile.
Here, and are the fitted background constants for the King’s and inverse radius profile, respectively. For the King’s profile, represents the core concentration at radius zero and is the core radius. represents the stellar density of the inverse profile at the core. The radial profile of the observed star density as well as the fits are shown in Fig. 6. A clear gradient in surface number density distribution confirms the existence of clustering (crowdiness) at centre of the region. The radial profile of the cluster merges with the background field at , yielding the extent of the cluster to be pc. The background level as estimated from the control field is stars pc-2, which agrees well with the values of and stars pc-2 yielded by the inverse radius and King’s profile fitting, respectively. Note that these estimates of the stellar density towards the HII region when compared with the adjacent fields are unlikely to be affected by extinction (i.e. background stars) since the cluster is fairly distant.
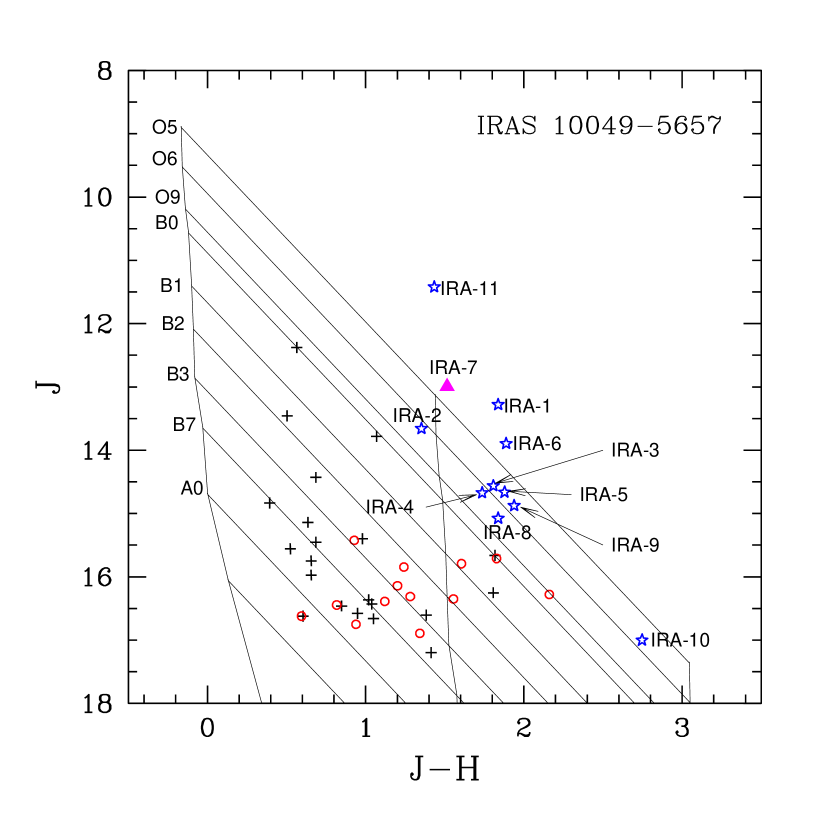
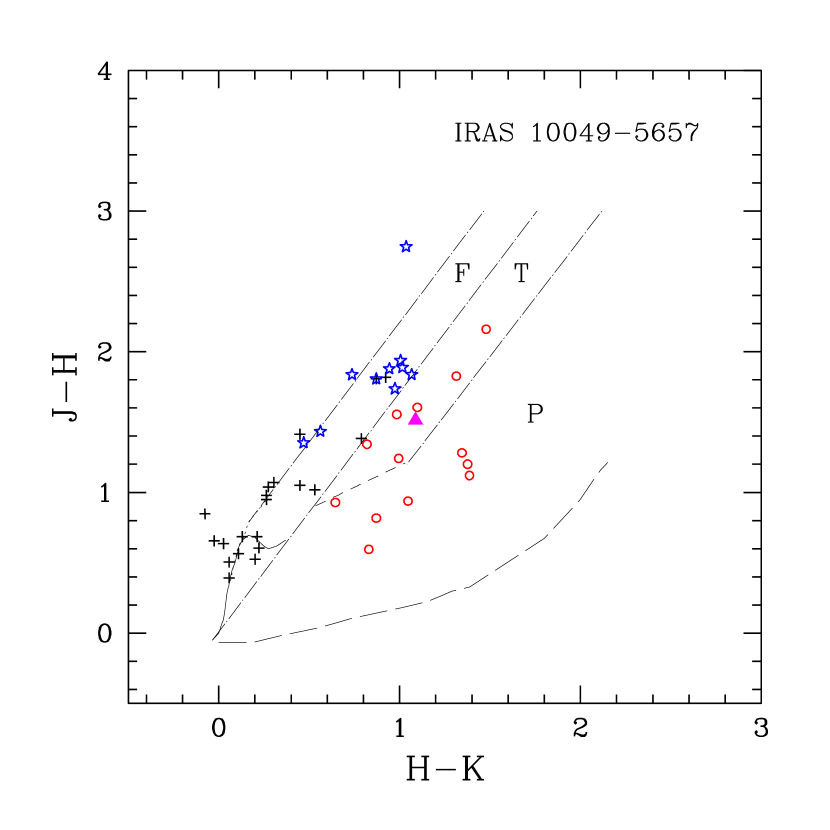
Within a cluster radius of around the cluster centre ( = , = -57∘ 12 25.2), 89 sources were found. Of these, 45 were detected in all the three JHKs bands of 2MASS. Forty-four sources have been detected in either H and Ks bands or only Ks band. We have discussed the nature of stellar populations in this region using the CM (J-H vs J) and the CC (J-H vs H-K) diagrams which are shown in Fig. 7. We have assumed extinction values of AJ/AV = 0.282, AH/AV = 0.175 and A/AV = 0.112 from Rieke & Lebofsky (1985). All the 2MASS magnitudes as well as the curves are in the Bessel & Brett (1988) system. In the CM diagram, the nearly vertical solid lines from left to right (with increasing J-H) represent the ZAMS curves (for a distance of 6.3 kpc) reddened by AV = 0, 15 and 30 mag, respectively. The slanting lines joining them trace the reddening vectors of these ZAMS stars. In the CC diagram, the locii of the main sequence and giant branches are shown by the solid and dotted lines, respectively. The short-dash line represents the locus of classical T-Tauri stars (Meyer et al., 1997). The parallel dot-dash straight lines follow their reddening vectors. The long-dash line represents the locus of Herbig Ae/Be stars (Lada and Adams, 1992). We classify the CC diagram into three regions, as shown in the figure (see Ojha et al., 2004). The ‘F’ region is considered to be the region where field stars (main sequence stars, giants), Class III and Class II objects with small infrared excess are located. The ‘T’ sources are located redward of region ‘F’ but blueward of the reddening line projected from the red end of the T-Tauri locus of Meyer et al. (1997). These sources may be considered to be mostly Class II with large NIR excess (Classical T Tauri like-stars) and/or extremely reddened early type ZAMS stars, having excess emission in K-band (e.g., Blum, Damineli & Conti, 2001 and references therein). The ‘P’ region is where the protostar-like Class I objects and Herbig Ae/Be stars are mostly located. In Fig. 7 (left) CM diagram, the 10 sources lying above the ZAMS curve of spectral type O9 are shown as asterisk symbols while 13 sources with infrared excess are shown as open circles. It is likely that few of these objects are foreground objects or bright background giants. The source lying above the ZAMS curve of O9 and lying in the ’T’ region is shown as a solid triangle. The remaining sources are represented by plus-symbols. It is important to note that the CM and CC diagrams are useful tools for estimating the approximate nature of the stellar populations within the cluster in a statistical sense.
3.2 IRAS 10031-5632
3.2.1 Interstellar medium
The intensity maps of the region around IRAS 10031-5632 in the 150 and 210 m FIR bands are shown in Fig. 8. The emission at 210 m from the entire mapped region () is shown in Fig. 8 (right). The isophotes in both the maps have been displayed upto 1% level of the peak intensities. A detailed investigation of these maps reveals that IRAS 10031-5632 is unresolved at 150 m but is extended at 210 m map. At fainter levels, we observe large-scale extended emission, particularly towards the south-east. The HIRES-processed IRAS maps for the corresponding region around IRAS 10031-5632 are shown in Fig. 9. The angular resolution achieved in these maps are at 12 and 25 µm, at 60 , at 100 . The peak position and flux density details of IRAS 10031-5632 are given in Table 1. The emission in the mid infrared bands of MSX has been used to model the the peak UIB emission which is W m-2 Sr-1.
The SUMSS radio emission in region around IRAS 10031-5632 at 843 MHz is shown in Fig. 10. The dynamic range of the radio map is (peak flux is 652 mJy/beam; rms noise is mJy/beam). The peak of radio emission is at = , = -56∘ 46 38.0. The integrated flux density is Jy over 4.9 arcmin2.
3.2.2 Stellar component
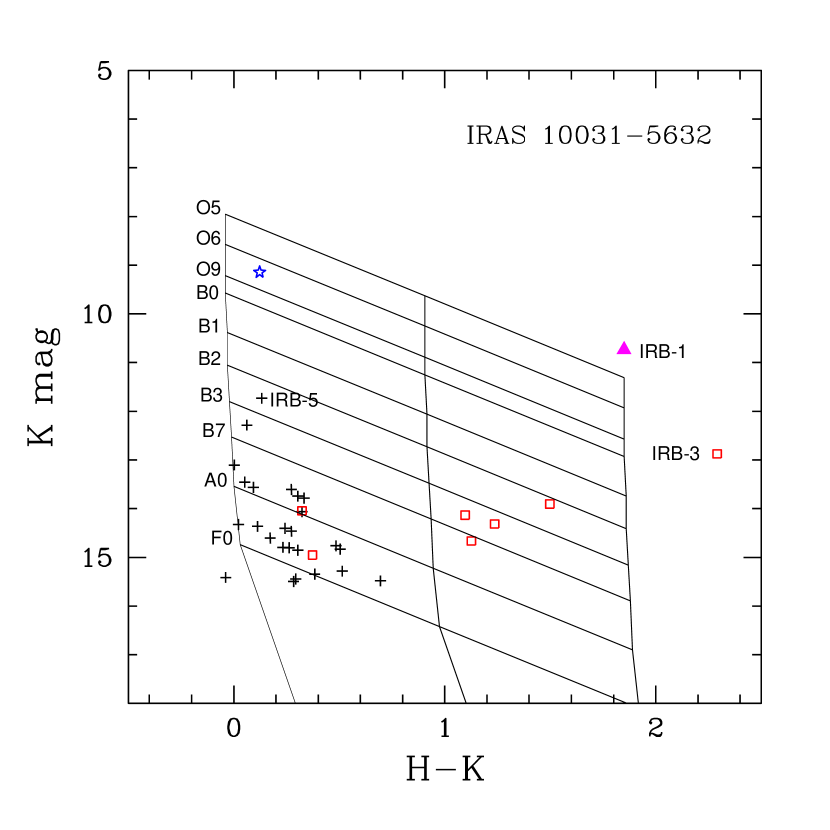
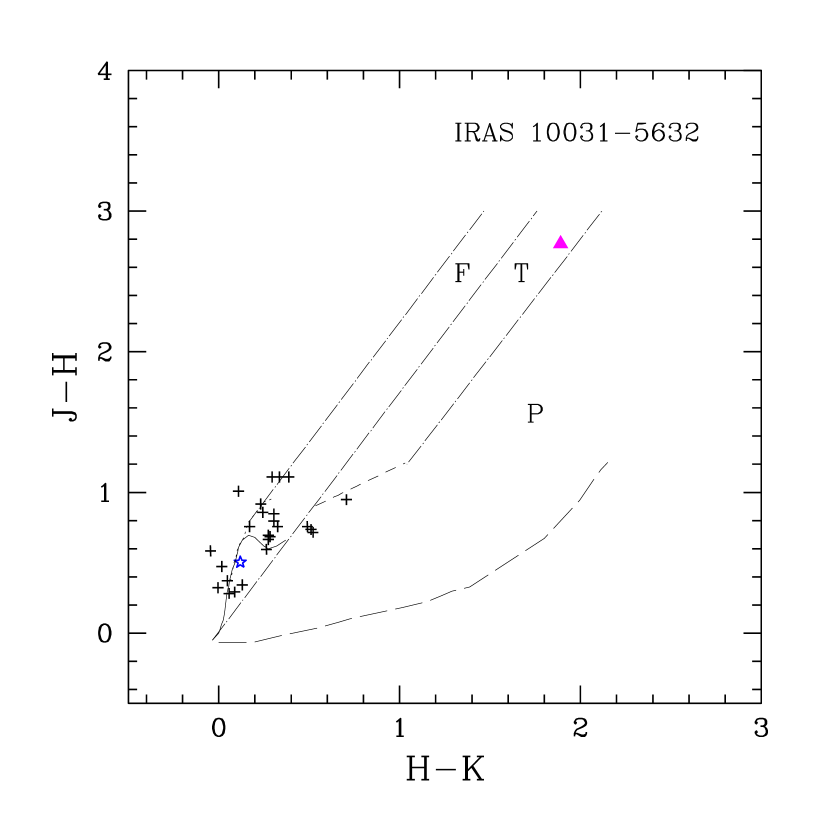
We have used the 2MASS sources in the vicinity of IRAS 10031-5632 to study the stellar populations here. In a circular region of radius around the IRAS peak, 27 sources have been detected in JHKs bands while 14 sources are detected in either H and Ks bands or only Ks band. The CM (H-K vs K) and CC (J-H vs H-K) diagrams of the sources detected in all the three bands are shown in Fig. 11. The ZAMS curves in the CM diagram are for a distance of 3.7 kpc reddened by AV = 0, 15 and 30 mag, respectively. As in the case of IRAS 10049-5657, all the 2MASS magnitudes as well as the curves are in the Bessel & Brett (1988) system. The source lying above the ZAMS curve of spectral type O9 is represented by an asterisk while the filled triangle represents a source lying above the ZAMS curve of spectral type O9 and having an infrared excess. The 7 sources detected only in HKs bands are shown as open squares in the figure. The remaining sources are denoted by crosses. An investigation into the distribution of 2MASS PSC sources in the region around IRAS 10031-5632 shows a few sources grouped together near the IRAS peak. For this cluster, we have been unable to determine the cluster radius owing to the low surface density of stars (very few excess stars close to the IRAS peak).
4 Radiative Transfer Modelling
In an attempt to obtain a self-consistent picture of these star forming regions using all the available data as well as to extract important physical parameters, we have carried out radiative transfer modelling of IRAS 10049-5657 and IRAS 10031-5632. The symmetric morphology of contours near the centrally located peak in the FIR maps supports the one-dimensional treatment of the radiative transfer modelling.
4.1 Continuum emission
Each star forming region is modelled as a spherically symmetric cloud of gas (hydrogen) and dust, powered by a centrally embedded source (single or cluster of ZAMS stars). The cloud is immersed in an average interstellar radiation field. The radiative transfer equations have been solved assuming a two-point boundary condition for the spherical cloud. The gas exists throughout the cloud, i.e. from the stellar surface to the edge of the cloud. The dust exists in a spherical shell with a cavity at the centre. This is because close to the exciting source(s), the dust grains are destroyed when exposed to excessive radiative heating. Two commonly used types of interstellar dust are explored; the DL type (Draine & Lee, 1984) and the MMP type (Mezger, Mathis & Panagia, 1982). In the spherical shell where gas and dust co-exist, the gas-to-dust ratio is held constant. Other details of this self-consistent scheme are given in Mookerjea & Ghosh (1999). The parameters explored are as follows : the geometrical dimensions of the cloud (primarily the radius of the dust-free cavity; the outer diameter is guided by the observed angular extent and the distance), radial density distribution law (three power law exponents : n(r) r0, r-1, or r-2), radial optical depth due to dust, the nature of embedded source/(s) (single ZAMS star or a cluster, consistent with the total observed luminosity), relative abundances of different grain types (silicate, graphite), and the gas-to-dust ratio. The observational constraints include the SED due to thermal emission from the dust component, angular sizes at different wavelengths and radio continuum emission from the H II region. The parameters corresponding to the best fit models for the two sources are presented in Table 2. While no claim is made about the uniqueness of these parameter-sets, the following comments in support of the robustness of the results are in order : - a constant density radial profile provides the best fit for both regions and the r-1 or r-2 density profiles are conclusively ruled out by the observed SED; - inner (dust-free) cavity radii lower than those derived result in short wavelength fluxes significantly higher than those observed and are thus ruled out; - radio continuum emission is quite sensitive to the nature of the central energy source, viz., single star versus a cluster.
4.2 Line emission from gas
We have also modelled the infrared nebular/ionic fine structure line emission from gas around IRAS 10049-5657 and IRAS 10031-5632, using a sophisticated scheme which uses more details of the interstellar gas component. This scheme developed by Mookerjea & Ghosh (1999), uses the photoionisation code CLOUDY (Ferland, 1996), which solves for statistical and thermal equilibrium by balancing various ionization-neutralization processes as well as heating-cooling processes. The scheme additionally includes : (a) the exact structure of the cloud / H II region (viz., central dust-free cavity) and (b) absorption effects of the dust component on the emergent line intensities. Typical H II region abundance of the gas component has been taken into consideration. The overall structure of the cloud is defined by the parameters that provide the best fit to the continuum spectral energy distribution (see subsection 4.1). The first part of the calculations involve the pure gas inner shell and the emerging spectrum comprises of continuum as well as line emission. This emergent continuum from the inner shell provides the inner surface boundary condition for the second shell comprising of gas and dust. The line emission from the inner shell is transported outwards through extinction by the dust column in the second shell. Similarly, line emission originating from the second shell is transported considering the absorption effects of the dust grains lying between the emission zone and the outer surface of the second shell. The finally predicted emergent line luminosity includes both these components. A total of 27 spectral lines in the wavelength range m have been considered. To compare the predictions of the model with the spectral lines detected in the IRAS-LRS spectra of IRAS 10049-5657 and IRAS 10031-5632, we convolve the model predicted spectrum with IRAS-LRS instrument profile in the wavelength range 8-22 m. However, to show the complete spectrum for the wavelength range 2.5-200 m, the spectral lines have been convolved with ISO-SWS and LWS typical spectral resolutions of 1000 for m, 20000 for m, 8100 for m and 6800 for m while predicting the expected emergent spectrum.
4.3 IRAS 10049-5657
The SED for IRAS 10049-5657 is constructed using the flux densities in the two TIFR bands, the four IRAS bands (from HIRES maps), the IRAS-LRS data and the four MSX bands. The flux densities used in the SED are the fluxes integrated over a circular region of diameter around the peak. The total luminosity is L⊙ for a distance of 6.3 kpc. Fig. 12 (left) shows the observed SED and the predicted spectrum from the best fit model. This best fit model implies a uniform dust and gas density distribution with the embedded energy source as a single ZAMS star of type O5-O4 (see Table 2). The inner cloud dust radius is 0.008 pc while the outer cloud radius is 4.2 pc. The optical depth at 100 m is 0.002. The radius of the ionised gas from the model is 2.8 pc. The observed angular sizes are explained by this model. The measured radio flux density, Jy at 843 MHz is obtained by integrating within a circular region of 2.8 pc around the radio peak. This flux is quite high and cannot be explained by the model as the predicted radio flux from the model is 4 Jy for gas-to-dust ratio of 100:1 by mass. The dust composition for Si:Gr is 11:89 for the DL type of dust. The total dust mass is determined to be 12 M⊙.
The modelling of line emission for IRAS 10049-5657 has been carried out using the physical sizes obtained from the modelling of continuum emission. In all, 21 nebular/ionic lines satisfy our detectability criterion (power in the line be at least 1% of the power in the neighbouring continuum). The wavelengths and luminosities of these lines are presented in Table 3. The modelled spectrum, including the lines from the 10 elements considered as well as the continuum predicted by this model is shown in Fig. 12 (right).
We have looked for signatures of the ionic lines generally found in HII regions in the IRAS-LRS spectrum using a simple method. This method assumes the line signal to be present within data points, Dline, corresponding to one resolution element of LRS, centered at the expected line position. The local spectral baseline is estimated by interpolating (power law) data points in one resolution element each on both the red & blue sides of Dline. The estimated baseline is then subtracted from Dline to obtain the line emission. For IRAS 10049-5657, the ‘brighter’ lines: [Ne II] at 12.8 m, [Ne III] at 15.5 m, [S III] at 18.7 m and [Ar III] at 21.8 m are detected. The luminosities of these lines as well as the ratios of line-to-continuum are listed in Table 3.
We compare the luminosities as well as the ratios of line-to-continuum of the predicted lines from the model (convolved with IRAS-LRS instrument profile) with respect to those observed. The line-to-continuum ratios for the ‘LRS-convolved’ model are listed in Table 3. We find that the ratios of luminosities (model/observations) for the lines [Ne II], [Ne III] and [S III] agree within a factor of 4. For the [Ar III] line, we find that the observed value is times larger than the modelled value. However, it is to be noted that [Ar III] line is close to the edge of the wavelength range of the spectrometer and could have instrumental uncertainities. The lines [Ar III] at 9.0 m and [S IV] at 10.5 m are barely detected although the model predicts them to be bright.
4.4 IRAS 10031-5632
The SED for IRAS 10031-5632 has been constructed using flux densities (integrated over a circular region of diameter centred on the peak) from the MSX, IRAS-HIRES as well as the TIFR maps. The IRAS-LRS spectrum has also been used in the construction of the SED. The spectrum shows a strong silicate feature. For IRAS 10031-5632, the total luminosity is L⊙ (d kpc). We have used a single ZAMS star of spectral type O9 as the centrally exciting source. The best fit radiative transfer model along with the observed SED is shown in Fig. 13 (left), and the parameters of the best fit model are given in Table 2. This model implies a uniform density distribution of gas and dust. The optical depth at 100 m (from the model) is 0.07. The ratio of silicates and graphite dust grains is estimated to be 62:38. The radio flux predicted by the model at 843 MHz is 0.07 Jy for a gas-to-dust ratio of 100 by mass and radius of ionised region is 0.03 pc. This is comparable to the measured radio flux density of 0.04 Jy at 843 MHz (obtained by integrating the flux within a circular region of radius 0.03 pc centred on the radio peak). A dust mass of 24 is obtained from the model.
For IRAS 10031-5632, 17 nebular/ionic lines satisfy the detectability criterion. The luminosities of the lines as well as the ratio of luminosities of each line with respect to the continuum (for the model convolved with the LRS spectral resolution) are also listed in Table 4. Figure 13 (right) shows the emerging spectrum from the model. In addition, following the method in Sect. 4.3, we have searched for lines in the LRS spectrum of IRAS 10031-5632. The [Ne II] line at 12.8 m is clearly detected with a luminosity of 30 L⊙. Among the other lines in the range of LRS, we find that [Ar III] at 9.0 m and [S III] at 18.7 m also show detections. A comparison of the luminosites of the detected lines with the predicted values shows that the observed luminosities are much higher than the modelled ones. Table 4 also lists the ratio of line-to-continuum for these lines. A comparison of these ratios shows that the model ratios are a factor of lower than those observed. This can be attributed to the elevated level of the continuum from the model. A comparison of the model SED with the observed one in Fig. 13 (left) shows that the radiative transfer model in the mid infrared overestimates the observed LRS spectrum. Much larger discrepancies between the observed and predicted line emissions for IRAS 10031-5632, may be understood as follows. Our scheme for predicting the line emission utilizes the description of the cloud, which is obtained from modelling the continuum emission from the dust component distributed throughout the cloud. In contrast, emission of the specific ionic lines under discussion, viz., [S III], [Ne II] and [Ar III] are expected to originate from the innermost part of the H II region (due to high ionization potentials). In addition, the lower excitation of the central source (ZAMS O9) for this source, makes these line emissions more sensitive to the precise physical details (e.g. inhomogeneities like clumpiness) in the immediate vicinity of the star. Since the emission of forbidden lines depends on square of the local density, denser clumps in an inhomogeneous medium will show enhanced emission compared to an equivalent uniform medium. Hence, a clumpy medium around the exciting star in IRAS 10031-5632, could help explain the observed higher nebular line luminosities. This scenario is also consistent with the higher radio continuum emission observed.
5 Discussion
5.1 IRAS 10049-5657
Using the FIR map of IRAS 10049-5657 (Fig. 1), we see an extension of the dust emission towards north-east. This is also seen in the 60 and 100 emission IRAS-HIRES maps of this region, shown in Fig. 3. The IRAS-HIRES mid infrared emission from warm dust, however, shows an extension towards the west. This western extension is also clearly seen in the MSX maps. The flux densities from the TIFR maps at 150 and 210 have been used to compute the mass of dust using the formulation of Hildebrand (1983) and Sandell (2000). For a temperature of 30 K, the dust mass obtained is . As can be seen from Fig. 5, a north-east extension seen also in the cold dust emission is observed for the ionised gas also. The total flux of 42.4 Jy at 843 MHz can be compared with the flux density of 40 Jy (beam ) at 1410 MHz (Manchester, 1969).
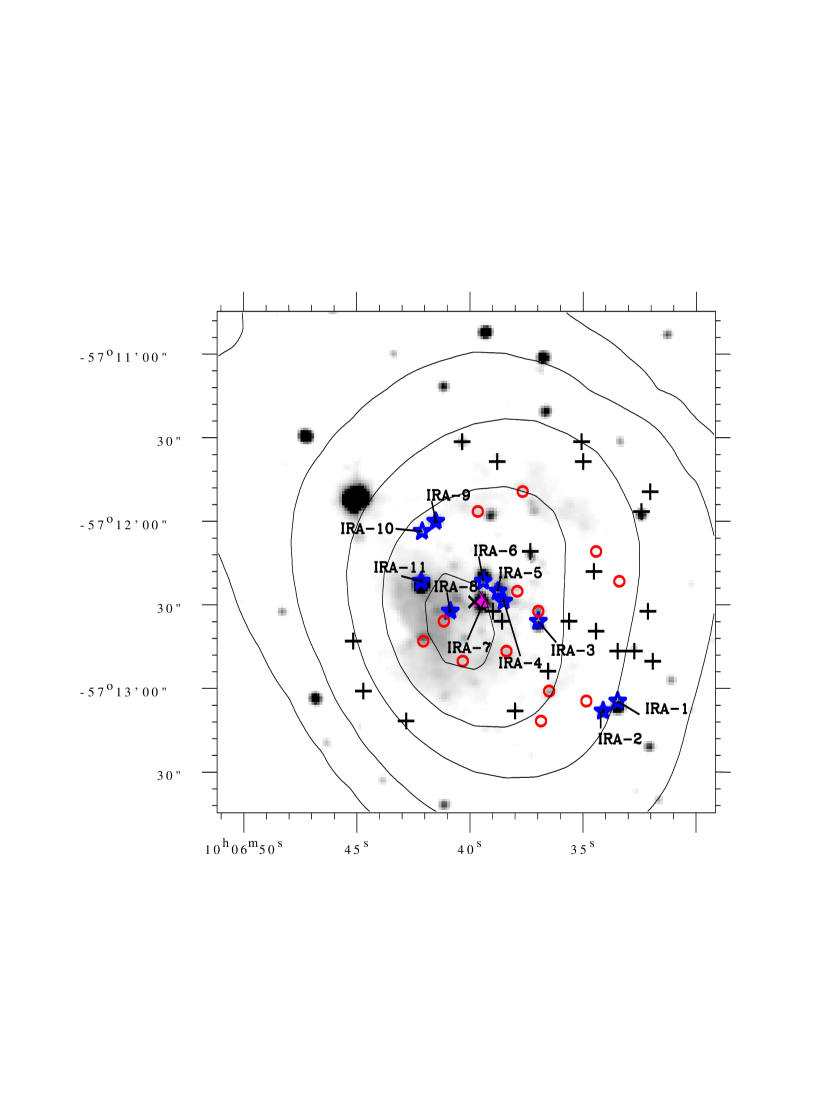
From the CM (J-H vs J) diagram of the 2MASS sources (Fig. 7 left) within the cluster radius (), we see that there are 11 sources lying above the ZAMS curve of O9. These 11 sources are designated as IRA-1, … , IRA-11 and a list of their positions and magnitudes is given in Table 5. However, it is important to note that the spectral types inferred from CM diagram are the earliest possible spectral type (upper limits) when the stars have infrared excess. Sources with infrared excess can be found from the CC (J-H vs H-K) diagram. In the CC diagram (see Fig. 7), 8 ‘asterisks’ lie in the band occupied by reddened ZAMS stars. One source, IRA-7 (shown as a triangle lying in the ‘T’ region), shows an infrared excess while IRA-10 lies to the left of the reddening band of the ZAMS objects (drawn from the top of the main sequence branch) in the CC diagram. The upper left part of the CC diagram is not an allowed region for young stellar objects (Lada & Adams, 1992). IRA-10 is faint in J band ( mag) with larger errors though it is relatively brighter in the H ( mag) and Ks () bands as compared to the J band. One possibility to explain the near infrared colours of IRA-10 as well as its position in the CC diagram is that IRA-10 could comprise two or more unresolved sources. The sources lying near the unreddened main sequence in the CC diagram are possibly foreground sources not associated with the cluster. A small but significant fraction of cluster stars lie outside and to the right of the reddening band of the ZAMS stars. These are mostly young stellar objects (YSOs) with intrinsic colour excess. Fourteen objects lie in this infrared excess zone, i.e. in the ‘T’ and ‘P’) regions. By dereddening the stars (on the CC diagram) that fall within the reddening vectors encompassing the main sequence stars, we find the visual extinction (AV) towards each star. The individual extinction values range from magnitudes. From the CM diagram, we find that the extinction values of most ‘asterisks’ lie at about magnitudes.
Figure 14 shows the 2MASS Ks-band image of the region around IRAS 10049-5647 in grayscale. The 2MASS image of this region shows diffuse emission apart from the sources (earlier than spectral type O9) clustered together. It is interesting to note the clustering of these sources close to the IRAS peak and the distribution of the other such stars in the NE-SW direction which is the direction of extension of the ionised gas as well as the cold dust. The morphology of emission in the UIB as well as the emission from warm dust in MSX bands also shows extension along the south-west direction. The brightest infrared source among the selected 2MASS sources is IRA-11. IRA-7 is closest () to the IRAS peak, is of spectral type earlier than O5 and has an infrared excess. This is consistent with the spectral type determined by Bik et al. (2005) for IRA-7 (referred to as 10049nr411 in their paper) using high resolution K-band spectra. They find that it is of spectral type O3-O4. Recent multi-epoch radial velocity measurements by Apai et al. (2007) show large amplitude variations in radial velocities pointing towards IRA-7 being a massive binary system (50 and 20 M⊙). Bik et al. (2005) have also carried out spectroscopy of IRA-3 (10049nr324) and find it to be of spectral type O3-O4/O5-O6. This is consistent with its ZAMS spectral type, O5-O6, obtained from the CM diagram. It is interesting to note that the ‘asterisk’ closest to the radio peak is IRA-8. The CM diagram indicates IRA-8 to be of ZAMS spectral type O9-O6.
We have also cross-correlated the MSX PSC sources with those from 2MASS PSC which lie within the cluster radius. There are 2 such MSX PSC sources namely G282.0341-01.1810 and G282.0176-01.1793 (hereafter M1 and M2, respectively; listed in Table 6). M1 coincides () with an infrared excess source, 2MASS-J10064115-5712377 (J, H, K). M2 coincides () with a source detected only in Ks band, 2MASS-J10063592-5711563 (K mag). From the 2MASS-MSX colour-colour diagram ( vs ; Lumsden et al. 2002, their Fig. 9), we find that these sources lie in the region generally covered by compact H II regions and massive young stellar objects. We can, therefore, conclude that these are young stars associated with the cluster.
5.2 IRAS 10031-5632
The dust emission around IRAS 10031-5632 is compact (unresolved) at 150 m, as well as at the IRAS-HIRES wavebands. IRAS 10031-5632 is not resolved in the SUMSS radio map also. However, IRAS 10031-5632 is barely resolved in the 210 m map. Deconvolving the beam from 210 m image gives us as an estimate of its size. The dust mass obtained using the flux density at 210 from the TIFR map is for a temperature of 30 K. However, from the radiative transfer modelling, we obtain a larger dust mass of 24 . The total radio flux density is 1.1 Jy. Considering that the radio flux is from a single ionising ZAMS star, we use the formulation of Schraml & Mezger (1969) and Panagia (1973) to estimate its spectral type. We find it to be of ZAMS spectral type O9-O8.5. This can be compared with the ZAMS spectral type of O9 obtained from the FIR luminosity.
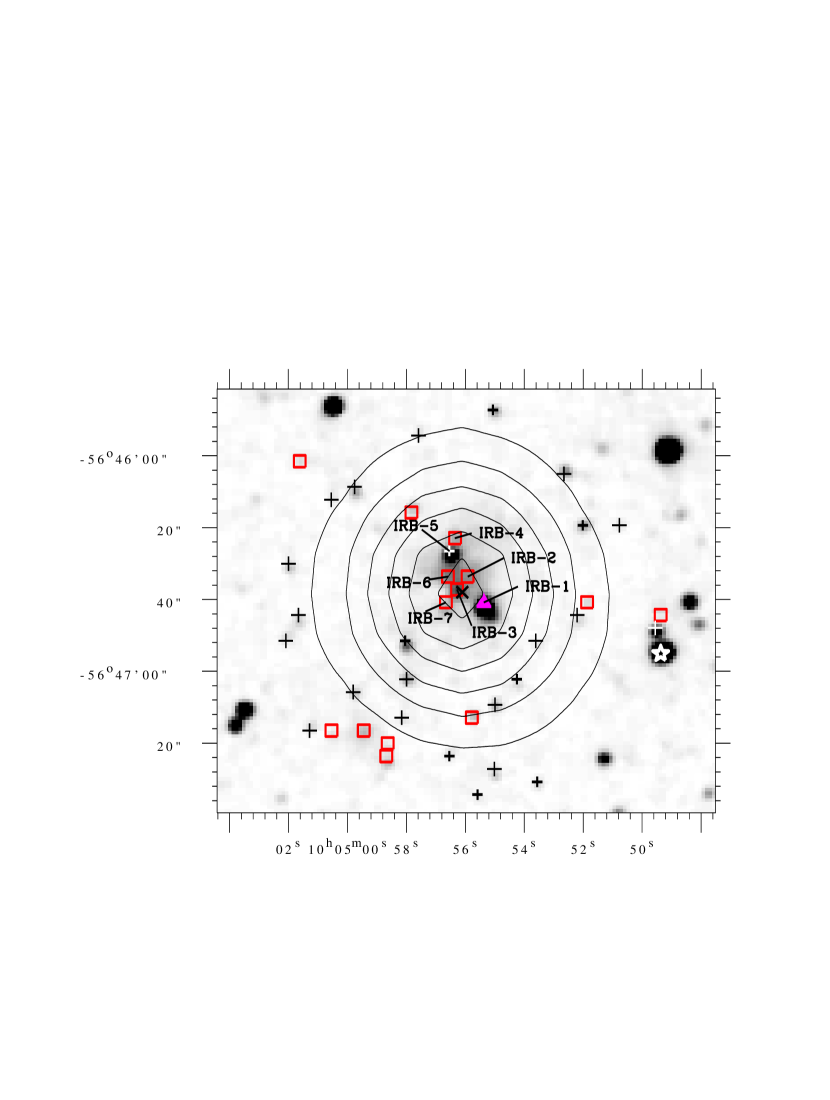
Unlike the case of IRAS 10049-5657, we do not see a rich cluster with a large number of stars around IRAS 10031-5632. Rather a small group comprising of a few stars is seen close to this region. There are seven sources (labelled as IRB-1 to IRB-7) clustered close to the FIR (IRAS) peak; of which two, IRB-1 and IRB-5, are detected in all the three (J, H and Ks) bands. The 2MASS designation and flux details of these sources are given Table 7. From the CM diagram (H-K vs K; Fig. 11 left), it is observed that IRB-1 is of ZAMS spectral type earlier than O5. It is to be noted that this spectral type of IRB-1 obtained from NIR study is the earlier possible spectral type (upper limit) as it shows an infrared excess. IRB-5 is however of later spectral type, B3-B2. It lies among a well-defined group of stellar sources which have lower extinction values (A mag). From the CC diagram (J-H vs H-K), it is found to lie near the main-sequence curve. It is therefore possible that IRB-5 is not associated with the cluster but is a foreground source. The other five sources are detected in H and Ks or only in Ks bands. The source closest () to the IRAS peak, IRB-3, is detected in H ( mag) and Ks ( mag) bands but not detected in the J band. From the CM diagram, it is found that IRB-3 is a heavily extincted early spectral type (O9-O6) ZAMS star. It is located at the peak of 843 MHz radio emission. The other four sources IRB-2, IRB-4, IRB-6 and IRB-7 are detected only in Ks band. This implies that these are deeply embedded objects. Thus, among the small number of cluster members, the majority of them are deeply embedded indicating that the star formation here is in an early stage. The 2MASS image of the region around IRAS 10031-5632 is shown in Fig. 15. The sources lying above the ZAMS curve of spectral type O9 are shown as asterisk symbols while the ‘asterisk’ having an infrared excess is shown as a solid triangle. The open squares represent sources detected either in H and Ks bands or only in Ks band. The other sources are represented with plus-symbols. The seven sources discussed above are labelled as “IRB” in the figure. It is interesting to note the presence of young objects (detected in H and Ks or only Ks bands) clustered near the IRAS peak.
In the IRAS 10031-5632 region, we find that there is 1 MSX PSC source within radius centered on the IRAS peak, G281.5857-00.9706 (designated as M3 and listed in Table 6). M3 could possibly be associated with either IRB-3 () or IRB-2 (). In both the cases, we obtain the 2MASS-MSX colours ( and , Lumsden et al. 2002) and observe that M3 lies in the general region covered by compact H II regions.
6 Summary
The massive star forming regions associated with IRAS 10049-5657 and IRAS 10031-5632 have been studied using the infrared (near, mid and far) wavebands. The dust and gas environments as well as the stellar sources have been probed using data from TIFR balloon-borne telescope, MSX, SUMSS and 2MASS. The spatial distributions of far infrared emission from cold dust at 150 and 210 m have been obtained alongwith maps of optical depth () and colour temperature, T(150/210), Using MSX data, the emission from warm dust and UIBs in the IRAS 10049-5657 region has been studied. IRAS 10049-5657 region shows the presence of a rich cluster of OB stars which gives rise to strong radio continuum ( Jy at 843 MHz). The cluster radius is estimated to be and within the cluster radius, there are 11 2MASS sources lying above the ZAMS curve of spectral type O9, designated IRA-1 to IRA-11. One source, IRA-7 also has an infrared excess and is located closest to the IRAS peak. It is a massive star of early spectral type, earlier than O5 consistent with earlier studies. Unlike IRAS 10049-5657, the star forming region associated with IRAS 10031-5632, comprises of a very compact group of stars. The SUMSS radio flux at 843 MHz predicts a radio spectral type of O9-O8.5. The sources clustered near the IRAS peak comprise of young sources detected in H and Ks or only Ks bands. The 2MASS source detected in all the three bands, designated IRB-1, has an infrared excess and is found to be of ZAMS spectral type earlier than O5 from the 2MASS colour-magnitude diagram. Self-consistent radiative transfer modelling constrained by observations have been carried out for both these sources. The geometric details of the clouds, the dust-composition and optical depths, etc have been obtained from the best fit models. We have also carried out modelling of line emission from IRAS 10049-5657 and IRAS 10031-5632 using a scheme based on CLOUDY. The predictions of the model for emission in the ionic lines are closer to LRS detections for IRAS 10049-5657 than for IRAS 10031-5632. We speculate that for IRAS 10031-5632, some of the basic assumptions of the modelling scheme are not valid.
Acknowledgments
We thank the anonymous referee for useful suggestions that improved the paper. It is a pleasure to thank the members of the Infrared Astronomy Group at TIFR for their support during laboratory tests and balloon flight campaigns. All members of the Balloon Group and Control Instrumentation Group of the TIFR Balloon Facility, Hyderabad, are thanked for their technical support during the flight. We thank IPAC, Caltech, for providing us the HIRES-processed IRAS products.
References
- (1) Apai, D., Bik, A., Kaper, L., Henning, T. & Zinnecker, H. 2007, ApJ, 655, 484
- (2) Aumann, H. H., Fowler, J. W. & Melnyk, M. 1990, AJ, 99, 1674
- (3) Bessel, M. S. & Brett, J. M. 1988, PASP, 100, 1134
- (4) Bik, A., Kaper, L., Hanson, M. M. & Smits, M. 2005, A&A, 440, 121
- (5) Blum, R. D., Damineli, A. & Conti, P. S. 2001, AJ, 121, 3149
- (6) Bock, D. C., Large, M. I. & Sadler, E. M. 1999, AJ, 117, 1578
- (7) Braz, M. A. Gregorio Hetem, J. C., Scalise, E., Jr., Monteiro Do Vale, J. L. & Gaylard, M. 1989, A&AS, 77, 465
- (8) Bronfman, L., Nyman, L.-A. & May, J. 1996, A&AS, 115, 81
- (9) Caswell, J. L. & Haynes, R. F. 1987, A&A, 171, 261
- (10) Cohen, R. J., Masheder, M. R. W. & Caswell, J. L. 1995, MNRAS, 274, 808
- (11) Conti, P. S. & Crowther, P. A. 2004, MNRAS, 355, 899
- (12) de Muizon, J. M., D’Hendecourt, L. B. & Geballe, T. R. 1990, A&A, 235, 367
- (13) Draine, B. T. & Lee, H. M. 1984, ApJ, 285, 89
- (14) Egan, M. P., Price, S. D., Kraemer, et al. 2003, Air Force Research Laboratory Technical Report, AFRL-VS-TR-2003-1589
- (15) Gardner, F. F. & Whiteoak, J. B. 1984, MNRAS, 210, 23
- (16) Ghosh, S. K., Iyengar, K. V. K., Rengarajan, T. N., Tandon, S. N., Verma, R. P. & Daniel, R. R. 1988, ApJ, 330, 928
- (17) Ghosh, S. K., Mookerjea, B., Rengarajan, T. N., Tandon, S. N. & Verma, R. P. 2000, A&A, 363, 744
- (18) Ghosh, S. K. & Ojha, D. K. 2002, A&A, 288, 326
- (19) Gull, S. F. & Daniell, G. J. 1978, Nature, 272, 686
- (20) Hanson, M. M., Kaper, L., Bik, A. et al. 2003, IAUS, 212, 467
- (21) Hildebrand, R. H. 1983, QJRAS, 24, 267
- (22) Hill, E. R. 1968, AuJP, 21, 746
- (23) IRAS Science Team, 1986, A&AS, 65, 607
- (24) Karnik, A. D., Ghosh, S. K., Rengarajan, T. N. & Verma, R. P. 2001, MNRAS, 326, 293
- (25) Kuchar, T. A. & Clark, F. O. 1997, ApJ, 488, 224
- (26) Lada, C. J. & Adams, F. C. 1992, ApJ, 393, 278
- (27) Lumsden, S. L., Hoare, M. G., Oudmaijer, R. D. & Richards, D. 2002, MNRAS, 336, 621
- (28) Manchester, B. A. 1969, AuJP, 12, 13
- (29) Meyer, M. R., Calvet, N. & Hillenbrand, L. A. 1997, AJ, 114, 288
- (30) Mezger, P. G., Mathis, J. S. & Panagia, N. 1982, A&A, 105, 372
- (31) Mookerjea, B. & Ghosh, S. K. 1999, J. Astrophys. Astr. 20, 1
- (32) Ojha, D. K., Ghosh, S. K. & Verma R. P. 2002, Bulletin of Astronomical Society of India, 30, 647
- (33) Ojha, D.K., Tamura, M., Nakajima, Y. et al. 2004, ApJ, 608, 797
- (34) Panagia, N. 1973, AJ, 78, 929
- (35) Peng, R. S. & Whiteoak, J. B. 1992, MNRAS, 254, 301
- (36) Price, S. D., Egan, M. P., Carey, S. J., Mizuno, D. R., & Kuchar, T. A. 2001, AJ, 121, 2819
- (37) Puchalla, J. L., Caldwell, R., Cruz, K. L., Devlin, M. J., Dorwart, W. B., et al. 2002, AJ, 123, 1978
- (38) Rieke, G. H. & Lebofsky, M. J. 1985, ApJ, 288, 618
- (39) Sandell, G. 2000, A&A, 358, 242
- (40) Schutte, A. J., van der Walt, D. J., Gaylard, M. J. & MacLeod, G. C. 1993, MNRAS, 261, 783
- (41) Schraml, J. & Mezger, P. G. 1969, ApJ, 156, 269
- (42) Simpson, J. P. & Rubin, R. H. 1990, ApJ, 354, 165
- (43) Verma, R. P., Bisht, R. S., Ghosh, S. K. et al. 1994, A&A, 284, 936
- (44) Vig, S., Ghosh, S. K., Ojha, D. K. & Verma, R. P. 2007, A&A, 463, 175
- (45) Vilas-Boas, J. & Abraham, Z. 2000, A&A, 355, 1115
- (46) Volk, K. & Cohen, M. 1989, AJ, 98, 931
- (47) Whiteoak, J. B. & Gardner, F. F. 1974, A&A, 37, 389
- (48) Whiteoak, J. B., Otrupcek, R. E., Rennie, C. J. 1982, PASAu, 4, 434
- (49) Zavagno, A., Cox, P. & Baluteau, J. -P. 1992, A&A, 259, 241
| IRAS PSC | Flux Density (Jy) for () | |||||||||
|---|---|---|---|---|---|---|---|---|---|---|
| Source | TIFR imagesa | IRAS-HIRES imagesa | MSX imagesa | |||||||
| IRAS PSC | ||||||||||
| 210 | 150 | 100 | 60 | 25 | 12 | 21.3 | 14.7 | 12.1 | 8.3 | |
| 10049-5657 | 1147 | 2534 | 6224 | 8901 | 2166 | 368 | 1486 | 642 | 373 | 120 |
| 7023 | 6146 | 780 | 148 | |||||||
| 10031-5632 | 679 | 1405 | 1574 | 1381 | 215 | 25 | 126 | 23 | 22 | 15 |
| 1512 | 1166 | 209 | 168 | |||||||
a Fluxes obtained by integrating over a circular region of diameter centred on the peak.
| Source | La | Dust | Composition | Mdust | |||||
|---|---|---|---|---|---|---|---|---|---|
| IRAS | (pc) | (pc) | (pc) | (105 ) | Type | Silicate:Graphite | () | ||
| 10049-5657 | 0.0 | 4.2 | 0.009 | 2.8 | 0.002 | 10 | DL | 11:89 | 12 |
| 10031-5632 | 0.0 | 1.0 | 0.007 | 0.03 | 0.07 | 0.42 | DL | 62:38 | 24 |
a Luminosity of single ZAMS star used in the model
| Model | Observed (LRS) | ||||
| Element | Wavelength | Luminosity | Luminosity | ||
| Ionisation Stage | (m) | () | () | ||
| C II | 157.78 | 71.54 | - | - | |
| O I | 145.63 | 1.21 | - | - | |
| N II | 121.84 | 19.53 | - | - | |
| O III | 88.42 | 2577.02 | - | - | |
| O I | 63.23 | 13.50 | - | - | |
| N III | 57.26 | 772.85 | - | - | |
| O III | 51.85 | 2924.28 | - | - | |
| Ne III | 36.04 | 89.82 | - | - | |
| Si II | 34.84 | 87.99 | - | - | |
| S III | 33.50 | 1052.20 | - | - | |
| O IV | 25.91 | 114.36 | - | - | |
| Ar III | 21.84 | 20.60 | 0.002 | 263 | 0.04 |
| S III | 18.69 | 765.01 | 0.08 | 300 | 0.03 |
| Ne III | 15.57 | 994.78 | 0.15 | 386 | 0.04 |
| Ar V | 13.11 | 1.02 | 0.001 | - | - |
| Ne II | 12.82 | 62.14 | 0.03 | 250 | 0.06 |
| S IV | 10.52 | 1101.83 | 0.35 | 35 | 0.01 |
| Ar III | 8.99 | 289.82 | 0.10 | - | - |
| Ar V | 7.91 | 0.63 | - | - | |
| Ar II | 7.00 | 9.82 | - | - | |
| Ar VI | 4.53 | 0.21 | - | - | |
| Model | Observed (LRS) | ||||
| Element | Wavelength | Luminosity | Luminosity | ||
| Ionisation Stage | (m) | () | () | ||
| C II | 157.78 | 0.31 | - | - | |
| O I | 145.63 | 0.09 | - | - | |
| N II | 121.84 | 0.01 | - | - | |
| O III | 88.42 | 0.40 | - | - | |
| O I | 63.23 | 0.56 | - | - | |
| N III | 57.26 | 0.36 | - | - | |
| O III | 51.85 | 2.90 | - | - | |
| Ne III | 36.04 | 0.33 | - | - | |
| Si II | 34.84 | 0.08 | - | - | |
| S III | 33.50 | 0.53 | - | - | |
| Ar III | 21.84 | 0.10 | 0.0002 | - | - |
| S III | 18.69 | 1.76 | 0.0025 | 16.6 | 0.07 |
| Ne III | 15.57 | 3.13 | 0.004 | - | - |
| Ne II | 12.82 | 1.61 | 0.005 | 30 | 0.5 |
| S IV | 10.52 | 0.27 | 0.0006 | - | - |
| Ar III | 8.99 | 0.40 | 0.0009 | 9.3 | 0.12 |
| Ar II | 7.00 | 0.17 | - | - | |
| 2MASS PSC | Namea | J | H | Ks | ||
|---|---|---|---|---|---|---|
| designation | (deg) | (deg) | (mag) | (mag) | (mag) | |
| J10063343-5713064 | IRA-1 | 151.639294 | -57.218468 | |||
| J10063408-5713079 | IRA-2 | 151.642008 | -57.218887 | |||
| J10063696-5712372 | IRA-3 | 151.654013 | -57.210342 | |||
| J10063849-5712287 | IRA-4 | 151.660405 | -57.207985 | |||
| J10063875-5712243 | IRA-5 | 151.661484 | -57.206776 | |||
| J10063940-5712198 | IRA-6 | 151.664190 | -57.205513 | |||
| J10063949-5712299 | IRA-7 | 151.664564 | -57.208324 | |||
| J10064088-5712327 | IRA-8 | 151.670346 | -57.209087 | |||
| J10064153-5712003 | IRA-9 | 151.673054 | -57.200096 | |||
| J10064211-5712041 | IRA-10 | 151.675482 | -57.201160 | |||
| J10064217-5712231 | IRA-11 | 151.675725 | -57.206444 |
a Short name used in the present work
| IRAS | MSX PSC | Namea | ||||||
|---|---|---|---|---|---|---|---|---|
| Association | designation | (deg) | (deg) | (Jy) | (Jy) | (Jy) | (Jy) | |
| IRAS 10049-5657 | G282.0341-01.1810 | M1 | 151.6721 | -57.2105 | ||||
| IRAS 10049-5657 | G282.0176-01.1793 | M2 | 151.6493 | -57.1995 | ||||
| IRAS 10031-5632 | G281.5857-00.9706 | M3 | 151.2342 | -56.7765 |
a Short name used in the present work
| 2MASS PSC | Namea | J | H | Ks | ||
|---|---|---|---|---|---|---|
| designation | (deg) | (deg) | (mag) | (mag) | (mag) | |
| J10045536-5646422 | IRB-1 | 151.230694 | -56.778397 | |||
| J10045591-5646340 | IRB-2 | 151.232992 | -56.776119 | |||
| J10045627-5646381 | IRB-3 | 151.234494 | -56.777267 | |||
| J10045634-5646226 | IRB-4 | 151.234762 | -56.772972 | |||
| J10045653-5646275 | IRB-5 | 151.235575 | -56.774307 | |||
| J10045658-5646324 | IRB-6 | 151.235780 | -56.775673 | |||
| J10045666-5646424 | IRB-7 | 151.236113 | -56.778446 |
a Short name used in the present work