Wavelength Shifters for Water Cherenkov Detectors
Abstract
The light yield of a water-based Cherenkov detector can be significantly improved by adding a wavelength shifter. Wavelength shifter (WLS) molecules absorb ultraviolet photons and re-emit them at longer wavelengths where typical photomultiplier tubes are more sensitive. In this study, several wavelength shifter compounds are tested for possible deployment in the Sudbury Neutrino Observatory (SNO). Test results on optical properties and chemical compatibility for a few WLS candidates are reported; together with timing and gain measurements. A Monte Carlo simulation of the SNO detector response is used to estimate the total light gain with WLS. Finally, a cosmic ray Cherenkov detector was built to investigate the optical properties of WLS.
keywords:
wavelength shifter , water Cherenkov detector , solar neutrino , SNOPACS:
29.50.-n , 26.65.+t , 81.20.Ymand
1 Introduction
The Sudbury Neutrino Observatory (SNO) [1] is a heavy water Cherenkov detector located at a depth of 2010 m in INCO’s Creighton Mine near Sudbury, Canada. The detector uses 1000 tonnes of ultrapure heavy water as a target material contained in a 12 m diameter acrylic sphere to detect solar neutrinos. An array of 9500 photomultiplier tubes (PMTs), mounted on a 17.8 m diameter stainless-steel geodesic support structure which is immersed in 7000 tonnes of shielding light water, is used to observe Cherenkov photons produced in the D2O region. In recent studies, the SNO collaboration has provided strong evidence that neutrinos change flavor as they travel from the Sun to Earth [2, 3, 4, 5, 6], independently of solar model flux predictions.
Wavelength shifters are generally fluorescent organic chemicals containing polyaromatic hydrocarbons or heterocycles in their molecules which absorb photons and re-emit them at longer wavelengths. Previous studies have shown that adding WLS into Cherenkov detectors increases the amount of detected light by a factor of 1.2 using amino G [7] and by a factor of 3 using umbelliferone [8].
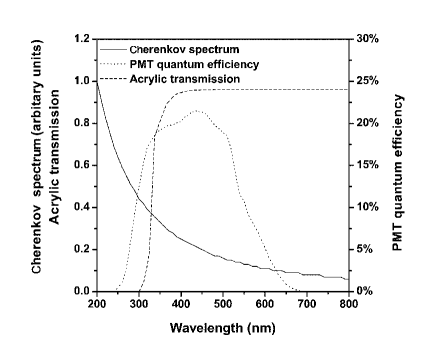
Fig. 1 illustrates why the use of a wavelength shifter is attractive for increasing the light yield in the SNO detector. The Cherenkov light production rises strongly in the violet end of the spectrum but this light is lost due to attenuation in 5.5 cm of acrylic at normal incidence. The addition of WLS in the D2O can boost the Cherenkov signal without changing the background photons from outside the D2O region. This should significantly increase the detector efficiency and improve the energy resolution of SNO which would allow for a better sensitivity of the detector to spectral distortions caused by neutrino interactions with matter in the core of the Sun. In this paper, we studied the viability to introduce WLS in the SNO detector. Initially, the chemical and optical properties of several WLS candidates were tested. Subsequently, a detailed simulation of the SNO experiment was performed and a WLS cosmic ray telescope was designed to check the response to Cherenkov radiation. Even though it was subsequently decided that no WLS would be used for a future phase of the SNO experiment, we believe the new water based wavelength shifters that have been found in this study may be useful for some future Cherenkov detectors and other applications.
2 Properties of wavelength shifters
To meet the many requirements for the safe and reliable operation of the SNO detector, a desirable WLS should have the following characteristics: (1) soluble and stable in water; (2) removable from heavy water as the SNO D2O has been loaned by Atomic Energy of Canada Limited (AECL) and it should be returned additive-free at the end of the SNO experimental program; (3) no adverse interaction with the materials used in the detector and water circulation system, including acrylic, polypropylene, and MnOx beads [9] and HTiO absorbent [10], which are used for the radium assays of the heavy water; (4) high absorbency below 350 nm, and high re-emission probability in the range of 350-500 nm with a high quantum efficiency in the neutral pH range, with no significant overlap between the excitation and emission regions; (5) to achieve the best light gain, the emission spectrum should match, as closely as possible, the optimal PMT sensitive region (see Fig. 1); (6) short fluorescence decay time (a few nanoseconds), as the longer re-emission time would potentially incorporate trigger ambiguity and could also increase the uncertainty in the reconstructed position of the event.
Five water-soluble WLS compounds were initially tested according to the above criteria. They included four coumarin derivatives (7-hydroxy-4-methylcoumarin, 7-hydroxy-4-methylcoumarin-3-acetic acid, 7-hydroxycoumarin-3-carboxylic acid, and Alexa Fluor 350, all commercially available at Molecular Probes) and one carbostyril (carbostyril 124, purchased from Sigma-Alderich Co.). The results are described as follows.
2.1 Measurements of optical properties
The results of the optical measurements for all the wavelength shifters are summarized in Table 1. Alexa Fluor 350 (AF350) and carbostyril 124 (CS124) are pH-insensitive in the neutral pH range, whereas the other three coumarin derivatives show an obvious pH dependence and their absorption shifts to longer wavelengths as the pH values increase from 5 to 11. The pH-sensitive coumarins would not be fully deprotonated, and thus would not be very efficient in converting ultraviolet photons, until their pH values rise to above 9. The pH value of the SNO heavy water is 7. Consequently, a large amount of buffer needs be added into the detector to alter the water pH if a pH-sensitive WLS is chosen. This is not practical as it would introduce unnecessary materials and greatly increase the risk of contamination.
| 7-hydroxy-4- | Alexa | 7-hydroxy-4-methyl | carbostyril | 7-hydroxycoumarin- | |||||||||||||
| methylcoumarin | Fluor 350 | coumarin-3-acetic acid | 124 | 3-carboxylic acid | |||||||||||||
| pH | 5 | 8 | 9 | 10 | 11 | 5-9 | 5 | 8 | 9 | 10 | 11 | 5-9 | 5 | 8 | 9 | 10 | 11 |
| Maximum Absorption | |||||||||||||||||
| (nm) | 320 | 336 | 362 | 360 | 360 | 340 | 324 | 326 | 360 | 360 | 360 | 340 | 336 | 386 | 386 | 386 | 386 |
| (104 L/mol/cm) | 1.4 | 1.1 | 1.6 | 1.8 | 1.8 | 2.0 | 1.5 | 1.3 | 1.7 | 1.8 | 1.8 | 1.6 | 1.0 | 1.1 | 3.2 | 3.3 | 3.3 |
| Maximum Emission | |||||||||||||||||
| (nm) | 450 | 450 | 447 | 449 | 450 | 443 | 458 | 455 | 455 | 455 | 455 | 417 | 446 | 446 | 446 | 446 | 446 |
| Quantum Efficiency | 78% | 78% | 87% | 86% | 87% | 92% | 80% | 78% | 82% | 82% | 84% | 97% | 52% | 70% | 89% | 85% | 79% |
| Fluorescence lifetime (ns) | 7.0 | - | - | 6.7 | - | 5.6 | 6.5 | - | - | 6.4 | - | 6.2 | 4.6 | - | - | 4.8 | - |
: maximum absorption wavelength;
: molar absorptivity at maximum absorption wavelength;
: maximum emission wavelength.
2.1.1 Stability tests of WLS solution
The stability tests on the WLS solutions were performed by examining the changes of UV/VIS absorption and fluorescence excitation/emission over several months of storage in glass vials in the dark. Two pH-insensitive 1.0 ppm WLS (CS124 and AF350) solutions were tested, and no significant optical change was observed at neutral pH condition over a period of more than 6 months.
The solutions of three pH-sensitive coumarins were also tested in UPW at a pH of 5 and in phosphate buffers at a pH of 9. Obvious decreases were found in the emission intensities of 7-hydroxy-4-methylcoumarin-3-acetic acid both at pH of 5 and 9, and in UV/VIS absorption intensities of 7-hydroxycoumarin-3-carboxylic acid at a pH of 9 within two months, indicating a lifetime much shorter than what is required for the SNO experiment. Therefore, the pH-sensitive coumarins are not good candidates for the SNO experiment. In the following sections, discussion will be mainly focused on the two pH-insensitive compounds AF350 and CS124.
2.1.2 Absorption and fluorescence emission spectra
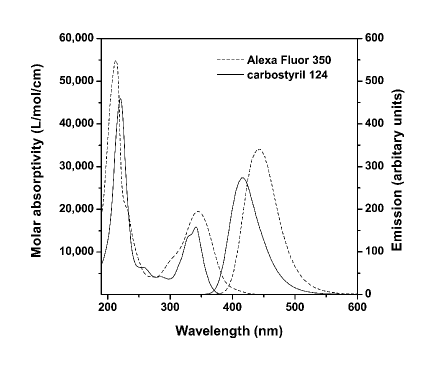
The absorption and fluorescence emission spectra were measured using a Perkin Elmer Lambda 800 ultraviolet and visible (UV/VIS) spectrometer and a Cary Eclipse fluorescence spectrophotometer made by Varian. Samples were tested in 1-cm quartz cuvettes using ultrapure water (UPW) as a blank. As seen in Fig. 2, both AF350 and CS124 show strong light absorption below 350 nm and re-emission in the region of 350-500 nm. At a concentration of 1 g/g (ppm), the attenuation lengths for AF350 and CS124 are respectively 9.3 and 4.8 cm at 340 nm. However, CS124 seems to be a better choice for the SNO experiment as its absorption and re-emission spectra closely match the response region of the detector. The presence of absorption at a wavelength higher than 350 nm for AF350 would lead to unnecessary conversion of Cherenkov photons in the detectable wavelength range.
2.1.3 Quantum efficiency measurements
The quantum efficiency measurements were done by following the Parker-Reas method [11, 12], which compares the spectral yields of the WLS solutions to those of standard fluorescence solutions, in our case quinine sulfate in 0.5 mol/L (quantum efficiency 54% [13]) and harmane in 0.1 mol/L (quantum efficiency 83% [14]). The quantum efficiencies for both AF350 and CS124 are higher than 90% (see Table 1) with an estimated uncertainty of less than 10%.
2.1.4 Fluorescence lifetime measurements
The fluorescence lifetime measurements were carried out using a TimeMaster Laser-based Fluorescence Lifetime Spectrometer made by Photon Technology International. As shown in Table 1, the lifetimes are 5.6 ns for AF350 and 6.2 ns for CS124 with an uncertainty of 5%. Both are sufficiently short to meet the reconstruction requirements of the SNO experiment.
2.2 Chemical compatibility and removal tests
The tests of chemical compatibility of the WLS with acrylic were done by immersing 410.5 cm3 of acrylic pieces in 25 ml of the WLS solutions and examining their optical changes on an approximately biweekly basis over three months. No obvious variations have been seen for any of the five WLS solutions, suggesting that the loss of WLS on the wall of acrylic vessel or the interaction of WLS with acrylic should not be an issue in selection of a candidate.
The impact of the WLS on the two SNO radium assay techniques [9] [10] was also studied. Small-scale tests were carried out by passing 1 ppm of WLS solutions through a small plastic column filled with MnOx beads or a small syringe filter loaded with HTiO absorbent, and the optical properties of the feed and permeate were measured. All the three pH-sensitive coumarins show an obvious accumulation and interaction with the MnOx beads and HTiO absorbent, whereas no change was observed for AF350 or CS124. This indicates that addition of AF350 or CS124 would not affect the SNO Ra assay techniques.
The Biobeads and activated charcoal used in Milli-Q water systems were tested to extract the WLS compounds from water. Small scale experiments showed that a reduction factor of about 1000 could be achievable for the removal of 1.0 ppm WLS from 1000 tonnes of heavy water with activated charcoal at an equivalent flow rate of 10 l/(min m2) in a single pass. Therefore, it would be feasible to remove the WLS from the SNO detector after completion of the experiment.
3 Monte Carlo simulation for SNO
A detailed Monte Carlo simulation was performed using the SNO software (SNOMAN) to account for the full light propagation and attenuation, together with the complete geometrical acceptance and detector response. EGS4 [15] is used in SNOMAN to provide accurate propagation of electromagnetic showers. The light and heavy water attenuations were set and extrapolated in the range of 180-620 nm according to the measurements of Ref. [16]. The WLS absorption spectrum, quantum efficiency, and wavelength of the re-emission peak were parameterized in order to simulate the interaction between photons and WLS molecules. For each simulation, SNOMAN interpolated the absorption spectrum of Fig. 2 with a fifteen-point piecewise-linear function. It also assumed a Gaussian distribution for the re-emission wavelength spectrum using the experimentally measured mean and width. According to the measurements of Section 2.1.4, the fluorescence lifetimes were assumed to be 5.6 ns and 6.2 ns for AF350 and CS124, respectively, and the WLS light was emitted isotropically. Furthermore, SNOMAN used the WLS concentration to scale the absorption coefficient accordingly.
The simulations were performed in order to determine the gain of light as a function of the concentration of WLS. The concentration values were chosen in the range 0.01 to 10 ppm based on the mean free path of ultraviolet photons in the detector. A high concentration maximizes the number of photons converted and reduces the uncertainty in the event position by shortening their mean free path. On the other hand, it is important to minimize the quantity of WLS for obvious financial reasons and an over-saturation of WLS could result in possible self-absorption cycles when there is an overlap between the excitation and emission regions.
| Concentration | Gain | Gain | Mean Free Path |
|---|---|---|---|
| (ppm) | AF350 | CS124 | approx. (cm) |
| 0.01 | 1.4 | 1.6 | 1000 |
| 0.05 | 2.0 | 2.4 | 200 |
| 0.10 | 2.3 | 2.6 | 100 |
| 0.50 | 2.7 | 3.0 | 20 |
| 1.00 | 2.8 | 3.0 | 10 |
| 5.00 | 2.9 | 3.0 | 2 |
| 10.00 | 2.9 | 3.1 | 1 |
The simulation procedure was straightforward: 10,000 electrons with an energy of 10 MeV were generated isotropically inside the heavy water. The gain is defined as the ratio of the mean of the number of PMT hits with and without WLS. The gain and the mean free path of Cherenkov light in a WLS solution are shown in Table 2 for different WLS concentrations. At concentration above 0.50 ppm, there was a saturation plateau in the number of detected photons. Therefore, there is no significant advantage in choosing a higher concentration in terms of the number of PMT hits. However, in order to keep the spatial resolution at a reasonable level and bring the absorption mean free path below 10 cm, the concentration should be higher or equal to 1 ppm. At a few ppm, the light gain from the Monte Carlo simulation is estimated to be 2.9 and 3.0 for the AF350 and CS124, respectively.
Finally, the energy thresholds with and without WLS were identified by simulating SNO data in the pure D2O configuration. The simulation incorporated both the solar neutrino signal events and all internal and external low energy backgrounds. In principle, adding a wavelength shifter could allow processes whereby particles below the Cherenkov threshold produce light through direct excitation of the wavelength shifter. In a good scintillator, the production of light is typically 30,000 photons per MeV of incident energy. At a concentration of a few ppm, we concluded that this is not likely to produce more than a few photons and neglected this effect, even for the naturally occurring alpha particles of several MeV. The result showed a clear shift in the mean number of PMT hit recorded for a typical Cherenkov event. At a given statistical significance of the signal over the background for a 5 MeV analysis threshold without WLS [3, 4], the addition of 1 ppm of WLS would allow for a 3.7 MeV low energy threshold.
4 WLS Cosmic Ray Telescope
In order to test the WLS compounds in an actual experiment, an apparatus was built that uses cosmic rays as the source of Cherenkov light. The telescope allows a direct comparison between the Cherenkov light produced by cosmic rays and the WLS light.
4.1 Design of the apparatus
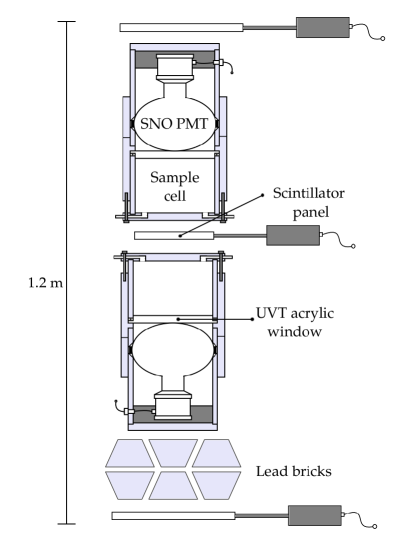
Two cylindrical barrels made from polyvinylchloride (PVC) are placed one above the other allowing a vertical cosmic ray to go through both, as shown in Fig. 3. Three scintillator panels placed on the top, the center and the bottom of the apparatus are used in coincidence to trigger a cosmic ray event. The top and bottom scintillator panels have larger diameters (30 cm) to maximize the trigger rate, while the middle one is smaller (20 cm) to ensure fully contained events. Two layers of lead bricks with a total thickness of 20 cm are placed above the bottom scintillator panel to eliminate the soft component of the cosmic ray shower in the data. The two barrels are identical in size, with a height of 42.5 cm and a diameter of 22.9 cm. They both contain a hermetic sample cell that can either be filled with pure water or a WLS solution. These cells are separated from a Hamamatsu R1408 PMT by an ultraviolet transparent (UVT) acrylic window, using the same type of PMT and acrylic as in the SNO detector. The sample cells are cylindrical with a diameter of 20.4 cm and a height of 15 cm, for a total volume of 4.9 liters of optical medium.
In order to reduce the variation of gain of the PMTs due to their orientation with respect to the Earth’s magnetic field, a cylindrical envelope of mu-metal shields both PMTs from any variation of the magnetic field.
Depending on the orientation of the cells (PMT looking upward or downward) and the type of optical medium present in each sample cell, it is possible to isolate the proportion of WLS light and direct Cherenkov light detected by the PMTs and perform a light gain measurement. The Cherenkov cone of light always point downward, therefore only a PMT in the upward facing position would detect it, while the isotropically distributed WLS light is detected by both downward- and upward-looking PMTs.
Although many concentrations of different WLS candidates would have been possible to analyze with this apparatus, only CS124 at a concentration of 15.4 ppm was tested since it seemed the most promising candidate for its addition to the SNO detector. This concentration is higher than the optimal concentration of a few ppm obtained from the Monte Carlo analysis for SNO [17] because it was necessary to compensate for the smaller scale of the apparatus.
4.2 Calibration of the apparatus
Two types of calibration were performed. Since the resolution and sensitivity of the SNO PMTs allow the detection of a single photon, the first method consists of measuring the charge induced by a single photon hitting the PMT. Thus, the absolute scale of the apparatus was measured and resulted in a good linearity up to a few thousand photons, which is the luminosity expected from a cosmic ray event. The second method uses the data itself to check if both PMTs respond the same way to the Cherenkov light as a function of the voltage. The voltages of the two PMTs were adjusted such as to equalize their gains. Such calibration allows consideration of the intrinsic sensitivity of each PMT and any other cell asymmetry.
4.3 WLS timing measurements
The WLS re-emission time measurement consists of doing a fit of the PMTs pulse shape, assuming two Gaussianly distributed time components, the direct Cherenkov light and the WLS light. The fit of the re-emission time of CS124 gave a value of 6.1 0.5 ns, which is in good agreement with 6.2 0.3 ns found in the fluorescence lifetime measurement using a laser system (see Table 1). Although a more precise measurement would have been possible with a faster data acquisition system and a more sophisticated pulse shape analysis, it was unnecessary since the laser system was faster and easier to operate, and much less susceptible to systematic errors. Based on the agreement between the timing measurements performed, the WLS telescope seems to be well calibrated for the gain measurement described in the next section.
4.4 WLS light gain measurement
Depending on the orientation of the Cherenkov cell, there are two ways to measure the mean amplitude of pulses with and without WLS. If a WLS solution is in the upper cell and water is in the lower cell, only WLS light is detected in the first () and only Cherenkov light is detected in the second (). After inverting the configuration, both Cherenkov and WLS light are detected in the lower cell (), while in the upper cell only the dark noise should be detected (). Based on the ratio between the mean pulse amplitudes of the PMTs, an increase of 2.0 0.2 in the number of detected photons was obtained with WLS. The error is dominated by the level of noise in the PMTs and some residual asymmetry in the cells. A fully consistent results is obtained when the gain is computed from .
The main interest of the WLS cosmic ray telescope was to perform a light gain measurement and to ultimately determine not only the number of photons detected by the PMTs but the total number of photons produced. Since the PMT in a given cell detects only a fraction of the light produced and this fraction is different for Cherenkov and WLS light, a calculation is required to obtain the increase of photon produced within a solid angle. The Monte Carlo method was used for the determination of the WLS cosmic ray telescope acceptance and the light gain correction factor. The simulation generated Cherenkov photons, calculated their mean free path in the WLS solution and if the interaction point was within the cell volume, it changed the direction of the photon randomly. It has been found that 61.0% of the Cherenkov photons propagating toward the PMT were hitting it, while only 18.1% of the isotropic WLS photons ended their path on the PMT. Therefore, adding 15.4 ppm of carbostyril 124 into the WLS cosmic ray telescope resulted in a net light gain of of 4.4 0.5.
5 Conclusions
The optical and chemical properties of two new water based wavelength shifter (WLS) molecules, carbostyril 124 (CS124) and Alexa Fluor 350 (AF350), were tested as candidates to increase the detection efficiency of Cherenkov light of the Sudbury Neutrino Observatory (SNO). The tests indicated that these pH-insensitive WLS chemicals have strong absorbency below 350 nm and high re-emission probability between 350-500 nm with a short fluorescence decay time. This can significantly boost the Cherenkov signals detected by the SNO PMTs which surround the D2O region. Their long lifetime stability and good chemical compatibility with the materials used in the SNO detector as well as in the heavy water system allow addition of WLS with no major modification to the detector. Monte Carlo simulations allowed a detailed study of the response of a full-scale solar neutrino experiment to the addition of WLS. It was shown that a 5 ppm concentration of AF350 or CS124 would increase the light yield detected by the SNO PMTs by a factor of 2.9 and 3.0, respectively. A cosmic ray telescope was also built to test the WLS compounds in a well controlled experimental setup, and an increase of the detected Cherenkov light has been found by adding carbostyril 124. Taking into account the geometrical acceptance of the detector, an increase of 4.4 0.5 light yield has been measured. The measured increase in number of photons obtained with the WLS telescope has to be compared with the light gain of 3.0 obtained with the full simulation of SNO. It is important to note that a Cherenkov detector with a low sensitivity to ultraviolet light will greatly benefit from the addition of WLS. While a larger light gain is obtained in a small scale detector, where the attenuation is negligible, a reduced increase in the number of detected Cherenkov photons is expected if a wavelength shifter would be added in the heavy water of the Sudbury Neutrino Observatory. Ultimately the properties of the wavelength shifter candidates surveyed in this study can be used toward the conceptual design of future water based Cherenkov detectors.
6 Acknowledgments
The authors would like to thank Alex Davis, Pascal Elahi, Rachel Faust, and Christian Mallet for their contributions to the experiments. We wish to thank Mark Chen and Alex Wright for the measurements of fluorescence decay time of the WLS chemicals using the laser system in the Department of Physics at Queen’s University. This research was supported in Canada by the Canadian Foundation for Innovation (CFI), the Canada Research Chair (CRC) program, and the Natural Sciences and Engineering Research Council (NSERC).
References
- [1] J. Boger et al., Nucl. Instr. and Meth. (2000) 172.
- [2] Q.R. Ahmad et al., Phys. Rev. Lett. (2001) 071301.
- [3] Q.R. Ahmad et al., Phys. Rev. Lett. (2002) 011301.
- [4] Q.R. Ahmad et al., Phys. Rev. Lett. (2002) 011302.
- [5] S.N. Ahmed et al., Phys. Rev. Lett. (2004) 181301.
- [6] B. Aharmim et al., Phys. Rev. C. (2005) 055502.
- [7] G. Badino, P. Galeotti, L. Periale, O. Saavedra and A. Turtelli, Nucl. Instr. and Meth. (1981) 587.
- [8] S.E. Willis, Ph.D. Thesis, Yale University 1979.
- [9] T.C. Andersen et al., Nucl. Instr. and Meth. (2003) 399.
- [10] T.C. Andersen et al., Nucl. Instr. and Meth. (2003) 386.
- [11] C.A. Parker, Photoluminescence of solutions (Elsevier, London, 1968) sect. 3L.
- [12] S. Fery-Forgues and D. Lavabre, J. Chem. Ed. (1999) 1260.
- [13] W.H. Melhuish, J. Phys. Chem. (1961) 229.
- [14] A. Pardo, D. Reyman, J.M.L. Poyato and F. Medina, J. Lumin. (1992) 269.
- [15] W.R. Nelson, H. Hirayama, D.W.O. Rogers, The EGS4 Code System, SLAC report 265 (1985).
- [16] L.P. Boivin et al., Applied Optics (1986) 877.
- [17] E. Rollin, M.Sc. Thesis, Carleton University 2005.