Transverse depinning in weakly-pinned vortices
Abstract
We present experiments on weakly-pinned vortices, which exhibit a large critical transverse depinning force. These results are obtained in the superconducting metallic glasses FexNi1-xZr2 using crossed ac and dc driving currents. We study the vortex depinning force due to the transverse ac drive as a function of a longitudinal dc drive; the ac/dc combination permits the separation of the transverse drive from the longitudinal one. We show that the force required for depinning in the transverse direction is greatly enhanced by the longitudinal drive, which demonstrates the existence of a large transverse critical force. The measurements are performed as a function of magnetic field and temperature and show that the transverse critical force exists in a large portion of the phase diagram. Hysteresis observed at the transverse depinning threshold is consistent with a first-order transverse depinning transition.
I Introduction
The vortex state of type II superconductors is rich in interaction phenomena: Governed by vortex-vortex repulsion, thermal fluctuations and pinning from material inhomogeneities, the competition between ordering and disordering gives rise to a wealth of static and dynamic phase transitions, as well as non-equilibrium phenomena. While the effect of disorder on the static case has been widely studied in the past years Nattermann (1990); Bouchaud et al. (1992); Blatter et al. (1994); Giamarchi and Le Doussal (1994, 1995), the driven case still has much to reveal; complications due to the need to consider many sources of anisotropy and non-linear elasticity, for instance, have impeded elucidation of the dynamic regime.
A large number of studies have demonstrated that at high driving forces, a disordered system will show ordering due to averaging of disorder in the direction of motion: dynamical ordering Bhattacharya and Higgins (1993); Yaron et al. (1994); Hellerqvist et al. (1996); Marchevsky et al. (1997); Shi and Berlinsky (1991); Moon et al. (1996); Ryu et al. (1996); Olson et al. (1998); Spencer and Jensen (1997); Koshelev and Vinokur (1994); Giamarchi and Le Doussal (1996); Balents et al. (1997, 1998); Le Doussal and Giamarchi (1998); Pardo et al. (1998); Fangohr et al. (2001a, b); Marley et al. (1995). Experimentally, the crossover to a more ordered vortex phase at large driving current is deduced in transport measurements from the presence of a peak in the differential resistance Bhattacharya and Higgins (1993); Hellerqvist et al. (1996). Dynamical ordering has also been revealed by a decrease of the low frequency broadband noise Marley et al. (1995) and an increase of the longitudinal correlation length in neutron diffraction experimentsYaron et al. (1994); the phenomena has also been directly observed in magnetic decoration experimentsMarchevsky et al. (1997); Pardo et al. (1998). Numerically and analytically, the establishment that vortices undergo such dynamical phase transitions and ordering has lead to the prediction of the existence of static channels in which the vortices flow. These channels may be decoupled, in which case the vortex phase obtained is the moving transverse glass (MTG) and is characterized by smectic order; or they may be coupled, in which case one has the more ordered moving Bragg glass phase (MBG). Theoretical and numerical results have shown that these channels act as strong barriers against transverse depinning, preventing transverse motion of longitudinally moving vortices from which stems the existence of a finite transverse critical force Moon et al. (1996); Olson et al. (1998); Giamarchi and Le Doussal (1996); Le Doussal and Giamarchi (1998); Olson and Reichhardt (2000); Ryu et al. (1996); Fangohr et al. (2001a); Reichhardt and Olson (2002). In addition to vortex systems in superconductors, other elastic media have been shown to exhibit a finite transverse depinning threshold: Simulations of elastic strings have revealed a hysteretic transverse depinning transitionReichhardt and Olson (2002), while experimental measurements of charge-density wavesMarković et al. (2000) and Wigner solids have evidenced transverse pinningPerruchot et al. (2000). In particular, a transverse critical force of about one tenth the magnitude of the parallel critical force has been observed in a magnetically-induced Wigner solid in a GaAs/GaAlAs heterostructurePerruchot et al. (2000). The existence of a transverse critical force in vortex lattices has not yet been observed experimentally, which is the focus of this article.
Here we present the results of an experimental study of the transverse depinning transition of vortices and demonstrate the existence of a large transverse critical force and map out its phase diagram in field and drive. We find that for a system driven longitudinally with a dc current, application of a small transverse force, provided by an ac current, does not result in immediate transverse depinning. In some regimes, the transverse force required for depinning the vortices in the transverse direction is even increased by more than 30 % with respect to the force required in the longitudinal case, thus implying the appearance of very strong barriers against transverse motion due to the longitudinal drive. This surprisingly large value can be compared to results from numerical studies which have found the ratio of the critical transverse force to the critical longitudinal force to be of the order of 1 % Moon et al. (1996); Ryu et al. (1996); Olson and Reichhardt (2000) or 10 % Fangohr et al. (2001a). Following findings from Fangohr et al.Fangohr et al. (2001a), this ratio is expected to increase for more weakly-pinned vortices. However, finite size effects in numerical simulations make very difficult and computationally expensive studies in the limit of very weak pinning, which is the regime of our experiments. Indeed, in our experiments, vortex pinning strength is at least six times smaller than has been used in Fangohr et al.Fangohr et al. (2001a) and we obtain a ratio , which can even exceed 100%.
II Experimental techniques
The measurements were performed on different samples of the metallic glasses FexNi1-xZr2 prepared by melt-spinning Altounian et al. (1994) and which become superconducting below about K depending on the iron content, and are particularly clean with a very low critical current density such that vortices are very weakly-pinned. The amorphous nature of the samples further guaranties the absence of long range order and isotropic pinning. These materials were found to be strong type II low temperature superconductors Hilke et al. (2003) from estimates of the different characterizing length scales using standard expressions for superconductors in the dirty limit Kes and Tsuei (1983). They were also found to show a variety of phases of longitudinal and transverse vortex motion, including a MBG-like phase Hilke et al. (2003); Lefebvre et al. (2006), and hence are ideal for the study of transverse depinning.
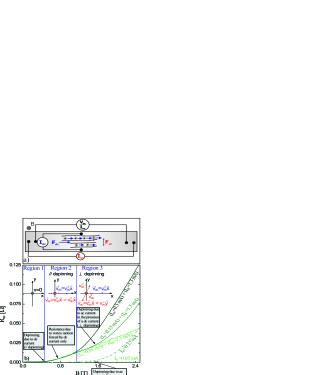
We proceed by cooling the samples in a 3He system to a temperature below 0.4 K. We use a dc current as the longitudinal drive, and a 15.9 Hz ac current provided by a resistance bridge as the transverse drive. A magnetic field provided by a superconducting magnet and directed perpendicularly to the sample plane is also used. The resistance is measured in the transverse direction with the resistance bridge. Indium contacts are soldered to the sample in the configuration shown in Fig.(1a). In a magnetic field perpendicular to the sample plane, the force exerted on the vortices by the dc current applied along the short edge of the sample acts in the direction , such that the vortices move under the action of this force along the long edge of the sample, as depicted. Similarly, the ac current applied along the long edge of the sample induces a force which results in an oscillatory movement of the vortices in the direction parallel to the short edge of the sample. In this manner, the channels of vortices are set up by the dc current in the longitudinal direction along the long edge of the sample, and the transverse force is provided by the ac current and directed along the short edge of the sample. Evidently, the two sets of contacts used for dc and ac driving cannot be made perfectly perpendicular to each other, and the transverse voltage measured (from the ac driving) also contains a component resulting from the ac component along the dc longitudinally driven motion. This small contact misalignment angle (=0 if they are orthogonal) is sample dependent and can easily be taken into account as discussed below.
III Results
III.1 Identification of the purely transverse contribution
Fig.1b) shows the transverse ac resistance as a function of magnetic field for zero (dash-dotted lines) and non-zero (solid lines) longitudinal dc currents. The dc driving current used is Idc=1.3 mA. Three distinct regions are defined, corresponding to three different regimes of vortex motion: Region 1 is characterized by vortices pinned in both directions, as no matter the combination of ac and dc current used, none of the ac or dc current is strong enough to depin the vortices, leading to zero resistance. In region 2, the resistance measured using solely ac currents Iac=0.03 mA and Iac=0.15 mA remains zero because these currents are not large enough to depin the vortices. However, the data acquired using a longitudinal dc current in addition to these transverse ac currents shows an ac resistance, which does not depend on the ac drives. Hence, this ac resistance results from the small component of vortex motion proportional to along the longitudinal (dc) direction, since depinning is associated with strong non-linearities of the V-I characteristicsFeigel’man et al. (1989); Fisher (1989); Nattermann (1990). This is in stark contrast to the behavior in region 3, where the ac transverse resistance depends on the transverse ac current and shown in region 3, where the vortices also move in the transverse direction. Vectors representing the direction of vortex motion in these 3 regimes resulting from the combination of ac and dc driving are shown in Fig.1b). One then easily identifies the transverse depinning transition as the point in field and ac current where the ac resistance starts to depend on the ac current. Hence, for a given longitudinal dc drive, the resistance associated to the pure transverse dynamics can be obtained as , where is a very small transverse ac measurement current which alone does not depin the vortices.
III.2 V-I measurements
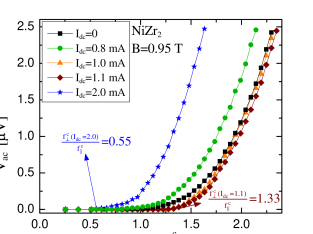
Transverse (ac) resistance measurements were performed on a sample of the alloy NiZr2 at a fixed magnetic field B=0.95 T and temperature T=0.35 K for different fixed longitudinal (dc) driving currents. The measurements are performed by applying a dc current, to which a small ac current is added and increased in small steps, and the resulting ac voltage is recorded after each current step. The pure transverse voltages are then obtained using the scheme described above, which removes the contribution due to the contact misalignment. In order to obtain the depinning forces we use an arbitrary cut-off voltage of (), below which we consider the vortices as effectively pinned. The resulting V vs. traces derived from these measurements are shown in Fig.2, where is the transverse force normalized to the longitudinal depinning force. is obtained from the transverse ac depinning current when the longitudinal current is set to zero. This is valid since our system is isotropic and the transport properties measured using ac or dc currents are equivalentLefebvre et al. (2006). The longitudinal depinning curve is thus represented by the Idc=0 black curve in Fig.2, where the longitudinal depinning current was determined to be =0.55 mA. Because the contact misalignment is small we have .
In the presence of a longitudinal drive the results in Fig.2 show that for Idc=2 mA the transverse depinning force () is reduced as compared to the longitudinal one, i.e. as extracted from the corresponding intersect of V with 10 nV. In contrast, for 1.0 mAI1.1 mA, the transverse depinning force is strongly enhanced by the presence of the longitudinal drive, with reaching for Idc=1.1 mA. Hence, in this range of longitudinal drives, strong barriers against transverse motion are created by the longitudinal drive.
III.3 The nature of criticality
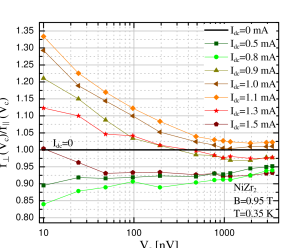
Experimentally, defining a true critical depinning force is difficult, since vortex motion is detected by the produced voltage, which is noise limited. Moreover, non-zero temperatures allow for activated depinning, which smoothes out the depinning transition. However, here we compare two depinning mechanisms (transverse and longitudinal depinning) and by applying the same criteria on both their ratio should not depend on the voltage cutoff used as long as their dependence is similar. Quite strikingly, we find that the choice of cutoff voltage criteria greatly influences the value of obtained. This is depicted in Fig.3, which is obtained by changing the cutoff criteria. For all longitudinal driving currents, one observes that approaches unity for large voltage cutoff. In fact, we obtain this ratio to be very close to one when the transverse force equals approximately five times the longitudinal force (data not shown here). This implies that the barriers against transverse vortex motion not only delay transverse depinning, but also constrain transverse vortex motion at larger velocities as well, when the vortices are already depinned in the transverse direction. This effect was also observed numerically by Fangohr et al.Fangohr et al. (2001a). More importantly, the data shown in this figure can also be used to characterize the nature of the transverse depinning transition. Indeed, an increase of the ratio with decreasing implies that the transverse pinning is more critical than the longitudinal one since absolute pinning turns on faster. We distinguish both behaviors as transverse enhanced pinning (when ) and as transverse reduced pinning otherwise. For curves with 0.9 mA 1.5 mA, we observe strong transverse enhanced pinning in contrast to and 0.8 mA, where we observe transverse reduced pinning. The critical depinning forces are now defined as the depinning currents corresponding to the lowest voltage cutoff, i.e., nV.
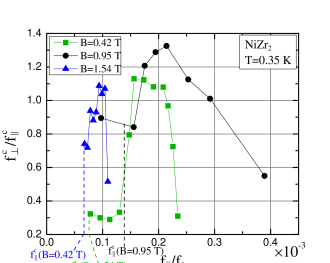
This allows us to analyze the dependence of on the longitudinal force for different vortex densities in Fig.4. Here the longitudinal force is presented in units of , the interaction force between two vortices separated by a distance ; in this manner, quantitative comparison of these results with those from numerical studies will be eased. The initial slight decrease of in the region below (equivalent to Idc=0.8 mA) for the B=0.95 T curve corresponds to a regime in which the longitudinal applied force is either smaller than the longitudinal depinning force, or just strong enough for depinning. The ratio is thus dominated by the transverse motion and should therefore be close to one. However, the observed small initial decrease of is attributable to the longitudinal dc component in the transverse direction due to our contact misalignment, which now contributes to depinning in the transverse direction. For larger longitudinal force, a peak in is seen, with a maximum at . In this peak region, the longitudinal force is large enough to induce longitudinal depinning and induce vortex motion in channels; as a result, an important enhancement of the transverse depinning force is witnessed. For 0.33f0, or I1.3 mA, the ratio of the critical forces starts to decay; the decay gets stronger for I1.5 mA. This decay is likely due to additional dynamic disorder, which could weaken the barriers against transverse vortex motion Fangohr et al. (2001a). We have observe a similar behavior in all the samples of FexNi1-xZr2 with x=0, 0.1, 0.3, and 0.5, which hints that it is universal to this class of weakly-pinned superconductors.
III.4 Comparison with numerical results
A striking result obtained in this study is the huge magnitude of
, ranging from 0.55 to 1.33, compared to between 0.01 and 0.1 obtained in numerical studies Moon et al. (1996); Ryu et al. (1996); Olson and Reichhardt (2000); Fangohr
et al. (2001a). This much larger
magnitude of the normalized critical transverse depinning force in
our experimental weakly pinned system is consistent with results from a numerical study by Fangohr et al. Fangohr
et al. (2001a), in which a larger critical forces ratio is obtained for more weakly-pinned
samples. This result was attributed to the independence of the transverse depinning on the longitudinal pinning potential. As a result, for weak longitudinal pinning, becomes very small, but remains essentially unaffected by the degree of longitudinal pinning since the moving system is topologically ordered.
To compare quantitatively our experimental results with those from numerical studies, we obtain the pinning force per unit length for our sample from , where is the area of the sample
perpendicular to the field. This leads to , which means
it is 6 times less pinned than the most weakly-pinned sample simulated
in Ref.Fangohr
et al. (2001a). In addition, we obtain the critical
longitudinal depinning force for our system using the V=10 nV
cutoff to be , which is more than 200
times smaller than the longitudinal depinning force simulated in
Ref.Fangohr
et al. (2001a). These quantities confirm the weak-pinning
nature of our samples, and explain the very large observed
critical transverse to longitudinal force ratio.
Another particularity of our results compared to results from numerical
studiesGiamarchi and Le Doussal (1996); Le Doussal and Giamarchi (1998); Fangohr
et al. (2001a); Reichhardt and Olson (2002) is the increase of the transverse critical force with increasing
longitudinal drive in the critical region, for instance between
and in Fig.4a). This result is contrary to the observation in
numerical simulations of a strong decrease of the transverse critical force
with increasing longitudinal vortex velocity Giamarchi and Le Doussal (1996); Le Doussal and Giamarchi (1998); Fangohr
et al. (2001a); Reichhardt and Olson (2002) attributable to the fact that for large longitudinal vortex velocity, the channels become straighter and cannot go through optimal pinning sites as easily, with result that the transverse barriers are weakened. We speculate that we obtain our differing results because pinning in these samples is dominated by collective effects rather than by the underlying pinning potential.
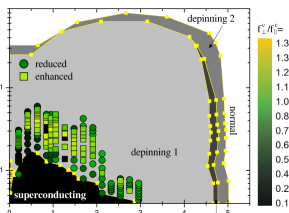
III.5 Magnetic phase diagram
We further investigated the transverse depinning transition for different applied magnetic fields; since increasing the magnetic field is equivalent to increasing effective disorder and thus pinning, this basically amounts to studying transverse depinning as a function of longitudinal pinning properties. The results reveal that a large critical transverse depinning force exists in regions of the phase diagram where a large longitudinal pinning force also exists. This is emphasized in Fig.5 which shows the complete longitudinal driving force magnetic field phase diagram extracted from resistance measurements as a function of magnetic field. Designation of the different phases is as described by Hilke et al.Hilke et al. (2003); depinning 1 and 2 correspond to depinned vortex states reminiscent of the MBG and the MTG Lefebvre et al. (2006) respectively, while the pinning phase corresponds to the peak effect Hilke et al. (2003). The graph also displays data points showing regions where transverse depinning was investigated and found to be enhanced (circles) with the magnitude of represented by the color scale on the right), and reduced (squares). The longitudinal depinning force, represented in this graph by the yellow line delimiting the superconducting and depinning 1 phases, is found to increase for low magnetic field ( T) as disorder proliferates, but decreases for larger fields ( T).
Since pinning in these samples is so weak and depends mostly on collective effects rather than on the underlying disorder, increase of the magnetic field passed about 0.5 T does not result in an increase of the pinning force due to the disorder it generates; on the contrary, this regime witnesses an decrease of the driving force necessary to depin the vortex lattice. It can also be seen that while the transverse depinning transition could only be investigated in the region T because the depinning current becomes too low for larger fields and noise dominates the signal, a large transverse depinning force, with significantly larger than 1, is only found in the region T where the longitudinal depinning force is also largest. This can be understood from consideration of the fact that the larger the longitudinal pinning force is (or equivalently the longitudinal pinning potential), the stronger the channels must be; the stronger channels must then also constitute a stronger barrier against transverse depinning and lead to the large transverse critical force. Of course, it has to be kept in mind that this is only true in the elastic regime of vortex motion in which the MBG is well-developed; for larger fields, the MBG is weakened (but does not necessarily break down) due to the proliferation of defects and installment of plastic flow, then resulting in a reduced with increasing . A similar increase of the transverse critical force with increasing longitudinal pinning strength for a simulated vortex lattice in the elastic flow regime has also been observed by Fangohr et al. Fangohr et al. (2001a).
It is important to note that the transverse depinning force data presented in Fig.5 does not necessarily represent the boundary of the critical transverse depinning phase; for instance, for T, no longitudinal force larger than N/m was investigated but the transverse depinning transition is still found to be critical for this force such that the critical region might extend to larger longitudinal force at this field. However, for T which is the largest field probed, no region showing enhanced transverse depinning was found.
III.6 Temperature phase diagram
With increasing temperature, the MBG phase has been predicted to survive up to the vortex lattice melting temperature Le Doussal and Giamarchi (1998), with accompanying vortex motion in channels and critical transverse force Fangohr et al. (2001a); a broadening of the vortex channels due to thermal displacements about their average position with a weakening of the transverse barriers is however anticipated. Therefore, while longitudinal depinning is normally eased at high temperature because vortices have more energy to overcome the pinning potential, transverse depinning should also proceed more readily because the vortices have more energy to surmount the channel barriers, which should also be weakened because of the thermally-induced lateral motion of the vortices. This is however not exactly the scenario observed from investigation of the transverse depinning force for different longitudinal driving currents as a function of temperature below Tc. Indeed, as can be seen from the vs longitudinal current data presented in Fig.6a), it is found that reaches a larger maximal value for T=0.41 K than for T=0.33 K, and even attains its maximum at T=0.60 K with =1.55. This observation signifies that for identical applied longitudinal force, barriers against transverse vortex motion are strengthened by the increase in temperature, whereas they are seen to weaken in some numerical simulations Fangohr et al. (2001a). This can be understood because the longitudinal vortex velocity increases with increasing temperature when induced by an equal external driving force (see inset of Fig.6a), recalling that voltage is proportional to vortex velocity), and hence results in a strengthening of the barriers, similar to what is observed for increasing longitudinal drive. Therefore, it appears from these results that for temperatures between 0.4 K and 0.6 K, increased transverse pinning due to increased longitudinal vortex velocity is stronger than the temperature-dependent weakening of the channel barriers.
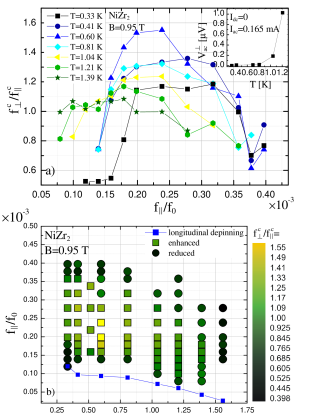
The results of the transverse critical current as a function of temperature and longitudinal driving current are summarized in Fig.6b in which the blue line represents the longitudinal depinning current determined with a 10 nV criterion, and the circles and squares represent the magnitude of the transverse to longitudinal critical current ratio according to the colors shown in the legend. Tc for this sample is 2.4 K, but the largest temperature investigated is 1.56 K, well below Tc; higher temperatures could not be investigated because at such temperatures the depinning current becomes too low and the measured signal becomes too noisy. Therefore, the region of the -T phase diagram shown to exhibit critical transverse depinning is not bounded and a region exhibiting critical transverse depinning probably might exist for higher temperatures below Tc.
III.7 History effects
The experiment described above raises interesting issues about history effects. For instance, as pointed out by Le Doussal and Giamarchi Le Doussal and Giamarchi (1998), one can wonder if the effect of applying a force in perpendicular directions simultaneously (i.e. ) is the same as first applying the longitudinal force , then waiting for steady state before applying the transverse force , as we did in this experiment. As discussed in Ref.Le Doussal and Giamarchi (1998), if the vortex state were liquid-like, the result of both these experiments would be identical, but for the moving vortex glass, the answer is not trivial and could bear important information about the glassy state. As an observation of history effects, Reichhardt and Olson Reichhardt and Olson (2002) have obtained, in a numerical study of transverse dynamics of elastic strings, hysteretic transverse depinning transitions for strings also driven in the parallel direction.
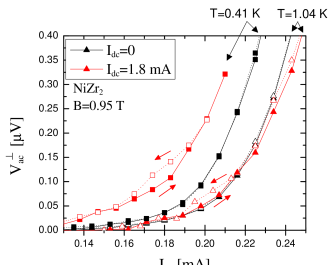
With the aim of studying possible history effects experimentally in the transverse depinning transition, we have performed some measurements of Vac as a function of transverse driving current Iac in the presence of a longitudinal driving current Idc for both increasing and decreasing Iac. The data was obtained in the following manner: First Idc is applied, then when the measured voltage is stable and steady state is presumably reached, a small Iac is also applied. Iac is then increased in small steps and the resulting Vac is recorded. When Vac is large and we are certain that the vortices are well depinned in the transverse direction, we start decreasing Iac, still in small steps, and recording Vac when steady-state is established after each change of Iac. Some of the data acquired in this manner is shown in Fig.7 at T=0.41 K and T=1.04 K for dc drives I and I mA. In the figure, the solid lines represent data acquired by increasing Iac while the dotted lines are for decreasing Iac. A region showing hysteresis is observed close to the depinning transition in cases also driven longitudinally with I mA. The size of the hysteresis loop also seems to increase with increasing temperature. In opposition, the case I, which represents longitudinal depinning, is definitely free of hysteresis, as it should be. The counterclockwise direction of the hysteresis loops in the V-Iac characteristics observed experimentally here is the same as that observed numerically in Ref.Reichhardt and Olson (2002). This observation of hysteresis at the transverse depinning transition is the first experimental confirmation that this transition is consistent with a first order transition and not merely a crossover.
IV Summary
We have investigated the transverse depinning transition in weakly-pinned
vortices in the superconducting metallic glass NiZr2 from electrical transport measurements using ac and dc
currents in crossed configurations. We have obtained that for a vortex system
driven longitudinally, application of a small transverse force does not result
in immediate transverse motion, thus confirming experimentally for the first
time the existence of a critical transverse depinning force in such systems.
In some cases, the force required for depinning in the transverse direction is
increased by more than 30 % with respect to the force required in the
longitudinal case, thus implying that barriers against transverse motion in the
MBG phase are very strong in these weakly-pinned vortex systems.
The transverse depinning transition was further investigated for various magnetic
fields and temperatures and was found to exhibit critical behavior in a large
portion of the phase diagram. From these results, it was deduced that a large
transverse critical force exists in regions of the magnetic phase diagram
where a large longitudinal depinning force also exists. It was also shown that
on the contrary to what is generally observed in simulations
Le Doussal and Giamarchi (1998); Giamarchi and Le Doussal (1996); Fangohr
et al. (2001a); Reichhardt and Olson (2002),
increasing longitudinal drive or longitudinal vortex velocity can result in an
increase of the transverse depinning force. We speculate that this effect, as
well as the large transverse depinning force obtained here compared to
in simulations Moon et al. (1996); Ryu et al. (1996); Fangohr
et al. (2001a); Olson and Reichhardt (2000) are both attributable to the very
weak-pinning character of our metallic glasses. In the former case, the
weak-pinning properties infer that pinning is mainly governed by collective
effects and interaction between vortices than by intrinsic disorder, such that
the weakening of barriers and straightening of channels witnessed as the
channels fail to adapt to the pinning potential at large vortex velocity in
numerical simulations Le Doussal and Giamarchi (1998); Giamarchi and Le Doussal (1996); Fangohr
et al. (2001a); Reichhardt and Olson (2002) does not take place. Similarly, the large observed results from the fact that the transverse depinning force
is largely independent of longitudinal pinning Fangohr
et al. (2001a), such that
for a very weakly-pinned system the ratio can be greatly
enhanced.
Hysteresis close to the transverse depinning transition was also
observed, thus confirming experimentally the first-order
nature of the transverse depinning transition in the glass state.
References
- Nattermann (1990) T. Nattermann, Phys. Rev. Lett. 64, 2454 (1990).
- Bouchaud et al. (1992) J.-P. Bouchaud, M. Mézard, and J. S. Yedidia, Phys. Rev. B 46, 14686 (1992).
- Blatter et al. (1994) G. Blatter, M. V. Feigel’man, V. B. Geshkenbein, A. I. Larkin, and V. M. Vinokur, Rev. Mod. Phys. 66, 1125 (1994).
- Giamarchi and Le Doussal (1994) T. Giamarchi and P. Le Doussal, Phys. Rev. Lett. 72, 1530 (1994).
- Giamarchi and Le Doussal (1995) T. Giamarchi and P. Le Doussal, Phys. Rev. B 52, 1242 (1995).
- Bhattacharya and Higgins (1993) S. Bhattacharya and M. J. Higgins, Phys. Rev. Lett. 70, 2617 (1993).
- Yaron et al. (1994) U. Yaron, P. L. Gammel, D. A. Huse, R. N. Kleiman, C. S. Oglesby, E. Bucher, B. Batlogg, D. J. Bishop, K. Mortensen, K. Clausen, et al., Phys. Rev. Lett. 73, 2748 (1994).
- Hellerqvist et al. (1996) M. C. Hellerqvist, D. Ephron, W. R. White, M. R. Beasley, and A. Kapitulnik, Phys. Rev. Lett. 76, 4022 (1996).
- Marchevsky et al. (1997) M. Marchevsky, J. Aarts, P. H. Kes, and M. V. Indenbom, Phys. Rev. Lett. 78, 531 (1997).
- Shi and Berlinsky (1991) A.-C. Shi and A. J. Berlinsky, Phys. Rev. Lett. 67, 1926 (1991).
- Moon et al. (1996) K. Moon, R. T. Scalettar, and G. T. Zimányi, Phys. Rev. Lett. 77, 2778 (1996).
- Ryu et al. (1996) S. Ryu, M. Hellerqvist, S. Doniach, A. Kapitulnik, and D. Stroud, Phys. Rev. Lett. 77, 5114 (1996).
- Olson et al. (1998) C. J. Olson, C. Reichhardt, and F. Nori, Phys. Rev. Lett. 81, 3757 (1998).
- Spencer and Jensen (1997) S. Spencer and H. J. Jensen, Phys. Rev. B 55, 8473 (1997).
- Koshelev and Vinokur (1994) A. E. Koshelev and V. M. Vinokur, Phys. Rev. Lett. 73, 3580 (1994).
- Giamarchi and Le Doussal (1996) T. Giamarchi and P. Le Doussal, Phys. Rev. Lett. 76, 3408 (1996).
- Balents et al. (1997) L. Balents, M. C. Marchetti, and L. Radzihovsky, Phys. Rev. Lett. 78, 751 (1997).
- Balents et al. (1998) L. Balents, M. C. Marchetti, and L. Radzihovsky, Phys. Rev. B 57, 7705 (1998).
- Le Doussal and Giamarchi (1998) P. Le Doussal and T. Giamarchi, Phys. Rev. B 57, 11356 (1998).
- Pardo et al. (1998) F. Pardo, F. De La Cruz, P. L. Gammel, E. Bucher, and D. J. Bishop, Nature 396, 348 (1998).
- Fangohr et al. (2001a) H. Fangohr, P. A. J. de Groot, and S. J. Cox, Phys. Rev. B 63, 064501 (2001a).
- Fangohr et al. (2001b) H. Fangohr, S. J. Cox, and P. A. J. de Groot, Phys. Rev. B 64, 064505 (2001b).
- Marley et al. (1995) A. C. Marley, M. J. Higgins, and S. Bhattacharya, Phys. Rev. Lett. 74, 3029 (1995).
- Olson and Reichhardt (2000) C. J. Olson and C. Reichhardt, Phys. Rev. B 61, R3811 (2000).
- Reichhardt and Olson (2002) C. Reichhardt and C. J. Olson, Phys. Rev. B 65, 094301 (2002).
- Marković et al. (2000) N. Marković, M. A. H. Dohmen, and H. S. J. van der Zant, Phys. Rev. Lett. 84, 534 (2000).
- Perruchot et al. (2000) F. Perruchot, F. I. B. Williams, C. J. Mellor, R. Gaal, B. Sas, and M. Henini, Physica B 284-288, 1984 (2000).
- Altounian et al. (1994) Z. Altounian, S. Dantu, and M. Dikeakos, Phys. Rev. B 49, 8621 (1994).
- Hilke et al. (2003) M. Hilke, S. Reid, R. Gagnon, and Z. Altounian, Phys. Rev. Lett. 91, 127004 (2003).
- Kes and Tsuei (1983) P. H. Kes and C. C. Tsuei, Phys. Rev. B 28, 5126 (1983).
- Lefebvre et al. (2006) J. Lefebvre, M. Hilke, R. Gagnon, and Z. Altounian, Phys. Rev. B 74, 174509 (pages 4) (2006), URL http://link.aps.org/abstract/PRB/v74/e174509.
- Feigel’man et al. (1989) M. V. Feigel’man, V. B. Geshkenbein, A. I. Larkin, and V. M. Vinokur, Phys. Rev. Lett. 63, 2303 (1989).
- Fisher (1989) M. P. A. Fisher, Phys. Rev. Lett. 62, 1415 (1989).