Effects of SN Feedback on the Dark Matter Distribution
Abstract
We use cosmological simulations to study the effects of supernova (SN) feedback on the dark matter distribution in galaxies. We simulate the formation of a Milky-Way type galaxy using a version of the SPH code GADGET2 which includes chemical enrichment and energy feedback by SN, a multiphase model for the gas component and metal-dependent cooling. We analyse the impact of the main three input SN feedback parameters on the amplitude and shape of the dark matter density profiles, focusing on the inner regions of the halo. In order to test the dependence of the results on the halo mass, we simulated a scale-down version of this system. First results of this ongoing work show that the dark matter distribution is affected by the feedback, through the redistribution of the baryons. Our findings suggest that the response of the dark matter halo could be the result of a combination of several physical parameters such as the amount of stellar mass formed at the centre, its shape, and probably the bursty characteristics of the star formation rate. As expected, we find that the dark matter haloes of small galaxies are more sensitive to SN feedback. Higher resolution simulations are being performed to test for numerical effects.
keywords:
galaxies: halos, galaxies: structure, cosmology: dark matter1 Introduction
Numerical simulations are an important tool for studying galaxy formation and evolution as they are able to describe the non-linear evolution of dark matter and baryons in a consistent way. The study of halo density profiles is particularly interesting because of the possibility of using them to confront CDM models with observational data such as disk galaxy rotation curves and the shapes of the cores of dwarf galaxies. The universality of the dark matter density profiles has been claimed in several works ([Navarro, J.F. et al. (1995), Navarro et al. 1995]; [Navarro, J. F. et al. (1996), Navarro et al. 1996]; [Navarro, J. F. et al. (1997), Navarro et al. 1997]). The halo profiles have been found to deviate slightly but systematically from the NFW model proposed by [Navarro, J.F. et al. (1995), Navarro et al. (1995)] as reported by recent works ([Navarro, J. F. et al. (2004), Navarro et al. 2004]; [Prada, F. et al. (2006), Prada et al. 2006]; [Merrit, D. et al. (2006), Merrit et al. 2006]). [Gao et al. (2008), Gao et al. (2008)] and [Merrit, D. et al. (2006), Merrit et al. (2006)] showed that the Einasto profile ([Einasto, J. (1965), Einasto 1965]) provides a better fit to the dark matter halo distribution.
It is believed that the presence of baryons in the central regions of the haloes can modify the dark matter potential. [Blumenthal, G. R. et al. (1986), Blumenthal et al. (1986)] proposed the adiabatic contraction model to globally predict the effects of baryons on the dark matter distribution. However, this model might be an oversimplification of the problem and more realistic treatments are needed. [Choi, J.H. et al. (2006), Choi et al. (2006)] studied the accuracy of the circular-orbit adiabatic approximation in predicting halo contraction due to disk formation. Although they found that the adiabatic approximation is valid, they did not include any other physical mechanism that could modify the halo structures. Baryons can also affect the distribution of matter through the injection of SN energy, principally in low mass systems. [Gnedin, O.Y. & Zhao, H. (2002), Gnedin & Zhao (2002)] studied the effect of maximum feedback on the central density of dark matter halos of gas-rich dwarfs, combining analytical models with simulations, finding that the effect is too weak to agree with observed rotation curves. [Read, J.I. & Gilmore, G. (2005), Read & Gilmore (2005)] found that two impulsive mass-loss phases are needed to significantly change the dark matter profiles.
Our aim is to investigate if SN feedback can indirectly affect the dark matter halo profiles by the effects produced on the baryonic distributions. In this work, we present preliminary results on the analysis of hydrodynamical numerical simulations of galaxies formed in a hierarchical clustering scenario. It is organized as follows. In Section 2 we present our numerical experiments. In Section 3 we discuss the preliminary results obtained for the dark matter density profiles and for the rotation curves in connection with the results for the dark matter profiles. In section 4 we summarize our preliminary findings.
2 Numerical Experiments
We use cosmological simulations to study the effects of SN feedback on the dark matter distribution in galaxies. We used an extension of the SPH code GADGET2 developed by [Scannapieco, C. et al. (2005), Scannapieco et al. (2005)] and [Scannapieco, C. et al. (2006), Scannapieco et al. (2006)] which includes chemical enrichment and energy feedback by SN, a multiphase model for the gas component and metal-dependent cooling. A set of 8 Milky Way type simulations with the same initial condition but different input feedback parameters were run. We adopted a CDM Universe with the following cosmological parameters: , , , a normalization of the power spectrum of and , with . The particle mass is and for the dark matter and baryonic particles, respectively. We have also run a simulation without feedback for comparison. The gravitational softening used was 0.8 kpc. The halo was extracted from a cosmological simulation and resimulated with higher resolution, and was selected to have no major mergers since z=1. At z=0 the MW halos are relaxed as indicated by their relax parameter of ([Neto, A.F. et al. (2007), Neto et al. 2007]). Details on these simulations can be found in [Scannapieco, C. et al. (2008), Scannapieco et al. (2008)] (hereafter, S08), where an extensive study on the effects of SN feedback on the star formation rates, galaxy morphology and disk formation is presented.
The star formation (SF) and feedback model has three relevant inputs parameters: the feedback parameter, (which regulates the fraction of energy injected into the cold and hot phases and ultimately determines the feedback strength), the energy released per SN, , and the star formation efficiency, . In Table 1 we show the main characteristics of the experiments and the input parameters assumed in each case. Depending on the combination of SF and SN parameters, baryons settle down determining structures with different morphologies. Disk components of different sizes and masses can be produced. However, in most cases the systems are dominated by a spheroidal component (). As discussed in S08, the inclusion of SN feedback allows the formation of disk components as a result of the self-regulation of the star formation activity and the generation of galactic winds. On the contrary, if SN feedback is not considered no disk develops and the final galaxy has a spheroidal shape. As it can be seen in Table 1, simulations E-0.7, F-0.5 and F-0.9 have the largest disks, while E-3 and C-05 runs, as well as the no feedback (NF) run were not able to form disks.
| Run | Feedback | Ms | rd | |||||
|---|---|---|---|---|---|---|---|---|
| param | ||||||||
| NF | No feed | 15.6 | 4.0 | - | - | 6.262 (4) | 17.39 (1) | 1.39 |
| F-0.3 | F0.3, E1, C0.1 | 4.5 | 9.7 | 0.42 | 5.8 | 7.037 (6) | 19.13 (1) | 1.18 |
| F-0.5 | F0.5, E1, C0.1 | 5.5 | 7.4 | 0.82 | 6.5 | 7.659 (5) | 17.86 (2) | 1.20 |
| F-0.9 | F0.9, E1, C0.1 | 6.6 | 7.7 | 1.04 | 9.7 | 7.101 (1) | 18.34 (1) | 1.22 |
| E-0.7 | F0.5, E0.7, C0.1 | 7.5 | 5.1 | 0.82 | 5.7 | 7.807 (1) | 15.45 (0.1) | 1.30 |
| E-0.3 | F0.5, E0.3, C0.1 | 13.5 | 3.8 | 0.60 | 4.8 | 7.053 (3) | 15.31 (1) | 1.44 |
| E-3 | F0.5, E3, C0.1 | 1.3 | 37.1 | - | - | 6.216 (1) | 23.09 (2) | 1.13 |
| C-0.01 | F0.5, E1, C0.01 | 9.9 | 3.7 | 0.39 | 2.6 | 7.163 (2) | 16.42 (1) | 1.40 |
| C-0.5 | F0.5, E1, C0.5 | 4.5 | 11.5 | - | - | 7.998 (1) | 17.15 (0.1) | 1.19 |
3 Dark matter density profiles
We constructed the dark matter profiles for the simulated systems at and tried to fit them several profile fitting formulae (NFW, Jaffe, Einasto). All analysed dark matter haloes have more than 120000 particles within the virial radius. Note that we have not taken out the substructure within the virial radius. Although we are currently addressing this point we do not expect a significant change since all our haloes are relaxed as already mentioned. The best fit was given by the Einasto’s expression ([Einasto, J. (1965), Einasto 1965]) in agreement with previous works. The Einasto profile has two free parameters, and , which indicate the sharpness and maximum position of the curves, respectively. Larger values represent more concentrated profiles ([Gao et al. (2008), Gao et al. 2008]). The fitting values obtained for the different simulations are shown in Table 1. We estimated bootstrap errors for and by fitting the Einasto’s formula to 50 bootstrap dark matter profiles and estimating the standard dispersion over the generated set of and parameters. As we can see the shape of the dark matter profiles can change significantly in comparison to the NF case, depending on the effects of the SN feedback.
As an example, in Fig. 1 we show the dark matter profiles and stellar circular velocity curves for the runs with different assumed energy per SN () as well as for the NF case. As larger values for the SN energy are assumed, stronger winds develop regulating the star formation activity so that a lower fraction of gas is transformed into stars. This behaviour affects the dark matter profiles. Particularly, in the extreme unrealistic value of ergs where the lowest stellar mass systems is allowed to formed, we obtained the less concentrated DM profile. We also note that this system is the most dark matter dominated one in the central region as indicated by the total to stellar mass ratio (Table 1). And it shows the lowest stellar circular velocity (Fig. 1, rigth-hand panel). Interestingly, for Run E-0.7 the dark matter density profile is the most concentrated one. In this case as it can be seen in the right-hand panel of Fig. 1 this system shows the flattest stellar mass velocity curve, reflecting the presence of an important disk component.
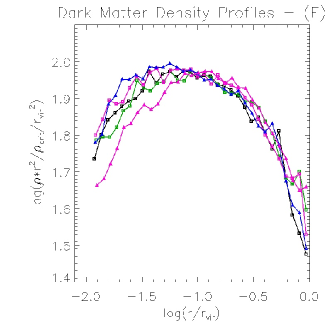
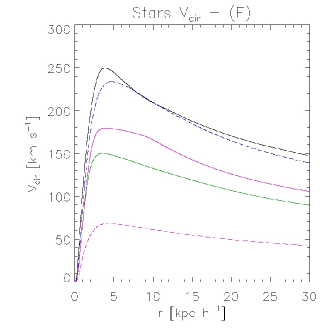
These results suggest that the amount of stars and their structural distributions are both important factors that could be related to the resulting shape of the dark matter profiles. Similar conclusions can be reached from the analysis of the results for the other two feedback parameters, and as it can be deduced from Table 1. In the case of the parameter the response of the dark matter to the variation of is not linear because the disk structural parameters also change in a more complex way with the strength of the feedback (S08). Also note that compared to the NF case, the feedback runs have lower final stellar masses. For these MW type systems, the fitting of the Einasto profile shows that the dark matter haloes are in general more concentrated when feedback is included than in the NF run. In the case of the star formation efficiency , we found that as the parameter increases, the stellar mass formed decreases and the central systems become more dark matter dominated with more concentrated dark matter profiles. The physical reasons of these behaviours will be discussed in detail by Pedrosa et al. (2008, in preparation).
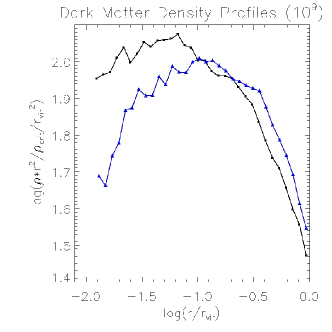
In order to investigate the dependence of the SN feedback effects on mass, we studied a scaled-down system of , with the same feedback parameters as in run E-0.7. We have also run the NF version of this small system. For this small galaxy, SN feedback produces a strong decrease in the star formation activity compared with that of the NF case. In this shallow potential well, violent winds are able to blow out important fraction of baryons, preventing the gas from condensating and forming stars after an early starburst (S08). As a consequence, the dark matter profile shows a strong decrement in the central regions as can be seen in Fig. 2. However, this result would need to be confirmed with higher resolution simulations.
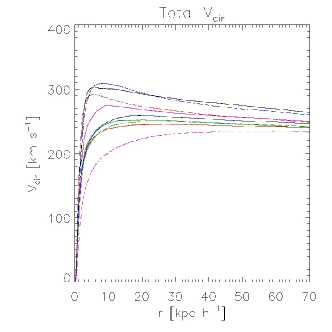
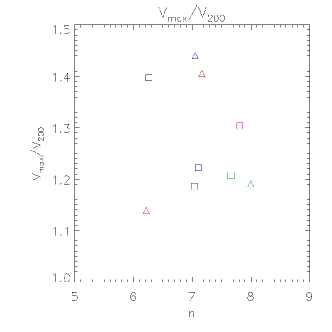
A well-known problem of numerical simulations was the inability to produce flat rotation curves comparable to that of the Milky Way because of the catastrophic concentration of baryons at the central region. In order to evaluate if our simulations are able to overcome this problem for some combinations of SN and SF parameters, we calculated the total circular velocity (). reflects the combined contribution of the dark matter and the baryons inside the central regions. Spiked are found for systems with high central baryonic concentrations (Run NF, Run E-0.3, Run C-0.01), for which the SN feedback was not turned on or was inefficient to regulate the star formation activity. There are two important effects due to SN feedback as it can be seen in Fig.3. On one hand, as the disk component gets better defined, the becomes flatter than in the NF case. On the other hand, when systems become more dark matter dominated, as in the extreme case of very strong feedback (Run E-3), the grows very smoothly with radius. To quantify this effect and to compare our results with observations, we estimated the ratio between the maximum of the total circular velocity and the virial velocity. In the right panel of Fig. 3 we show this ratio as a function of (shape parameter of the halo). For certain combinations of the SF and SN parameters we obtained ratios where , in agreement with observational results and theoretical expectations ([Dutton, A.A. et al. (2008), Dutton et al. (2008)] and references therein). We found that this is valid in the cases where the SN feedback was very efficient in blowing out the gas or when an important disk component was able to form.
4 Conclusions
This first analysis of the dark matter profiles shows that the dark matter distribution is affected by the way baryons are assembled onto the potential well. As reported by S08, we see that SN feedback prevents the catastrophic gas collapse and foster the formation of extended disk components. In response to this the DM modifies its distribution according to both the final baryonic mass gathered at the centre and its morphology. Our findings suggest that the response of the dark matter haloes to feedback depend on a combination of galaxy properties such as the amount of stellar mass concentrated at the centre, its shape, and probably the bursty characteristics of the star formation rate. A detailed study is being carried out by Pedrosa et al. (2008 in preparation) in order to gain insight in how these different factors might combined themselves to produce the detected changes in the dark matter profiles and there relative efficiencies. Also because the strength of the feedback depends on the potential well of the systems, dwarf-type systems could experience more violent mass losses which might produce the flattening of their potential well. Currently we are studying the history of merger trees of these systems to analyse how the dark matter is affected as the systems are assembled. We are also running higher resolution simulations to check for possible numerical effects.
References
- [Blumenthal, G. R. et al. (1986)] Blumenthal, G. R., Faber, S. M., Flores, R. & Primack, J. R. 1986, ApJ, 301, 27
- [Bullock, J. et al. (2001)] Bullock, J. S., Kolatt, T. S., Sigad, Y., Somerville, R. S., Kravtsov, A. V., Klypin, A. A., Primack, J. R. & Dekel, A. 2001, MNRAS, 321, 559
- [Choi, J.H. et al. (2006)] Choi, J.H., Lu, Y., Mo, H. J. & Weinberg, M. D. 2006, MNRAS, 372, 1869
- [Dutton, A.A. et al. (2008)] Dutton, A.A., van den Bosch, F.C. & Courteau, S. 2008, arXiv0801.1505
- [Einasto, J. (1965)] Einasto J. 1965, Trudy Inst. Astrofiz. Alma-Ata, 51, 87
- [Gao et al. (2008)] Gao,L., Navarro,J.F., Cole,S., Frenk,C., White,S.M.D., Springel,V., Jenkins,A., Neto, A.F. 2008, MNRAS, 387, 536
- [Gnedin, O.Y. & Zhao, H. (2002)] Gnedin, O. Y. & Zhao, H. 2002, MNRAS, 333, 299
- [Navarro, J.F. et al. (1995)] Navarro J. F., Frenk C. S. & White S. D. M. 1995, MNRAS, 275, 56
- [Navarro, J. F. et al. (1996)] Navarro J. F., Frenk C. S. & White S. D. M. 1996, ApJ, 462, 563
- [Navarro, J. F. et al. (1997)] Navarro J. F., Frenk C. S. & White S. D. M. 1997, ApJ, 490, 493
- [Navarro, J. F. et al. (2004)] Navarro, J. F., Hayashi, E.; Power, C., Jenkins, A. R., Frenk, C. S., White, S. D. M., Springel, V., Stadel, J. & Quinn, T. R. 2004, MNRAS, 349, 1039
- [Neto, A.F. et al. (2007)] Neto, A.F., Gao, L., Bett, P., Cole, S., Navarro, J.F., Frenk, C.S., White, S.D.M., Springel, V., & Jenkins, A. 2007, MNRAS, 381, 1450
- [Merrit, D. et al. (2006)] Merritt, D., Graham A., Moore B., Diemand J. & Terzic B. 2006, AJ, 132, 2685
- [Prada, F. et al. (2006)] Prada, F., Klypin, A.A., Simonneau, E., Betancort-Rijo, J., Patiri, S., Gottl ber, S., Sanchez-Conde, M.A. 2006, ApJ, 645, 1001
- [Read, J.I. & Gilmore, G. (2005)] Read, J. I. & Gilmore, G. 2005, MNRAS, 356, 107
- [Scannapieco, C. et al. (2005)] Scannapieco C., Tissera P.B., White S.D.M. & Springel V. 2005, MNRAS, 364, 552
- [Scannapieco, C. et al. (2006)] Scannapieco, C., Tissera P.B., White S.D.M. & Springel V. 2006, MNRAS, 371, 1125
- [Scannapieco, C. et al. (2008)] Scannapieco, C. Tissera, P.B., White S.D.M. & Springel V. 2008, MNRAS in press, 0804.3795v1