Very Low-Mass Objects in the Coronet Cluster: The Realm of the Transition Disks11affiliation: Based on ESO program 079.C-0235
Abstract
We present optical and IR spectra of a set of low-mass stars and brown dwarfs in the Coronet cluster (aged 1 Myr), obtained with the multifiber spectrograph FLAMES on the VLT and with the IRS instrument on Spitzer. Most of the objects had been selected via their X-ray emission in a deep Chandra survey. The optical spectra reveal spectral types between M1 and M7.5, confirm the youth of the objects (via Li 6708 Å absorption), and show the presence of accretion (via H) and shocks (via forbidden line emission). The IRS spectra, together with IR photometry from the IRAC/MIPS instruments on Spitzer and 2MASS, confirm the presence of IR excesses characteristic of disks around 70% of the objects. Half of the disks do not exhibit any silicate emission, or present flat features characteristic of large grains (6 m). The rest of the disks show silicate emission with indications of amorphous and crystalline silicate grains a few microns in size. About 50% of the objects with disks do not show near-IR excess emission, corresponding to the presence of “transitional” disks, according to their classical definition. This is a very high fraction for such a young cluster. The large number of “transitional” disks suggests lifetimes comparable to the lifetimes of typical optically thick disks. Therefore, these disks may not be in a short-lived phase, intermediate between Class II and Class III objects. The median spectral energy distribution of the disks in the Coronet cluster is also closer to a flat disk than observed for the disks around solar-type stars in regions with similar age. The differences in the disk morphology and evolution in the Coronet cluster could be related to fact that these objects have very late spectral types compared to the solar-type stars in other cluster studies. Finally, the optical spectroscopy reveals that one of the X-ray sources is produced by a Herbig Haro object in the cloud.
1 Introduction
The formation of very low-mass stars and brown dwarfs (BD) has been a matter of discussion for a long time (Luhman et al. 2006). The difficulties in fragmenting a cloud or stopping the envelope mass accretion at or near the hydrogen burning limit suggested that very low-mass objects may not form like solar-type stars, but require other mechanisms like ejection in multiple systems (Bate et al. 2005; Umbreit et al. 2005) or photoerosion by nearby high-mass stars that can remove part of the initial core material (Withworth & Zinnecker 2004). At the same time, multiple studies have focused on the detection of accretion disks around very low-mass young stars and BD (Fernández & Comerón 2001; Natta & Testi 2001; Jayawardhana et al. 2002, 2003; Pascucci et al. 2003; Klein et al. 2003; Luhman et al. 2005; Mohanty 2004, 2005). H spectroscopy reveals active accretion, and the excesses in the near- and mid-IR are consistent with disks similar to the disks around classical T Tauri stars (CTTS; Muench et al. 2001; Apai et al. 2002, 2005; Pascucci et al. 2003; Mohanty et al. 2004; Jayawardhana et al. 2005; Scholz & Jayawardhana 2008). IR spectroscopy finds further similarities: dust evolution, grain growth/settling and disk flattening, formation of crystalline silicates, and inner holes (Furlan et al. 2005; Apai et al. 2005; Gizis et al. 2005; Sterzik et al. 2004; Sargent et al. 2006; Natta et al. 2007; Morrow et al. 2008; Henning 2008), which are thought to be the first steps in the formation of planetary systems, occur in these disks. Therefore, objects of all masses may be formed by cloud fragmentation and subsequent disk formation and accretion (Luhman et al. 2007).
Nevertheless, our understanding of disk evolution and accretion mechanisms in very low-mass stars and BD is still far from complete. The timescales for very low-mass disk evolution, expected to be longer than those of solar-type T Tauri stars (TTS) and Herbig Ae/Be stars (HAeBe; Sterzik et al. 2004; Dahm & Hillenbrand 2007; Bouy et al. 2007), are still very uncertain (Lada et al. 2006), due to the lack of statistically significant samples of coeval very low-mass stars and BD. IR observations of M-type stars reveal differences in innermost disk evolution (Kessler-Silacci et al. 2007; Sicilia-Aguilar et al. 2007), which may be the result of differences in the disk structure, presence of dead zones, and accretion mechanisms (Hartmann et al. 2006) and could affect the formation of planetary systems in such disks. As it happens with the solar-type TTS, deeper and more complete multiwavelength observations suggest that there is an important fraction of harder-to-detect, flattened and transitional disks with inner holes around the lower-mass objects. For these very low-mass objects, with masses 0.2 M⊙ down to the BD regime, the morphology of the disks could be different (Morrow et al. 2008), but the difficulties in observing faint objects and determining the low-mass initial mass function in the regions translate into very small samples and large uncertainties. If, like we observe in solar-type TTS, individual differences in disk evolution are remarkable even for objects of similar ages and spectral types, the knowledge of disks and accretion around very low-mass stars and BD and their evolution is highly limited at the present time, and may be biased toward “special” systems (with large IR excess and strong accretion rates).
The Coronet cluster (also known as CrA) is an obscured star-forming region, located at a distance of 150 pc (d 130 pc according to Marraco & Rydgren 1981 and De Zeeuw et al. 1999; d 170 pc according to Knude & Hog 1998), associated with the Herbig Ae star R CrA (Taylor & Storey 1984) and a dense molecular core (Loren 1979). The Coronet cluster is relatively isolated at the edge of the Gould Belt. It is located out of the galactic plane, and it is probably part of the Sco OB2 Association (De Zeeuw et al. 1999) and of the large Sco-Cen region (De Geus et al. 1992). Cambrésy (1999) estimated a total mass of 1600 M⊙ for the whole cloud, using a distance of 170 pc. Casey et al. (1998) obtained an age of 3 Myr for the TY CrA multiple system, considering a distance of 130 pc; the cluster would be younger if the distance is larger. An age around 1 Myr is more consistent with the presence of nebular material and Class 0 objects (Chen et al. 1997). Nisini et al. (2005) estimated an age of 0.5-1 Myr based on 4 embedded objects, being therefore one of the closest and youngest clusters. Submillimeter, millimeter, IR, and optical surveys (Henning et al. 1994; de Muizon et al. 1980; Wilking et al. 1985; Marraco & Rydgren 1981) found a few HAeBe and TTS, suggesting a modest stellar population. The most massive stars in the region are the Herbig Ae star R CrA and the B9 star TY CrA. X-ray surveys using Einstein, XMM-Newton, ROSAT, and Chandra (Walter 1986; Walter et al. 1997; Neuhäuser et al. 1997, 2000; Hamaguchi et al. 2005a,b) identified several low-mass members. Deeper X-ray observations (Garmire & Garmire 2003) found 118 potential (1) sources, many of which were consistent with young stars, some of them deeply embedded, which have not been described in detail yet.
Here we present the results of optical and IR spectroscopy on a collection of low- and very low-mass members of the Coronet Cluster. The new and archive data, including the Chandra survey, optical spectroscopy with FLAMES/VLT, IR spectroscopy with IRS/Spitzer, and IRAC and MIPS/Spitzer photometry are introduced in Section 2, where we also describe the selection methods of the sample of very low-mass objects. The derived stellar and disk properties are presented in Section 3, and their implications for star formation and disk evolution are discussed in Section 4. Finally, the results are summarized in Section 5.
2 Selection of the sample, observations, and data reduction
Here we present the different observations (see Table 1 for a summary). The sample was selected starting from a deep X-ray survey (Section 2.1) and using additional optical candidates. The membership and spectral types were confirmed with the optical multifiber spectrograph FLAMES/VLT (Section 2.2). Finally, the IRS instrument on Spitzer (Section 2.3) was used to study the presence of disks and their characteristics, and the survey is completed with data from 2MASS and IRAC/MIPS archival data (Section 2.4). The Chandra field, together with the optical candidates in the region, are completely covered in at least two of the IRAC channels (all the four channels in 95% of the cases) and the MIPS maps.
2.1 A very low-mass cluster in the CrA region: X-ray survey
The starting point of this work were the X-ray detections of potential low-mass objects in the region. The X-ray data were obtained on 2000 October 7 with the Chandra X-ray Observatory (CXO). The observation was made using the ACIS-I (AXAF CCD Imaging Spectrometer) array of CCDs in the timed-exposure mode (Garmire et al. 2003). This survey covered a 16.8’16.8’ field centered on 19:01:47.9 -36:58:22 J2000 with a 20 ks exposure. The data were aspect corrected using 10 stars in the same field with an estimated astrometric uncertainty of 0.5” for stars within 5 arc minutes of the aim-point. Source detection and location were determined using the WAVDETECT software (Freeman et al. 2002). The energy range was limited to the range 0.5 - 8.0 keV to maximize the S/N. The data were corrected for Charge Transfer Inefficiency (CTI) caused by radiation damage of the CCDs during the first weeks after launch, which improves the energy resolution and charge loss due to changes in the pattern of charge generated by X-ray interaction in the CCD pixels (Townsley et al. 2002). Flaring pixels were removed using the status filter and by examining the arrival time of each event. A small subset of events was found to occur in the next exposure for a given pixel and were missed by the status filter. These events were removed from the data as flaring pixel events. The X-ray properties of the confirmed members of the Coronet cluster are compiled in Table 2. A larger list of sources and more detailed analysis will be reported in a future publication.
All the sources in Table 1 (except G-100, G-133, and G-136) were detected with more than 84% confidence level. The limiting sensitivity for the observations was 2.110-15 erg cm-2 s-1 in the 0.5-8.0 keV band, which corresponds to a luminosity of 61027 erg s-1. The depth of the survey ensures complete detection of all Class III and Class II objects down to the BD regime within the Chandra field (considering the typical relations between bolometric and X-ray luminosities; Flaccomio et al. 2006), and an important number of Class I embedded sources. Some of the most extincted sources (A15 mag) may be not detected, but the high extinction region is only a minimal part (6%) of the total Chandra field (Henning et al. 1994), so most of the extincted sources are probably Class I/Class 0 objects with thick envelopes. Due to the depth of the exposure and by comparison with other Chandra surveys, a fraction of the sources could be extragalactic (Garmire & Garmire 2003). In addition, shocks and Herbig-Haro (HH) objects are known to produce X-ray emission (Pravdo et al. 2001; Favata et al. 2002; Raga et al. 2002), and several shocks have been identified in the optical in the Coronet cluster (Graham 1993; Wang et al. 2004). Therefore, optical and IR data are essential in order to determine the nature of these sources.
2.2 Optical spectroscopy
In order to confirm the cluster membership and to obtain accurate spectral types, we targeted the Coronet cluster with the multi-object optical spectrograph FLAMES on the UT2/VLT. Observations took place between April and June 2007 within our program 079.C-0235. FLAMES, combined with the multifiber spectrograph GIRAFFE and the MEDUSA fibers, permits to obtain up to 130 spectra, including objects and sky positions. We observed one field centered on 19:01:40 -36:56:30 J2000 with three different gratings (L682.2, L773.4, L881.7), providing intermediate resolution (R=5600-8600) spectra from 6440 Å to 9400 Å. This spectral range includes the main accretion feature (H emission at 6563 Å), Lithium I absorption line (signature of youth, 6708 Å), [S II] emission lines characteristic of shocks and Herbig Haro (HH) objects ( 6716, 6731 Å) and a large number of photospheric features required for spectral type classification of late-type stars.
The spectrograph fibers were assigned to candidate cluster members as listed in Table 1. They include objects identified via their X-ray emission (Garmire & Garmire 2003; labeled G-number), completing the list with optical very low-mass stars and BD candidates (López-Martí et al. 2005), and a large number of sky positions, required to perform a proper background subtraction in the inhomogeneous CrA nebula. Since the selection was done independently of the Spitzer colors, it is not biased toward objects with disks, and the sample contains Class I, Class II, and Class III objects. The fibers have an aperture of 1.2 arcsec, so precise coordinates are necessary. All the X-ray detections were matched to 2MASS objects, or had their coordinates transformed into the 2MASS system, to avoid fiber mismatching. For the sources that were not detected with 2MASS nor Spitzer, there could be some mismatching in the fiber position, since the X-ray coordinates have in some cases uncertainties of the order of the fiber diameter (see Section 2.1), but this would in any case affect only very few cases, if any. A total of 56 fibers were assigned to objects, and 70 fibers were positioned to measure the sky.
The spectra were reduced using IRAF111IRAF is distributed by the National Optical Astronomy Observatories, which are operated by the Association of Universities for Research in Astronomy, Inc., under cooperative agreement with the National Science Foundation. standard tasks within the packages noao.imred.ccdred and noao.imred.specred. A total of 32700 s exposures were taken with the gratings L682.2 and L773.4, and 22700 s with the grating L881.7, in order to minimize the effects of cosmic ray hits. The spectra were bias corrected, combined, and then extracted and flat fielded using the specific task for multifiber spectroscopy, dofibers. This task was also used to determine the wavelength calibration, using the available ThAr lamp. Due to the variations of the sky over the whole region, as well as some stray light affecting part of the fibers on the CCD, the sky subtraction was done individually for each object. The different sky spectra were divided in groups according to their brightness and the location on the CCD. Each group had a minimum of 20 individual sky spectra, so the noise of the images was not substantially increased by the sky subtraction. The sky emission lines were corrected from each spectrum by subtracting the appropriate combined sky spectrum. Due to the differences in transmission between fibers, and since it is not required for the analysis we present here, no flux calibration was performed. In order to match the spectra over the entire wavelength range, we scaled the instrumental flux in the regions where the spectra overlap (80 Å between gratings L682.2 and L773.4, and 140 Å between L773.4 and L881.7).
Finally, the presence of emission and absorption lines (especially H and the youth indicator Li I at 6708 Å) were measured with IRAF task splot. Of all the 56 objects observed with FLAMES, 17 were not detected at optical wavelengths, being most likely highly extincted stars or protostars (Class I/Class 0 objects), or (mainly the objects outside the high extinction cloud) extragalactic objects. Since none of the non-detected objects is detected in the 2MASS survey, their optical magnitudes are likely to be very faint, and therefore, we believe they are rather non-detections than fiber mismatching. One of the objects detected (G-115) is confirmed to be a quasar at z=0.62. For the rest, the H line could be identified, and for 11 of them, the signal to noise ratio (S/N) was good enough to allow spectral typing (typically, S/N100), or approximate spectral typing for 3 more objects (with S/N30-100; see Section 3.1).
2.3 IRS spectroscopy
A total of 14 IR spectra were obtained with the low-resolution modules of the Infrared Spectrograph (IRS; Houck et al. 2004) on Spitzer, within our GO-3 program 30536. The observations took place between August 2006 and October 2007. The objects were selected among the X-ray members with IRAC and/or MIPS IR excesses, refining the selection to ensure that the candidates were located in a zone of moderate to low background. The observations were taken using the high-precision optical pick-up, to ensure good centering of the object on the slit in a region with multiple IR sources and strong emission from the ambient gas. The exposure times for each object were calculated considering the IRAC and MIPS fluxes (see Section 2.4), and ranged between 200 s for the brightest sources to 105 min for the faintest ones (see Table 1). In addition, we include the spectrum of CrA-465, belonging to the GO3 program number 30540.
The spectra were reduced using the reduction schemes developed for the analysis of the data from the legacy programs “Formation and Evolution of Planetary Systems” (FEPS) and “Cores to Disks” (c2d; Bouwman et al. 2006, 2008 and references therein). This reduction package consist of automated routines, based on SMART (Higdon et al. 2004) and other IDL programs, to extract calibrated IRS spectra from the Spitzer pipeline basic calibrated data (BCD). We use a custom-size extraction window, fitted to the point spread function, which ensures better sensitivity than the default extraction aperture provided by the pipeline. For sources with high S/N, the position of the aperture was fitted in the reduction process, in order to minimize flux loses and ensure a good order matching. In case of high-background regions, we cancel the sky in an efficient way by the subtraction of the opposite nod beams and extraction and subtraction of the two resulting sources. Bad pixel masks were created by examining the images, and included in the reduction. These data reduction techniques have produced high-quality IRS spectra for the FEPS program and for the Cha very low-mass stars IRS program (Bouwman et al. 2006, 2008).
In the cases where the background levels were higher and/or the objects were very faint (G-65, CrA-205, CrA-466, CrA-4110, CrA-4111) the background was examined at different locations in the two nods (on both sides of the star and in the off positions), selecting the best fitting one for the subtraction. In the case of CrA-4110 and G-65, the presence of an extremely bright source and strong diffuse emission at the LL (long-low, 14-25 m) wavelengths made it impossible to extract the source, so only the SL (short-low, 5-14 m) range is presented.
2.4 IRAC, and MIPS complementary data
To complete the disk information, especially for the objects without IRS spectra, we searched the 2MASS database as well as the Spitzer Infrared Array Camera (IRAC; Fazio et al. 2004) and the Multiband Imaging Photometer (MIPS; Rieke et al. 2004) data already being public in the Spitzer archive for the Coronet region. The complementary 2MASS and Spitzer data for all sources observed with FLAMES and/or IRS are presented in Table 3. Since we did not find a list of IRAC and MIPS sources in the Coronet within the literature, the IRAC and MIPS data were downloaded using Leopard. The data covering our objects were obtained from programs 6 (AORs 3650816 and 3664640), 30784 (AOR 17672960), and 248 (AOR 13469696). These programs include two IRAC fields (0.30.3 deg) with small overlap in the standard map mode (12s exposure for AOR 3650816, and 612s for 17672960), a small MIPS 24 m map (77 arcmin, 310s exposures), and large MIPS 24 and 70 m scan maps (0.61 deg, exposure time 3.67s). The very large areas covered by IRAC and MIPS ensure that all the X-ray and optical candidates are included in at least two IRAC channels (95% of the objects are covered by IRAC maps in all the four channels) and in the large MIPS map.
We constructed the mosaics using the software MOPEX, starting on the BCD data, and using the standard parameters in the Spitzer Mosaicker Manual 222http://ssc.spitzer.caltech.edu/postbcd/onlinedocs/intex.html. A 10% accuracy in the photometry is sufficient for the aim of this work, and the main sources of error in the region are the variable background and the photon counts for the faintest objects, so we did not correct for array location dependence.
We obtained aperture photometry using the IRAF task phot in the package noao.digiphot.apphot. For the four IRAC channels, we used a 5 pixel aperture with a background annulus 5-10 pixels, with the corresponding aperture corrections listed in the IRAC Data Handbook (1.061, 1.064, 1.067, and 1.089 for the 3.6, 4.5, 5.8 and 8.0 m channels, respectively). For the MIPS 24 m photometry, we used a 5 pixel aperture with background annulus 15-19 pixels and an aperture correction of 1.167 (MIPS Data Handbook333http://ssc.spitzer.caltech.edu/mips/dh). These values had been successfully applied to our Spitzer IRAC and MIPS photometry of Tr 37 and the Tr 37 globule (Sicilia-Aguilar et al. 2006a). For the few sources detected at 70 m, we used a 7.5 pixel aperture, background measured from 10-15 pixels, and an aperture correction 1.295, following the MIPS Data Handbook. In case a source was detected with equally good quality in two programs, we use the average magnitude (note that differences between two measurements are always small and fully consistent with the photometric errors in Table 3). The main limits of the IRAC and MIPS photometry are the contamination of large parts of the maps by the saturated emission of nearby bright sources (in particular, R CrA) and extended nebular emission. For objects with moderate extinction (A15 mag), the IRAC data is complete down to photospheres of M7 type objects, and down to M4-M5 photospheres at 24 m. The detection limits for MIPS are 1-2 mJy (magnitude 9.5-10) at 24 m, and 80 mJy (magnitude 2.5) at 70 m. The IRAC and MIPS data are also in very good agreement with the fluxes measured in the IRS spectra.
3 Analysis
3.1 Spectral types and extinction
The first step on the analysis of the FLAMES spectra was to derive spectral types and extinction values for the observed objects. Given that all the spectra showed the typical TiO and VO bands of M-type stars (see Figure 1), we used a combination of spectral typing indices for M stars, containing four PC (pseudo-continuum) indices from Martín et al. (1996), namely PC1, PC2, PC3 and PC4, and the R1, R2, R3, TiO 8465 indices in Riddick et al. (2007), listed in Table 4. In case the spectral type was M5 or later, the results were refined by using the indices VO 2 and VO 7445 (Riddick et al. 2007). We avoided the indices that can be affected by atmospheric absorption (O2 and H2O bands), and those falling near the extremes of the FLAMES spectra. All the indices were obtained by measuring the ratio of average fluxes in two or more places in the spectra (Table 4). We use the calibrations derived from collections of standard stars and BD listed in Martín et al. (1996) and Riddick et al. (2007), except for the PC1 and PC2 indices, for which we fitted a linear relation, including all the objects listed in Martín et al. (1996), in order to improve the quality of the fit (see Table 4).
The PC indices have the disadvantage that they compare zones of the spectrum separated by 500-1500 Å, which makes them sensitive to extinction. The Riddick et al. indices compare fluxes which are not more than 200 Å apart, so the effect of extinction is negligible. Gravity can lead to variations as well. The calibration in Riddick et al. (2007) is constructed for pre-main sequence objects with ages similar to the members of the Coronet cluster, so the errors due to differences in gravity are expected to be minimal. We did not find significant differences between the spectral types obtained from extinction- or gravity-sensitive indices and others, so we believe the results are robust. Combining several indices for each object, the typical errors in the spectral type are around 0.5-1 subtypes. For stars M2 or earlier, for which the described indices are not very precise, we made a visual comparison of the spectra with those of standard stars in order to refine the classification. For the objects with poor S/N (30-100), for which the indices were not accurate, we obtained an approximate spectral type by visual comparison to standard spectra, checking the 2MASS colors as well to reduce the uncertainties. Our results are in good agreement with the spectral types or approximate spectral types listed by López-Martí et al. (2005) and Forbrich & Preibisch (2007).
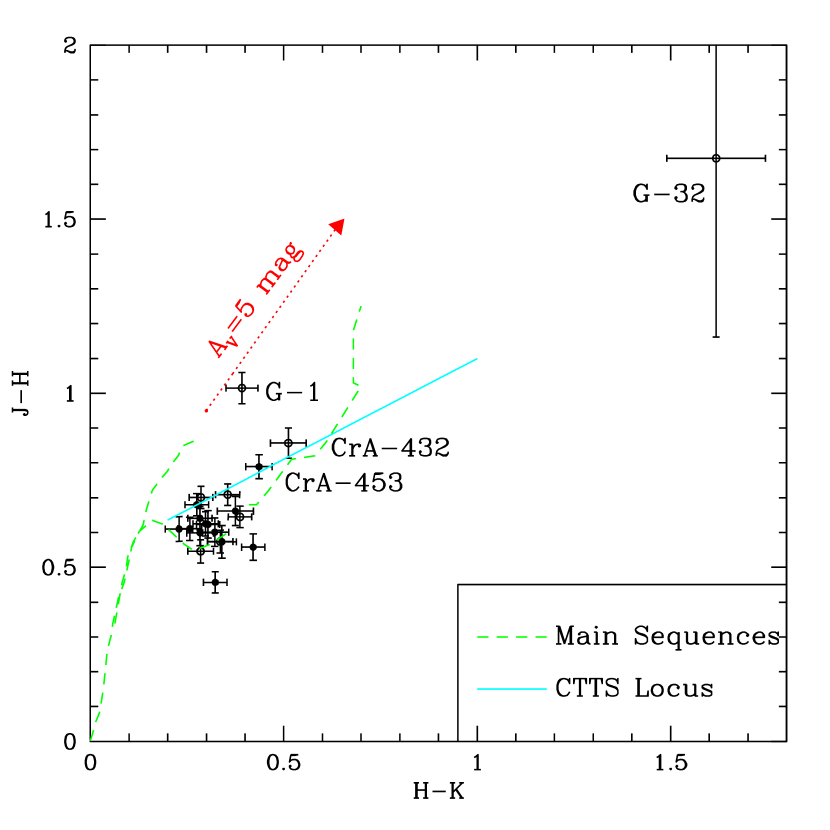
For the objects with known spectral types, the extinction was estimated using the J-H and J-K colors observed with 2MASS, and comparing to the standard colors for stars (Bessell et al. 1998) and for BD (Kirkpatrick et al. 1995). For each object, the extinction AV was derived from E(J-H) and E(H-K). Following Bessell & Brett (1988), and assuming a typical galactic extinction law, AV=10.87 E(J-H) and AV=5.95 E(J-K) mag. The final extinction was obtained as the average, with errors given as the standard deviation. The results are similar (within 5%) to those using the relations in Cardelli et al. (1989). Since many of the studied objects have circumstellar material, part of the matter causing the extinction could be processed to some degree, which may result in non-standard extinction laws. Nevertheless, the agreement between the extinction obtained from both J-H and J-K suggest that the deviations, if any, are small. The location of the objects within the J-H vs. H-K diagram (Figure 2) is in good agreement with the spectral types (M stars and a BD, CrA-465) as well as with the standard extinction law. The spectral types and extinctions are listed in Table 6.
For the objects with no optical spectra, approximate spectral types could be inferred only from the SED fitting. For those two classes, we can estimate an approximate extinction using the JHK diagram (Figure 2), since their disks produce no significant excess at those wavelengths. From this, we can conclude that G-1 is a late-K or early-M star with A3.5 mag (Forbrich & Preibisch 2007 classify it as a potential M-type star), and G-32 is a deeply embedded Class II object whose uncertain 2MASS photometry does not allow any extinction estimate. All the rest of objects are consistent with M stars and maybe a massive BD (M6-M8, CrA-432), with extinction A2 mag.
3.2 Dust mineralogy
Some of the disks observed show silicate emission features in the 8-13 and 20-30 m range in their IRS spectra. These features are produced by the small grains (6 m) in the warm (150-450 K), optically thin, disk atmosphere. In order to analyze the dust mineralogy in this layer, we fitted the spectra using the Two-Layer Temperature Distribution (TLTD) spectral decomposition routines developed by Juhász et al. (2008). This model is an improvement of the single- and two-temperature fitting methods (Bouwman et al. 2001; van Boekel et al. 2005). It reproduces the silicate emission using the sum of a multicomponent continuum (star, inner rim, disk midplane) assuming that the region where the observed radiation originates (both optically thin and thick) has a distribution of temperatures instead of a single one. The routine includes the dust species for which we have evidence of optically thin emission in the IRS wavelength range. These are five different dust species (amorphous silicates with olivine and pyroxene stoichiometry, forsterite, enstatite, silica) with sizes 0.1, 1.5, and 6.0 m (see Figure 3; Dorschner et al. 1995; Servoin & Piriou 1973; Jäger et al. 1998; Henning & Mutschke 1997; Preibisch et al. 1993), except for the enstatite grains, for which we only include 0.1 and 1.5 m grains. This is due to the fact that there is no evidence of large enstatite grains in disks (Bouwman et al. 2001; Sicilia-Aguilar et al. 2007), and also because the inclusion of a large enstatite component adds a spurious source of continuum that masks the more abundant amorphous grains, and extra features in the 13-14 m region that are rather produced by gaseous components (C2H2 and HCN; Carr & Najita 2008; the spectra of CrA-466, CrA-432, and G-87 show marginal detections of gas lines in this region). Amorphous carbon grains with sizes 0.1, 1.5 and 6.0 m are also included as a featureless contribution to the continuum. The mass absorption coefficients are derived from the material optical constants using the theory of distribution of hollow spheres for the crystalline dust (Min et al. 2005444Previous investigations show that this scattering model provides a relatively good fit to the silicate features (e.g., Bouwman et al. 2001). The application of more complicated dust models (e.g. Henning & Stognienko 1996; Voshchinnikov & Henning 2008) is beyond the scope of this paper.), and the classical Mie theory for spherical particles for the amorphous dust.
The observed flux-density at a given frequency is given by
| (1) |
where, and are the number of dust species and of grain sizes, respectively. The mass absorption coefficient of the dust species and grain size is represented by . is the Planck-function, is the power exponent of the temperature distribution and is the distance to the source. The subscript in the integration boundaries refers to the disk atmosphere. The continuum emission () is given by
| (2) | |||||
| (3) |
The first term on the right hand side describes the emission of the star the while the second and third terms describe the radiation of the inner rim and the disk midplane respectively. The meanings of the different parameters are summarized in Table 5. The parameters include the distance d (150 pc; Marraco & Rydgren 1981; Knude & Hog 1998) and the radius and effective temperature of the star and (estimated from the spectral type and luminosity of the sources). The highest temperature of each component (disk atmosphere, inner rim, midplane) is fitted, and the lowest temperature is calculated assuming that the contribution of the annulus with the corresponding temperature to the total flux is higher than 0.1%. Small variations in the disk model parameters (inner and outer disk temperatures, temperature exponents) do not produce significant changes in the extracted mineralogy, as the bulk of the silicate emission comes from a region with T150-450 K, and no dust exists beyond the dust sublimation temperature (1200 K). The exponents of the temperatures (qa, qm, qr), and the coefficients of each contribution (, , , ) are fitted (see details in Juhász et al. 2008 and more information in Table 5). To account for the errors in the IRS spectra, the fit of each object was repeated 100 times, adding random Gaussian noise to the original spectrum. The final silicate composition is obtained as the average of the whole set, and the errors are derived from the standard deviation, considering separately the positive and negative directions (Van Boekel et al. 2005; Sicilia-Aguilar et al. 2007). The estimated errors include therefore only the component due to the S/N and measurement errors in the spectra. Other sources of error, like those related to the presence of materials that are not included in our set of optical constants, or different grain shapes or chemical composition of the grains, could introduce systematic deviations that are harder to quantify and will be studied in detail in the future (Juhász et al. in prep.).
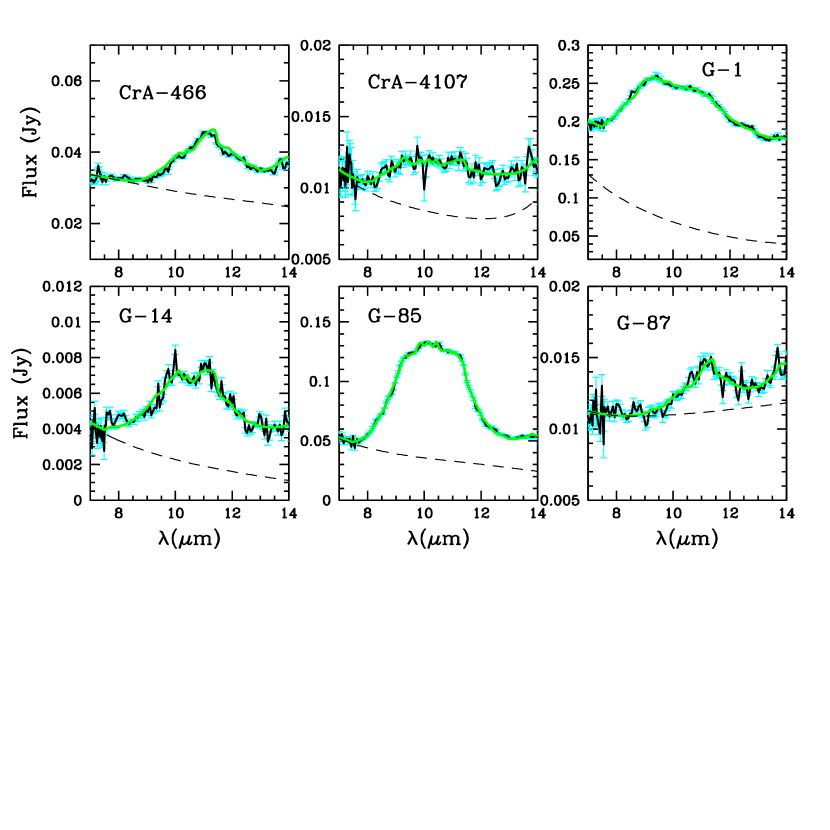
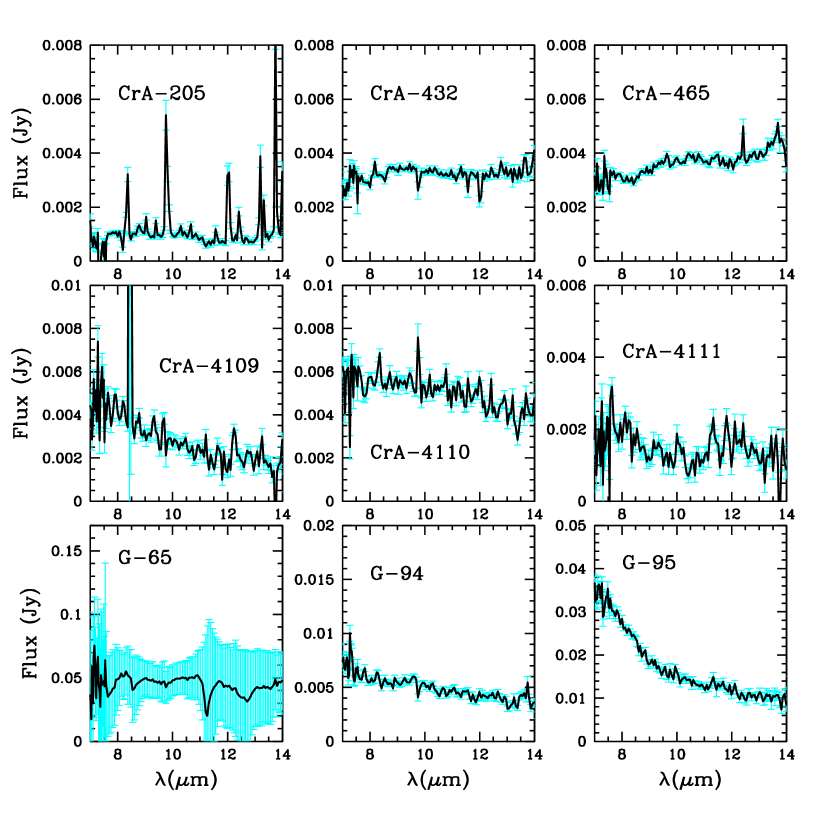
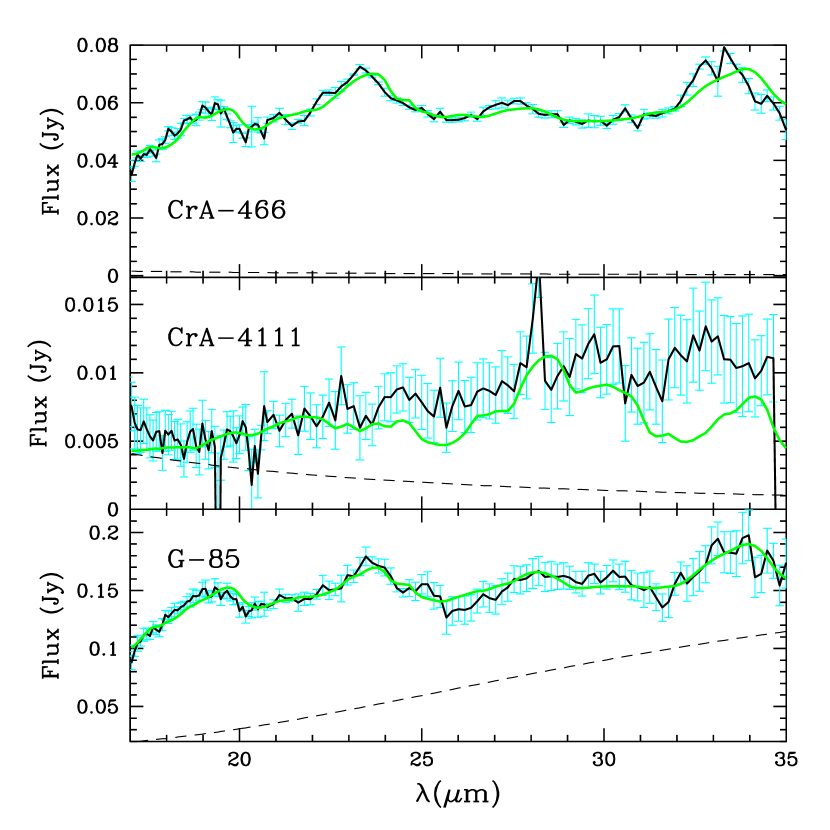
The silicate feature at 8-13 m is detected in 6 objects out of 13 (CrA-466, CrA-4107, G-1, G-14, G-85, and G-87; Figure 4). A zoom on the 10 m region for the objects without evidence of silicate feature is shown in Figure 5. The S/N is in all cases good enough to determine the presence or absence of silicate emission. The S/N is typically worse at longer wavelengths, so the silicate features in the 20-30 m range could be identified only in three of the spectra (CrA-466, CrA-4111, G-85; Figure 6), even though one of them (CrA-4111) shows no silicate emission in the 10 m region. Since the silicate signatures at 8-13 m and 20-30 m are dominated by material at different temperatures and thus, different radial distances from the star, having probably different compositions and grain sizes, it is not recommended to fit the whole spectrum with a single model. Therefore, we fitted the 7-14 m wavelength range for the shorter wavelengths, which offers the best compromise taking into account the optical constants and radial changes (Juhász et al. 2008) and the quality of the spectra. Juhász et al. (2008) suggest to use the 7-17 m region for fitting Herbig AeBe stars, but most of the spectra here have low S/N, so small errors in the order matching at 14 m produce small offsets in the final spectra and/or increased noise, which affects the final fit. Although the routine used for fitting includes a re-centering of the aperture that substantially improves order matching, the result is not perfect, specially for the weaker objects. For the longer wavelength features, we fit the 17-35 m region. The results of the fitting procedure are listed in Table 7, and displayed in Figures 4 (7-14 m region) and 6 (17-35 m region). The disks show typically a mixture of crystalline and amorphous silicates with different grain sizes, and a large variety of abundances, with no evident correlation between disk/stellar properties and silicate emission (Table 7). Evidence of potential differences in chemical composition of the grains (for instance, the presence of a fraction of Fe silicates instead of Mg silicates) could cause systematic offsets of the lines similar to those seen in CrA-466 at long wavelengths (Figure 6). Differences in grain porosity could also lead to similar effects (Voshchinnikov & Henning 2008).
Among the spectra with silicate emission in the 7-14 m region and low errors in the fitted grain composition (CrA-466, G-1, G-14, G-85), we observe a large variety of crystalline fraction, going from 3-5% for G-14 and G-1, to 20-30% for CrA-466 and G-87 (Table 8). The crystallinity fraction of CrA-466 and G-87 are higher than observed for the solar-type stars in the 4 Myr-old cluster Tr 37 (Sicilia-Aguilar et al. 2007), suggesting strong grain processing. High crystallinity fractions compared to those measured for disks around solar-type stars are typical in the disks around low-mass stars and BD (Apai et al. 2005). Very large crystalline grains are rare, probably because they form aggregates together with amorphous grains (Bouwman et al. 2006), but large amorphous grains (6 m) are found in many cases (e.g., Sicilia-Aguilar et al. 2007). Therefore, strong grain growth may result in part of the amorphous dust being too large to produce detectable features in the IRS spectra, while the crystalline grains may still be visible and seem to be more abundant. Inclination effects can also lead to variations in the silicate feature for objects close to edge-on, but given that these disks are very flattened, strong variations are expected to be rare.
In the long-wavelength region, only the spectra CrA-466 and G-85 could be fitted with an uncertainty 10% (Figure 6). CrA-466 is characterized by mostly large amorphous grains with pyroxene stoichiometry, and a small fraction of small forsterite and large silica grains. The crystalline fraction is therefore smaller (14%) than in the 10 m region, which could suggest the presence of larger quantities of small amorphous grains at large radii. For G-85, there are no significant differences between the 7-14 m and the 17-35 m region in crystallinity fraction, although the grain sizes tend to be smaller in the longer wavelength range, and the amorphous silicates are dominated by pyroxene-type components at shorter wavelengths, but olivine-type grains in the long wavelength range. The presence of strongly processed crystalline grains at long wavelengths suggests either some radial mixing at some stage in the evolution, or the importance of shocks in thermal annealing. Nevertheless, observations of larger samples of objects are required to draw statistically significant conclusions.
As we mentioned, half of the disks have no warm (150-450 K) small (6 m) grains in the disk atmosphere. For the transition objects (TO) or disks with inner holes, this may be in fact the effect of lack of dust in a physical clean hole (0.1-1 AU, depending on the spectral type). Nevertheless, 3 of the TO do show silicate emission (CrA-466, G-14, and G-87), and 3 of the disks without near-IR inner holes lack the feature (CrA-432, CrA-465, CrA-4110), so we probably require other physical conditions (strong grain growth, flattened disks) to explain this behavior. The lack of silicate features in flattened (but non-transitional) disks has been also observed in the 4 Myr-old cluster Tr 37 (Sicilia-Aguilar et al. 2007). The S/N is typically lower (10-20) in the 20-30 m range, and considering that the features are much weaker in this part of the spectrum, we cannot confirm nor rule out the presence of small silicate grains in the colder parts of the disk for the rest of the objects.
4 Discussion
4.1 Disks around very low-mass objects: “Transition” disks?
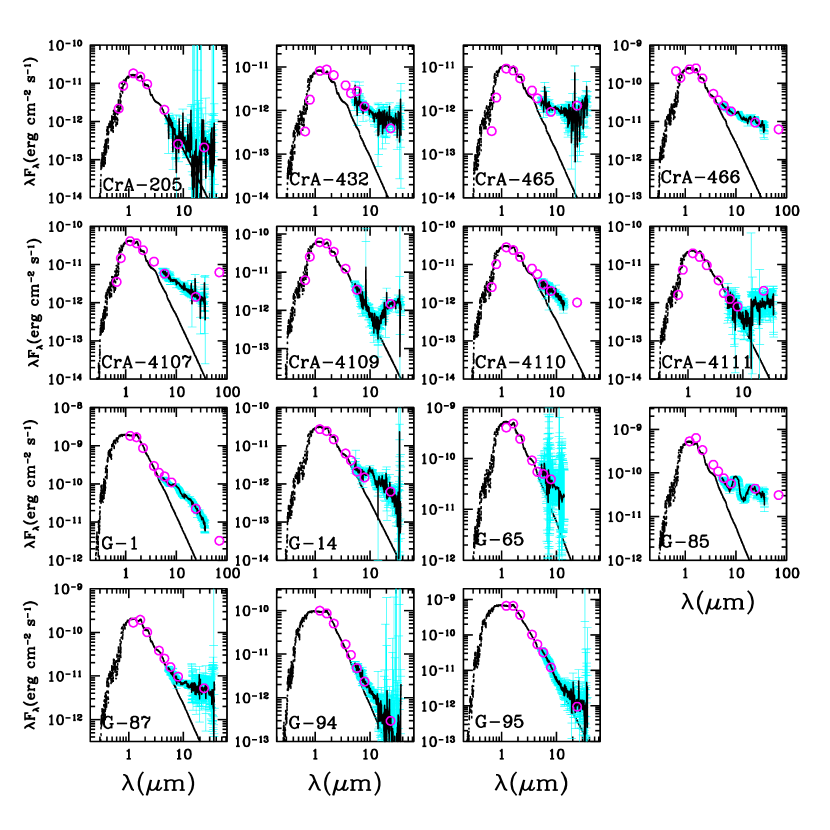
Since this study targeted candidate young objects based on X-ray or optical photometry, which are not biased towards systems with IR excesses from circumstellar disks, it is possible to estimate the disk fraction for low- and very-low mass objects in the cluster. As mentioned in Section 2.1, the X-ray survey is complete down to the spectral range considered here (M8) within the Chandra field, which is totally covered by the IRAC and MIPS maps (Section 2.4). The stars/BD with SEDs consistent with young Class II and Class III sources and TO, clearly identified via JHK and IRAC/MIPS photometry (Figures 7 and 8) sum up to 20 objects. They are all M0 stars or later, except maybe G-1, which could be a late-K or early-M star. Therefore, this sample contains objects with later spectral types than the Haisch et al. (2001), Sicilia-Aguilar et al. (2006a), and Hernández et al. (2007a) studies, which were done for solar-type (G, K, early M) stars.
The IRAC color-color diagram (Figure 9) shows colors consistent with typical Class II disks in Taurus, together with some transitional disks and Class III-like objects. From the shape of the SED and the wavelength at which the IR excess starts, 7 are Class II objects (with IR excess starting before 6 m, CrA-432, CrA-465, CrA-4107, CrA-4110, G-1, G-32, and G-85), 6 are Class III objects (no IR excess, or only marginal 24 m excess detected, CrA-453, G-30, G-49, G-94, G-95, and G-102), and 7 are TO (with no IR excess at wavelengths shorter than 6 m, and sometimes, longer; CrA-205, CrA-466, CrA-4109, CrA-4111, G-14, G-65, G-87). This results in a disk fraction 70%, of which 50% of the disks are TO. Note that most of the Class II objects (all but CrA-432 and G-32) have no excess at JHK nor at 3.6 m, so their disks are very different from the typical Class II disks with JHK colors falling within the “CTTS locus” (Meyer et al. 1997). The disk fraction for the Coronet cluster is slightly lower than expected for solar-type stars in a 1 Myr-old region with significant cloud material and several embedded Class I and Class 0 objects (usually 80% in JHKL surveys; Haisch et al. 2001; Hernández et al. 2007a).
There is a controversy about the timescales for disk dissipation around very low-mass stars and BD. Most studies suggest a longer lifetime or larger disk fractions for the very low-mass objects compared to solar-type stars (Sterzik et al. 2004; Bouy et al. 2007), but some other studies have claimed similar timescales (Luhman et al. 2005; Damjanov et al. 2007) and even shorter lifetimes for the M-type stars (Lada et al. 2006). An important problem estimating disk fractions is the wavelength at which the excess is measured, and the completeness of the observations at the given wavelength. In the Coronet Cluster, only 1/3 of the disks show excess at JHKL wavelengths similar to the excesses tracked by Haisch et al. (2001). This is a significantly lower fraction than for solar-type stars with the same age, for which only 5-10% of the disks lack near-IR excesses (e.g., Taurus; Hartmann et al. 2005), and has been pointed out already for BD (Luhman et al. 2007). Lada et al. (2006) calculated their final disk fractions for “optically thick” disks only, which excludes all the TO and the flattened (“anemic”) disks. The fact that a large fraction of the disks around the very low-mass Coronet cluster members are transitional or “anemic” disks, using the definitions in Lada et al. (2006), can explain the controversies in disk fraction for very low-mass objects. In addition, the morphology of the SEDs in the Coronet requires observations at wavelengths longer than 3.6 m to detect the presence of circumstellar material accurately. The lack of complete long-wavelength IR data can also contribute to the uncertainty in disk fractions around very low-mass objects. Given the lower luminosities of M-stars and BD, the SEDs can look flattened or transitional after a little evolution in the innermost 0.1-1 AU region, even if the rest of the disk is flared and optically thick.
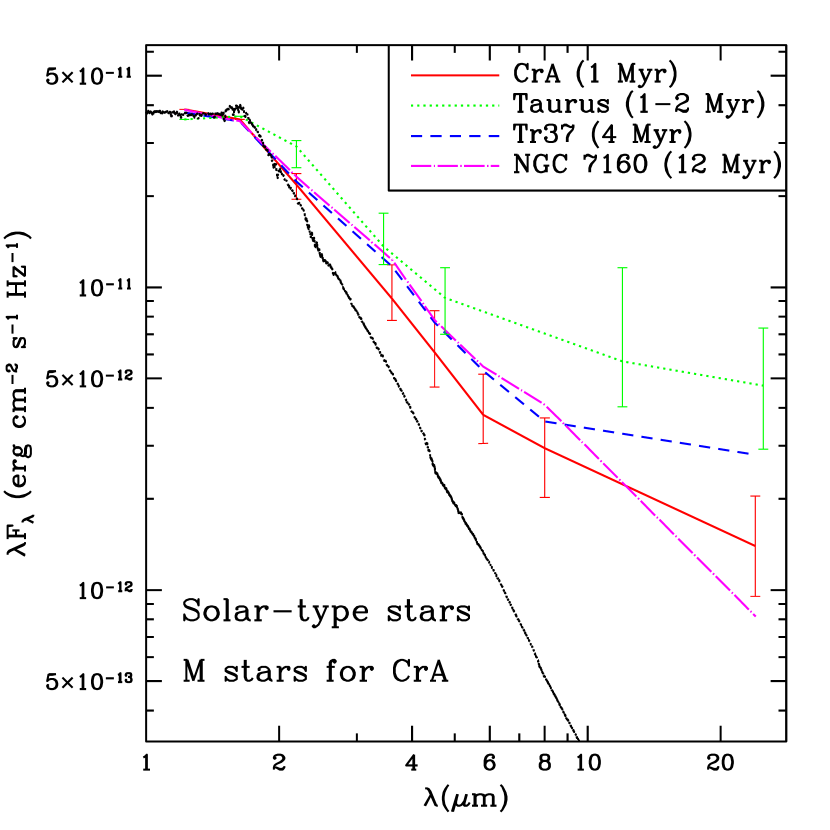
A comparison of the median disk SED of different well-known regions and the Coronet Cluster (Figure 10 left) is a good indicator of the differences in disk morphology between M-type and solar-type stars. The median SED shows that the typical disks in the Coronet cluster are very different from the disks around solar-type stars in regions with similar ages (Taurus; Kenyon & Hartmann 1995; Hartmann et al. 2005) and more similar to older regions (Tr 37 and NGC 7160; Sicilia-Aguilar et al. 2006a). Most of the Class II SEDs in the Coronet cluster have slopes close to flat disks (Fλ , optically thick but geometrically thin disk; Hartmann 1998), which is very different from the SEDs of embedded clusters with similar age (e.g., the Tr 37 globule, Sicilia-Aguilar et al. 2006a). Nevertheless, the median SEDs for the older clusters in Figure 10 (left) were calculated for solar-type stars, with spectral types G to early M, very different from the M0-M8 spectral types in the Coronet cluster. If the radial distance traced by the IR fluxes, and/or the disk morphology, and/or their evolution vary with the mass or spectral type of the star, comparing objects with different masses may mask the real time evolution with age, or other effects such as influence of the environment or initial conditions.
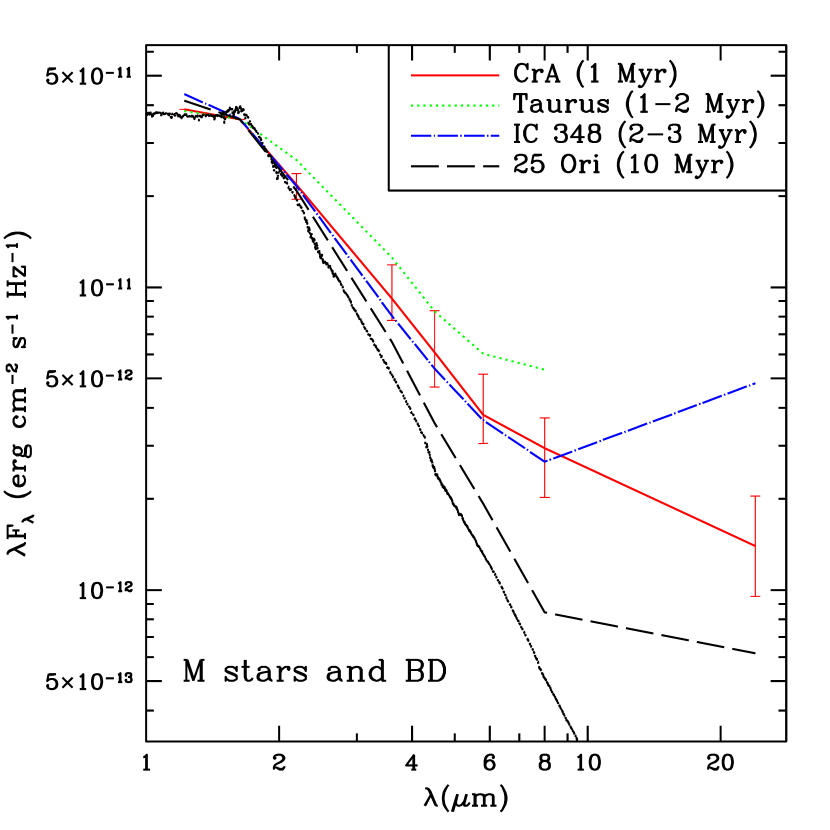
To explore the SED morphology of other very low-mass stars and BD, we trace the median disk SED for objects with M0-M8 spectral types in several regions for which accurate spectral types, extinctions, and Spitzer data were available: Taurus (23 objects, median spectral type M3, 1-2 Myr; Kenyon & Hartmann 1995; Briceño et al. 1998; Hartmann et al. 2005), IC 348 (128 objects, median spectral type M4, 2-3 Myr; Luhman et al. 2003; Lada et al. 2006); 25 Ori (4 objects, median spectral type M3, 10 Myr; Briceño et al. 2007; Hernández et al. 2007b). The median SED was computed after correcting for extinction for each object. For Taurus and 25 Ori, we used the average AV=1 mag and AV=0.29 mag in the cases where the individual extinction was not known. Since the typical extinctions are low in both regions, individual variations are not significant at IR wavelengths. As in the case of the Coronet cluster, we did not exclude TO disks, if their excesses at mid-IR were comparable to normal, optically thick disks (flared or flat). The median SEDs are displayed in Figure 10 (right). All the regions, except Taurus, show a median SED at 6 m consistent with an optically thick, geometrically thin disk ( F; Hartmann 1998). For 25 Ori, 3 of the disks are TO with no excess at 8 m, which explains the photospheric fluxes down to this wavelength. The comparison with the median SED for solar-type stars in these (Lada et al. 2006) and the regions in Figure 10 (left) confirms the differences in SED morphology depending on the spectral type of the central object.
The main conclusion from the median SED analysis is that flattened and transitional disks are far more common among the low-mass objects than among solar-type stars at any given age and in most regions, extending the results of Megeath et al. (2005) and McCabe et al. (2006). One reason for this behavior could be that a given IR wavelength traces a zone much closer to the star in a mid- or late-M star than in a solar-type star, so any signs of disk evolution (grain growth, disk flattening, inner holes) affecting the innermost disk (0.1-1 AU) will produce larger changes in the near-IR flux for the low-mass objects than for solar-type stars. On the other hand, the fact that the median SED of the young Coronet cluster is very close to a flat disk suggests that differences in the inner disk structure (maybe caused by lower disk masses and the lack of dead zones; Hartmann et al. 2006) and/or differences in the initial conditions at the time of formation (for instance, in the angular momentum of the cores that form very low-mass stars; Dullemond et al. 2006) may shape the disks already at a very early stage. In addition, the environment (high-mass versus low-mass star forming regions; Luhman et al. 2008) could affect both the formation and the evolution of the objects and their disks, so future observations of low-mass objects in high-mass star forming regions should be performed to compare their properties with those in relatively isolated, low-mass star-forming regions.
The large number of TO needs also to be considered. Typically, TO represent only 5-10% of the total number of disks around solar-type stars (Sicilia-Aguilar et al. 2006a; Hartmann et al. 2005), which suggests that their lifetimes are less than a tenth of the lifetime of the optically thick disks, of the order of 105-106 years. The situation is similar in young (e.g., Taurus, 1-2 Myr; Hartmann et al. 2005) and intermediate-age (e.g. Tr 37, 4 Myr; Sicilia-Aguilar et al. 2006a) clusters, so disks with inner holes are thought to be on a rapid, transitional phase between Class II and Class III objects, lasting less than 1 Myr. The rapid transitional phase is usually interpreted as planetesimal or planet formation (Quillen et al. 2004), and/or strong dust coagulation to pebble-sized grains (starting in the inner disk and progressing rapidly to the rest of the disk), and/or the effect of photoevaporation by the ultraviolet radiation of the central star (Alexander et al. 2006a,b). Timescales in the inner disk are shorter, so the evolution would occur faster in the innermost part (Hayashi et al. 1985), and extend rapidly to the rest. In certain cases, the inner holes may be also produced by close-in companions (e.g. CoKu Tau/4; Ireland & Kraus 2008).
The flux excesses over the photosphere of most TO (Table 9) are consistent with optically thick disks with inner holes rather than with debris disks (Kenyon & Bromley 2005), except for the small excesses around some of the Class III sources. Therefore, they are most likely protoplanetary disks with inner holes (“transition objects”) than evolved, reprocessed, debris disks, although most debris disks studies have been done for intermediate-mass and solar-type stars. The large fraction of TO (50%) in the Coronet cluster points to a much longer “transitional” phase, with lifetimes of the same order of magnitude as the typical disk lifetimes. This is in contradiction with clearing up of inner holes via photoevaporation, which would remove the remaining disk in 105-106 years after the innermost disk has been photoevaporated (Alexander et al. 2006a,b). Observations of M-type stars and BD with disks have suggested that TO and disks with inner holes are more frequent around them (Mohanty et al. 2004; Allers et al. 2006; McCabe et al. 2006; Bouy et al. 2007), but so far the number of objects considered was significantly smaller than in the Coronet cluster. As with the median SED analysis, the youth of the Coronet cluster suggests that some of the disks could be already formed as “flattened” disks or “transition-like” structures. More observations in different regions are needed to explore whether the differences in disk structure are related to evolution around a very low-mass object, and/or to the formation of very low-mass objects with disks, and/or the environment in a low-mass star-forming cluster.
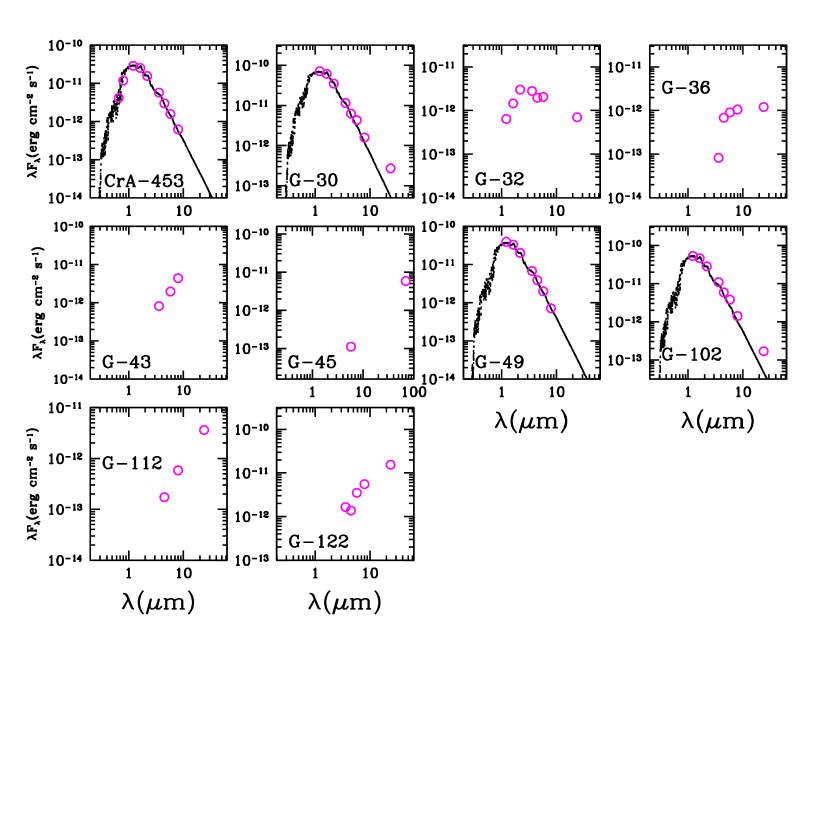
Finally, 5 objects are consistent with very embedded Class II or Class I sources according to their IRAC and MIPS colors (G-36, G-43, G-45, G-112, and G-122; see Figure 8 and notes to Table 1), and 20 more may be very embedded cluster members (mostly Class I, maybe Class 0 objects), with incomplete IRAC/MIPS data (due to low S/N or saturation by nearby extended sources). None of the very embedded sources nor potential embedded sources is associated with the millimeter clumps detected in the region (Henning et al. 1994; Chini et al. 2003), probably because of the low mass of the objects, as the surveys were mostly sensitive to masses typical of HAeBe and intermediate-mass TTS. In addition, the SEDs of several sources (see Table 1) and their positions within the cloud suggest that they are probably contaminating extragalactic objects. For one of them, G-115, the optical spectrum confirms that it is a quasar at redshift 0.62. The rest of them were not detected at optical wavelengths.
4.2 Accretion in the Coronet cluster
The optical spectroscopy can be used to estimate the fraction of accreting disks by measuring the H equivalent width (EW, see Table 6, Figure 11). EW larger than 10 Å or 20 Å in emission indicates active accretion for objects with spectral types K3-M2 and later than M2, respectively (White & Basri 2003; a more precise classification is given by Barrado y Navascués & Martín 2003). The H emission lines of accreting stars are usually broadened by the accretion and winds, so the line profiles and the velocity wings are an additional criterion to detect accretion (Muzerolle et al. 1998a, 2005; Natta et al. 2005), although the very low-mass objects tend to have narrower H profiles because of their smaller gravitational potential (Muzerolle et al. 2005). The H EW criterion is sometimes unable to detect accretion in objects with very low accretion rates (10-9 M⊙/yr; Sicilia-Aguilar et al. 2006b), but the intermediate resolution of FLAMES reveals H line broadening larger than 120 km/s. The Ca II IR triplet ( 8498, 8542, 8662 Å) is a marker of strongly accreting objects, and is included in the spectral range covered with FLAMES, but it is not detected in any of the sources except for a marginal detection in G-85 (3-4, with EW -0.6, -1.3, and -0.8 for the lines 8498, 8542, and 8662 Å, respectively). This suggests that the accretion rates in the Coronet cluster are low to moderate (10-8-10-9 M⊙/yr), as is typically observed for very low-mass stars and BD (Natta et al. 2004).
H emission is detected in 21 objects (Figure 11), although the detection is marginal in G-87 and G-133. The star G-95 is a rare case, as it does not show any H emission but a small absorption, which is very unusual even for a M1-type Class III object, since young M stars have very active chromospheres. Inclination and, to a lesser extent, rotation, may affect the line profiles and width (Muzerolle et al. 1998b, 2001), but the presence of absorption instead of emission is not easy to reproduce by just adjusting these parameters. Nevertheless, the status of G-95 as young star (and thus, cluster membership) can be inferred from the presence of Li I absorption. The results are that 10 out of 14 stars are weak-lined T Tauri stars (WTTS) class, with small H EW and no signs of line broadening nor other accretion indicators. This gives an accretion fraction of 30%, which is lower than observed even in more evolved regions (Sicilia-Aguilar et al. 2006b). Nevertheless, some of these sources could be accreting at very low rates (10-10-10-12 M⊙/yr), which produce small EW and no significant line broadening for the resolution of FLAMES (Muzerolle et al. 2005). Such low accretion rates are relatively normal for low-mass objects (Natta et al. 2004; Luhman et al. 2007). Among the TO objects, CrA-466 has strong EW indicative of accretion, and G-65 shows broad H, despite the small EW, so it is likely to be accreting at a low rate. All the Class II sources with near-IR excess are accreting, except for CrA-4110, which shows narrow H with small EW (it could be accreting at a low rate, 10-10-10-12 M⊙/yr). None of the Class III objects shows any indications of accretion. If we extrapolate those results to the total sample of Class III, Class II and TO, we obtain an accretion fraction 40%, which is lower than observed for solar-type stars in similarly young regions. This is consistent with the observations in other regions (Muzerolle et al. 2003; Mohanty et al. 2005; Bouy et al. 2007), which also revealed a low fraction of accreting disks for the very low-mass members.
We find the same relation between accretion rates and SED morphology than in the older cluster Tr 37 (Sicilia-Aguilar et al. 2006b): Some of the TO have ongoing accretion despite their lack of near-IR excess, while some normal-looking Class II sources have very low accretion rates despite not having inner holes. Therefore, we once more observe that the “classical” distinction between CTTS and WTTS based on the H EW does not always correspond to Class II and Class III objects according to their IR excesses (Hillenbrand 2008). Not only some objects with low accretion rates show “weak” (but broad) H emission (Sicilia-Aguilar et al. 2005, 2006b), but we find accreting and non-accreting objects among the disks with inner holes, and disks without holes but with very low accretion rates.
4.3 X-ray properties of the very low-mass objects
The temporal X-ray properties of each source were investigated by examining the arrival times of the photons from a given source using the software tool Event Browser555http://www.astro.psu.edu/xray/docs. The mean arrival rate of photons for each source was computed. If the arrival rate of events exceeded this expected rate by more than 1.3 as determined by Poisson probability of such an excess (Gehrels 1986), then the source was flagged as a flaring source and the length of the excess flux was determined as well as the Poisson probability of the excess. Sources G-28, G-45, G-78 and G-108 are only visible as flare sources, there was no steady flux. These results are shown in Table 2. The complete census of X-ray sources and their properties will be published in a separate work.
The hardness ratio (HR) and its error were computed for each source. The HR is defined as HR=(C(2-8)-C(0.5-2))/C(0.5-8), where C(x-y) is the background subtracted flux in the x to y keV energy band and the error for low count sources was computed using the method of Lyons (1991). The absorption column to the source, NH, was either determined by a fit to the spectrum using the XSPEC software (Arnaud 1996) for sources with more than 100 photons or by computing the average energy of the lowest two photon energies (E2ave) from the source for source with 3 - 100 photons. The computation of NH was made using a power-law spectrum with a photon index of -2 and a series of trial values of NH. Other spectral forms such as bremsstrahlung and plasma models provide almost identical curves, implying that this method is fairly insensitive to spectral shape. The two lowest energy photons formed a fraction of the total flux which could be read off of the model curves. The E2ave in the source spectrum was then used to determined which NH best matched this energy. The determination of NH upper and lower bounds was calibrated against photons selected at random from bright sources where the NH was determined by spectral fitting in XSPEC. Distributions of the lowest two energy counts were created for sources with 3, 6, 10, 20, and 40 photons to estimate the errors using this method. The results were tabulated and a linear regression fit was made to E2ave , and to the upper NH upper and lower bounds to the E2ave from the distributions as a function of source intensity and E2ave. A more complete description of this method is being prepared for publication. The errors in Table 2 are the 95% errors. The luminosities were based on the unabsorbed flux either computed using the observed flux, absorption and an assumed spectrum of a 2 keV plasma and the PIMM’s Tool666http://heasarc.gsfc.nasa.gov/Tools/w3pimms.html, or from XSPEC by freezing all the parameters and setting the absorption to zero. The distance was taken as 130 pc for the estimates.
The column density NH can be used to estimate the extinction independently from the results derived from the colors and spectral types. Using the results of Vuong et al. (2003), that NH/AJ=5.60.4 1021 cm mag-1, and the conversion AJ/AV=0.282 in Cardelli et al. (1989), we obtain AV (see Table 2). These values roughly agree with the values derived previously, although the predicted extinctions are lower for some of the most extincted objects. Since the standard relations between NH and AV are derived for the interstellar medium, differences in dust and gas in the circumstellar environment may be responsible for this effect, as well as the larger uncertainties in the derivation of NH from X-ray data. In any case, we prefer the results derived from spectral types and JHK photometry, which are in very good agreement with the fitted SEDs.
Most of the Class II and Class III sources show negative HRs corresponding to moderate absorption and temperature around 2 - 10 keV. The TO and Class I sources on the other hand show a mixture of both negative and positive HRs. There is a correlation between the X-ray luminosity and HR and the IR colors (Figure 12). Sources with smaller IR excess (Class III and TO) tend to show higher X-ray luminosity and specially, more negative HR. This correlation is likely caused by extinction effects, and could also suggest differences in the orientation of the disks (closer to edge-on if the X-ray absorption is stronger). Part of the difference in X-ray luminosity may be caused by the presence of close-in binaries, which have also a noticeable effect on disks (Bouwman et al. 2006). So far there is no information about binarity among the Coronet cluster members, but the holes in some of the TO could be produced by close-in binaries (Ireland & Kraus 2008). The Class I sources also display a large range of NH, possibly because these sources are deeper in the cloud or their disks/envelopes are adding some absorption. Many of the X-ray sources show considerable variability over longer time intervals. Seven additional observations were made of this region with some sources fading below detectability and others brightening.
4.4 HH objects with X-ray emission in the Coronet cluster
The whole CrA region is characterized by an extended, cometary-like nebulosity, which becomes very optically thick near the star R CrA (Graham 1992; Henning et al. 1994; Cambrésy 1999). There are numerous Class I and Class 0 objects within the cloud (Henning et al. 1994; Chen et al. 1997), and a large number of shocks and HH objects, mostly detected via their optical emission (Wang et al. 2004). Some HH objects are known to produce X-ray emission (Pravdo et al. 2001; Favata et al. 2002; Raga et al. 2002), although previous studies of X-ray emission in the Coronet cluster (Forbrich & Preibisch 2007) had not found any relation between the known HH objects and the X-ray sources.
Using the optical spectra, we found that two of the X-ray detected objects (G-64 and G-80) show the forbidden [S II] emission lines at 6716 and 6731 Å, characteristic of shocked material, as well as [N II] emission at 6548 and 6583 Å (Figure 13; Hamann 1994). In the case of G-64, Spitzer data reveals a nearby faint source, probably an embedded Class I source. G-64 is also located near a known HH object, HH 96 (19:01:41.87 -37:00:57.3; Wang et al. 2004). On the other hand, G-80 is not detected at any of the Spitzer wavelengths, being probably a HH knot in the cloud. Its H profile, as well as the [N II] and [S II] profiles, show the red tails characteristics of HH objects. G-80 is relatively far from the other known HH objects, and given the large number of sources in its surroundings, it is not easy to identify the object that produces it.
The EW of the lines are listed in Table 10. The line ratios are thus 0.84 and 1.22 for G-64 and G-80, respectively. The line ratios depend on the electron density and (weakly) on the temperature (Osterbrock 1989). Assuming a shock temperature of 10,000 K, the ratios observed in the G-64 and G-80 suggest electron densities of the order of 4102 cm-3 and 103 cm-3, respectively. These values are slightly lower than the typical electron densities observed in shocks near TTS (Hamann 1994), which tend to be close to saturation (5103 cm-3). Given the weak dependence of the electron density on the temperature as T-1/2, temperature variations cannot account for this difference, so we may conclude that electron densities in the CrA cloud are lower than the typical values.
5 Conclusions
The study of the disks around very low-mass objects in the Coronet cluster reveals significant differences with other regions. The disk fraction is smaller (70%) than in clusters with a similar age, and more striking, about 50% of the disks show “transitional” SEDs with inner holes (TO). The SEDs of the disks without inner holes are significantly flatter than observed in similarly young clusters and even in regions a few Myr older (Sicilia-Aguilar et al. 2006a), and the median SED is close to that of a flat disk (Fλ ). The disks with no inner gaps show typically evidence of accretion, while only some of the TO are actively accreting. In any case, the H EW and profiles suggest that accretion rates are probably low to moderate (10-8-10-9 M⊙/yr), as it is common for very low-mass objects.
Since the members of the Coronet cluster have later spectral types than typical disks studies (M0-M7.5 instead of G-early M), our work suggests that M-type stars and BD tend to have flatter disks and inner holes with a significantly higher frequency than solar-type stars. Partial evidence of this had been suggested in other studies, based on smaller samples of stars (Megeath et al. 2005; McCabe et al. 2006; Lada et al. 2006; Allers et al. 2006; Morrow et al. 2007).
The fact that most disks around the very low-mass members of the Coronet cluster have inner holes or are strongly flattened may be responsible for the controversy about disk fractions for very low-mass stars and BD. It also reveals that observations at mid-IR wavelengths are required in order to determine accurately the disk fractions for M-type stars and BD.
The large fraction of “transitional” disks suggest a lifetime comparable to the typical disk lifetimes, which is inconsistent with the rapid timescales due to disk photoevaporation (Alexander et al. 2006a,b), and with the relatively short lifetimes inferred for solar-type stars in other regions (Hartmann et al. 2005; Sicilia-Aguilar et al. 2006a). Therefore, at least some of the “transitional” disks may not be in a short-lived, intermediate evolutive stage.
The youth of the Coronet cluster members suggests that part of these disks could have been formed already as flattened or “transition-like” structures. Whether this effect is due to the formation conditions of these low-mass objects in a low-mass star-forming region like the Coronet cluster (angular momentum of the collapsing cores, presence of binary companions), or is a consequence of a different evolutive path of disks around the less massive sources, needs to be explored by targeting large samples of very low-mass objects in older regions and in massive star-formation environments.
Finally, the optical spectroscopy confirms that one of the X-ray sources in the Coronet cluster corresponds to a newly detected HH object.
References
- Alexander et al. (2006a) Alexander, R., Clarke, C., Pringle, J, 2006a MNRAS, 369, 216
- Alexander et al. (2006b) Alexander, R., Clarke, C., Pringle, J, 2006b MNRAS, 369, 229
- Allers et al. (2006) Allers, K. N.; Kessler-Silacci, J. E.; Cieza, L. A.; Jaffe, D. T., 2006, ApJ 644, 364
- Arnaud (1996) Arnaud, K.A., 1996, ASPC, 101, 17
- Apai et al. (2003) Apai, D., Pascucci, I., Henning, T. et al., 2002, ApJ 573, L115
- Apai et al. (2005) Apai, D.; Pascucci, I.; Bouwman, J.; Natta, A.; Henning, Th.; Dullemond, C. P., 2005, Sci, 310, 834
- Barrado y Navascués & Martín (2003) Barrado y Navascués, D., & Martín, E., 2003, AJ 126, 2997
- Bate et al. (2005) Bate, M., et al. 2005, MNRAS, 356, 1201
- Bessell & Brett (1988) Bessell, M., & Brett, J., 1988 PASP 100, 1134
- Bessell et al. (1998) Bessell, M. S.; Castelli, F.; Plez, B., 1998, A&A, 333, 231
- Bouwman et al. (2001) Bouwman, J., Meeus, G., de Koter, A., Hony, S., Dominik, C., Waters, L., 2001, AA, 375, 950
- Bouwman et al. (2006) Bouwman, J.; Lawson, W. A.; Dominik, C.; Feigelson, E. D.; Henning, Th.; Tielens, A. G. G. M.; Waters, L. B. F. M., 2006, ApJ, 653, 57
- Bouwman et al. (2008) Bouwman, J., Henning, Th., et al. 2008, ApJ in press
- Bouy et al. (2007) Bouy, H., Huélamo, N., Martín, E., Barrado y Navascués, D., Sterzik, M., & Pantin, E., 2007, A&A 463, 641
- Briceño et al. (1998) Briceño, C., Hartmann, L., Stauffer, J., Martín, E., 1998, AJ, 115, 2074
- Briceño et al. (2007) Briceño, C., Hartmann, L., et al., 2007, ApJ, 661, 1119
- Cambrésy (1999) Cambrésy, L., 1999, A&A, 345, 417
- Cardelli et al. (1989) Cardelli, J., Clayton, G., Mathis, J., 1989, ApJ, 345, 245
- Carr & Najita (2008) Carr, J., Najita, J., 2008, Science, 319, 1504
- Casey (1998) Casey, B. W.; Mathieu, R. D.; Vaz, L. P. R.; Andersen, J.; Suntzeff, N. B., 1998, AJ, 115, 1617
- Chen et al. (1997) Chen, H.; Grenfell, T. G.; Myers, P. C.; Hughes, J. D., 1997, ApJ, 478, 295
- Chini et al. (2003) Chini, R. et al. 2003, A&A, 409, 235
- Dahm & Hillenbrand (2007) Dahm, S., Hillenbrand, L., 2007, AJ, 133, 2072
- Damjanov et al. (2007) Damjanov, I., Jayawardhana, R., et al. 2007, ApJ, 670, 1337
- De Geus (1992) De Geus, E. J., 1992, A&A, 262, 258
- De Muizon et al. (1980) De Muizon, M., Rouan, D., Lena, P., Nicollier, C., Wijnbergen, J., 1980, AA, 83, 140
- De Zeeuw et al. (1999) De Zeeuw, P., et al. 1999, AJ, 117, 354
- Dorschner et al. (1995) Dorschner, J, Begemann, B., Henning, T., Jäger, C., & Mutschke, H., 1995, A&A, 300, 503
- Dullemond et al. (2006) Dullemond, C., Natta, A., Testi, L., 2006, ApJL 645, 69
- Favata et al. (2002) Favata, F.; Fridlund, C. V. M.; Micela, G.; Sciortino, S.; Kaas, A. A., 2002, ASPC 277, 467
- Fazio et al. (2004) Fazio, G.G., Hora, J.L., Allen, L.E., & 62 more coauthors, 2004, ApJS, 154, 10
- Flaccomio et al. (2006) Flaccomio, E., Micela, G., Sciortino, S., A&A, 455, 903
- Freeman et al. (2002) Freeman, P. E., Kashyap, V., Rosner, R., Lamb, D. Q. 2002, ApJS, 138, 185
- Fernández & Comerón (2001) Fernández, M., Comerón, F., 2001, A&A 380, 264
- Forbrich & Preibisch (2007) Forbrich, J.; Preibisch, T., 2007, A&A 475, 959
- Furlan et al. (2005) Furlan, E., Calvet, N., et al., 2005, ApJ, 621, L129
- Garmire & Garmire (2003) Garmire, G., & Garmire, A., 2003, Astron. Nachr. 324, 153
- Garmire et al. (2003) Garmire, G. P., Bautz, M. W., Ford, P. G., Nousek, J. A., & Ricker, G. R., 2003 Proc. SPIE 4851,28.
- Gehrels (1986) Gehrels, N., 1986 ApJ 303, 336
- Gizis et al. (2005) Gizis, J., Shipman,H, Harvin, J., 2005, ApJ 630, L89
- Graham (1992) Graham, J., 1992, ESO Scientific Report, p.185
- Graham (1993) Graham, J.A., 1993, PASP 105, 688
- Haisch et al. (2001) Haisch, K., Lada, E., & Lada, C., 2001, ApJ, 553, 153
- Hamaguchi et al. (2005a) Hamaguchi, K., et al. 2005a, ApJ 618, 360
- Hamaguchi et al. (2005b) Hamaguchi, K., et al., 2005b, ApJ 623, 291
- Hamann (1994) Hamann, F. , 1994, ApJS, 93, 485
- Hartmann (1998) Hartmann, L.: Accretion Processes in Star Formation, Cambridge University Press, 1998.
- Hartmann et al. (2005) Hartmann, L., Megeath, S.T., Allen, L., Luhman, K., Calvet, N., D’Alessio, P., Franco-Hernández, R., Fazio, G., 2005, ApJ, 629, 881
- Hartmann et al. (2006) Hartmann, L., D’Alessio, P., Calvet, N., & Muzerolle, J., 2006, ApJ, 648, 484
- Hayashi et al. (1985) Hayashi, C., Nakazawa, K., & Nakagawa, Y. 1985, in Protostars and Planets II, eds. D. Black & M. Matthews (Tucson: University of Arizona Press), 1100
- Henning et al. (1994) Henning, Th.; Launhardt, R.; Steinacker, J.; Thamm, E., 1994, A&A, 338, 223
- Henning & Stognienko (1996) Henning, Th.& Stognienko, R., 1996, A&A, 311, 291
- Henning & Mutschke (1997) Henning, Th.& Mutschke, H., 1997, A&A, 327, 743
- Henning (2008) Henning, Th., 2008, Physica Scripta in press
- Hernández et al. (2007a) Hernández, J., Hartmann, L., Megeath, S.T.,et al., 2007b, ApJ, 662, 1067
- Hernández et al. (2007b) Hernández, J., Calvet, N., et al., 2007, ApJ, 671, 1784
- Higdon et al. (2004) Higdon, S., et al., 2004, PASP, 116, 975
- Hillenbrand (2008) Hillenbrand, L. A., 2008, Physica Scripta in press
- Houck et al. (2004) Houck, J., et al. 2004, ApJS, 154, 18
- Ireland & Kraus (2008) Ireland, M., Kraus, A., 2008, ApJ, 678, 59
- Jäger et al. (1998) Jäger, C., Molster, F., Dorschner, J., et al., 1998, A&A 339, 904
- Jäger et al. (2003) Jäger, C., Fabian, D., et al. 2003, A&A, 401, 57
- Jayawardhana et al. (2002) Jayawardhana, R., Mohanty, S., Basri, G., 2002, ApJ 578, L141
- Jayawardhana et al. (2003) Jayawardhana, R., Mohanty, S., Basri, G., 2003, ApJ 592, 282
- Kenyon & Hartmann (1995) Kenyon, S.J. & Hartmann, L., 1995, ApJS , 101, 117
- Kenyon & Bromley (2005) Kenyon, S.J., & Bromley, B.C., 2005, AJ, 130, 1
- Kessler-Silacci et al. (2007) Kessler-Silacci et al., 2007, ApJ,659,680
- Kirkpatrick et al. (1995) Kirkpatrick, J. D.; Henry, T. J.; Simons, D. A. 1995, AJ, 109, 797
- Klein et al. (2003) Klein, R., Apai, D., Pascucci, I., Henning, Th., Waters, L., 2003, ApJ, 593, 57
- Knude & Hog (1998) Knude, J.; Hog, E. 1998, A&A 338, 897
- Lada et al. (2006) Lada, C., Muench, A., et al., 2006, AJ, 131, 1547
- López-Martí et al. (2005) López-Martí, B., Eislöffel, J., Mundt, R., 2005, AA, 444, 175
- Loren (1979) Loren, R. B., 1979, ApJ, 227, 832
- Luhman et al. (2003) Luhman, K.;Stauffer, John R.; Muench, A. A.; Rieke, G. H.; Lada, E. A.; Bouvier, J.; Lada, C. J., 2003, ApJ, 593, 1093
- Luhman et al. (2005) Luhman, K., Lada, C., Hartmann, L., et al., 2005, ApJ, 631, 69
- Luhman et al. (2007) Luhman, K., Joergens, V., Lada, C., Muzerolle, J., Pascucci, I., White, R., 2007, Protostars and Planets V, B. Reipurth, D. Jewitt, and K. Keil (eds.), Tucson: University of Arizona Press, p443-457
- Luhman et al. (2008) Luhman, K., Allen, L., Allen, P., et al. 2008, ApJ, 675, 1375
- Lyons (1991) Lyons, L., 1991, Data Analysis for Physical Science Students, Cambridge University Press, Cambridge, UK
- Martín et al. (1996) Martín, E., Rebolo, R., Zapatero-Osorio, M.R., 1996, ApJ, 469, 706
- Marraco & Rydgren (1981) Marraco & Rydgren 1981, AJ, 86, 62
- McCabe et al. (2006) McCabe, C., Ghez, A., Prato, L, Duchene, G., Fisher, R., Telesco, C., 2006, ApJ 636, 932
- Megeath et al. (2005) Megeath, S. T.; Hartmann, L.; Luhman, K. L.; Fazio, G. G., 2005, ApJ, 634, 113
- Meyer et al. (1997) Meyer, M. R., Calvet, N., & Hillenbrand, L. A. 1997, AJ, 114, 288
- Min et al. (2005) Min, M.; Hovenier, J. W.; de Koter, A., 2005, A&A 432, 909
- Mohanty et al. (2004) Mohanty, S., Jayawardhana, R., Natta, A., Fujiyoshi, T., Tamura, M., Barrado y Navascués, D., 2004, ApJ 609, L33
- Mohanty et al. (2005) Mohanty, S., Jayawardhana, R., Basri, G., et 2005, ApJ, 626, 498
- Morrow et al. (2008) Morrow, A. L.; Luhman, K. L.; Espaillat, C.; D’Alessio, P.; Adame, L.; Calvet, N.; Forrest, W. J.; Sargent, B.; Hartmann, L.; Watson, D. M.; Bohac, C. J., 2008, ApJ 676, 143
- Muench et al. (2001) Muench, A., Alves, J., Lada, Ch., Lada, E., 2001, ApJ558, 51
- Muzerolle et al. (1998a) Muzerolle, J., Hartmann, L., Calvet, N., 1998, AJ 116, 455
- Muzerolle et al. (1998b) Muzerolle, J., Calvet, N. & Hartmann, L., 1998, ApJ, 492, 743
- Muzerolle et al. (2001) Muzerolle, J., Calvet, N. & Hartmann, L., 2001, ApJ, 550, 944
- Muzerolle et al. (2003) Muzerolle, J., Hillenbrand, L., Calvet, N., Briceño, C.; Hartmann, L., 2003, ApJ, 592, 266
- Muzerolle et al. (2005) Muzerolle, J.; Luhman, K.; Briceño, C.; Hartmann, L.; Calvet, N., 2005, ApJ 625, 906
- Natta & Testi (2001) Natta, A., & Testi, L., 2001, A&A, 376, L22
- Natta et al. (2004) Natta, A., Testi, L., Neri, R., Schepherd, D., Wilner, D., 2004, A&A, 416, 179
- Natta et al. (2005) Natta, A., Testi, L., Randich, S., Muzerolle, J., 2005, Mem. S.A.It., 76, 343
- Natta et al. (2007) Natta, A., Testi, L., Calvet, N., et al., 2007, Protostars and Planets V, B. Reipurth, D. Jewitt, and K. Keil (eds.), Tucson: University of Arizona Press, 767
- Neuhäuser et al. (1997) Neuhäuser, R., Preibisch, T., 1997, A&A, 322, L37
- Neuhäuser et al. (2000) Neuhäuser, R., et al., 2000, A&A, 146, 323
- Nisini et al. (2005) Nisini, B.; Antoniucci, S.; Giannini, T.; Lorenzetti, D., 2005, A&A, 429, 543
- Osterbrock (1989) Osterbrock, D. E., “Astrophysics of gaseous nebulae and active galactic nuclei”, University Science Books, 1989
- Pascucci et al. (2003) Pascucci, I., Apai, D., Henning. T., Semenov, D., 2003, CoKon. 103, 99
- Pascucci et al. (2005) Pascucci, I., Apai, D., Henning. T., Sterzik, M., Dullemond, C., Bouwman, C., 2005, Mem.S.A.It., 76, 315
- Pasquini et al. (2002) Pasquini, L., et al., 2002, The Messenger, 110, 1 (ISSN 0722-6691)
- Pravdo et al. (2001) Pravdo, S. H.; Feigelson, E. D.; Garmire, G.; Maeda, Y.; Tsuboi, Y.; Bally, J., 2001, Nature 413, 708
- Preibisch et al. (1993) Preibisch, T., Ossenkopf, V., Yorke, H., & Henning, T., 1993, A&A, 279, 577
- Quillen et al. (2004) Quillen, A., Blackman, E., Frank, A., Varniere, P., 2004, ApJ, 612, L137
- Raga et al. (2002) Raga, A. C.; Noriega-Crespo, A.; Velázquez, P. F., 2002, ApJ, 576, 149
- Riddick et al. (2007) Riddick, F. C.; Roche, P. F.; Lucas, P. W., 2007, MNRAS, 381, 1077
- Rieke et al. (2004) Rieke, G., Young, E., Engelbracht, C., & 40 more coauthors, 2004, ApJS, 154, 25
- Sargent et al. (2006) Sargent, B., Forrest, W., D’Alessio, P., and 12 more coauthors, 2006, ApJ, 645, 395
- Scholz & Jayawardhana (2008) Scholz, A., & Jayawardhana, R., 2008, ApJ672, 49
- Servoin & Piriou (1973) Servoin, J., & Piriou, B., 1973, Phys. Stat. Sol., 55, 677
- Sicilia-Aguilar et al. (2005) Sicilia-Aguilar, A., Hartmann, L., Szentgyorgyi, A., et al., 2005, AJ, 129, 363
- Sicilia-Aguilar et al. (2006a) Sicilia-Aguilar, A., Hartmann, L., Calvet, N., Megeath, S.T., Muzerolle, J., Allen, L., D’Alessio, P., Merín, B., Stauffer, J., Young, E., Lada, C., 2006a,ApJ 638, 897
- Sicilia-Aguilar et al. (2006b) Sicilia-Aguilar, A., Hartmann, L., Fürész, G., Henning, Th., Dullemond, C., Brandner, W., 2006b, AJ 132, 2135
- Sicilia-Aguilar et al. (2007) Sicilia-Aguilar, A., Hartmann, L., Watson, D., Bohac, C., Henning, Th., Bouwman, J., 2007, ApJ, 659, 1637
- Sterzik et al. (2004) Sterzik, M., Pascucci, I., Apai, D., van der Bliek, N., Dullemond, C., 2004, AA, 427, 245
- Taylor & Storey (1984) Taylor & Storey, 1984, MNRAS, 209, 5
- Townsley et al. (2002) Townsley, L.; Broos, P.; Feigelson, E.; Burrows, D.; Chu, Y.-H.; Garmire, G.; Griffiths, R.; Maeda, Y.; Pavlov, G.; Tsuboi, Y., 2002, APS, APRB17061T
- Umbreit et al. (2005) Umbreit, S., Burkert, A., Henning, Th., Mikkola, S., Spurzen, R., 2005, ApJ, 623, 940
- Van Boekel et al. (2003) Van Boekel, R., Waters, L., Dominik, C., Bouwman, J., de Koter, A., Dullemond, C., Paresce, F., 2003, AA, 400, L21
- Van Boekel et al. (2005) Van Boekel, R., Min, M., Waters, L., et al. 2005, A&A 437, 189
- Voshchinnikov & Henning (2008) Voshchinnikov, N., Henning, Th., 2008, A&AL, 483, 9
- Vuong et al. (2003) Vuong, M, et al, 2003, A&A, 408, 581
- Walter (1986) Walter, F., 1986, ApJ, 306, 573
- Walter et al. (1997) Walter, F., et al., 1997, AJ, 114, 1544.
- Wang et al. (2004) Wang, H., Mundt, R., Henning, Th., Apai, D., 2004, ApJ 617, 1191
- White & Basri (2003) White, R., & Basri, G., 2003, ApJ, 582, 1109
- Whitworth & Zinnecker (2004) Whitworth, A., Zinnecker, H., 2004, A&A 427, 299
- Wilking et al. (1997) Wilking, B., et al., 1997, AJ, 114, 2029
| Name | Optical | IRS | 2MASS | IRAC | MIPS | Chandra | Class |
|---|---|---|---|---|---|---|---|
| CrA-205 | — | 2400-1680-1200-1200 | Det. | Det. | Det. | — | TO,4 |
| CrA-432 | — | 960-420-600-720 | Det. | Det. | Det. | — | II,4 |
| CrA-453 | Det. | — | Det. | Det. | Det. | — | III, 2,4 |
| CrA-465 | Det. | 960-960-480-480 | Det. | Det. | Nebula | — | II,4 |
| CrA-466 | Det. | 180-180-90-90 | Det. | Det. | Det. | Det. (G-113) | TO, 1, 2,4 |
| CrA-4107 | — | 180-180-600-600 | Det. | Det. | Det. | — | II,4 |
| CrA-4109 | — | 180-180-600-600 | Det. | Det. | Det. | — | TO,4 |
| CrA-4110 | Det. | 360-240-600-720 | Det. | Det. | Det. | — | II, flat, 2,4 |
| CrA-4111 | Det. | 720-720-600-720 | Det. | Det. | Det. | Det. (G-110) | TO, 1, 2,4 |
| G-1 | — | 18-18-18-42 | Det. | Det. | Det. | Det. | II, flat, 1, 2 |
| G-4 | Non-det. | — | Non-det. | Faint | Non-det. | Det. | eg:, 1, 2 |
| G-6 | Non-det. | — | Non-det. | Det. | Det. | Det. | I:, emb, 1, 2 |
| G-10 | Non-det. | — | Non-det. | Faint | Faint | Det. | eg:, 1 |
| G-11 | Very Faint | — | Non-det. | Faint | Non-det. | Det. | emb |
| G-14 | Det. | 720-720-360-360 | Det. | Det. | Det. | Det. | TO, 2 |
| G-16 | Very Faint | — | Non-det. | Faint | Faint | Det. | eg:, 1, 2 |
| G-17 | Faint | — | Non-det. | Faint | Non-det. | Det. | I, emb |
| G-20 | Non-det. | — | Non-det. | Faint | Non-det. | Det. | emb |
| G-22 | Non-det. | — | Non-det. | Faint | Non-det. | Det. | emb, 2 |
| G-28 | Faint | — | Non-det. | Faint | Near bright | Det. | I, emb, 1, 2 |
| G-29 | Non-det. | — | Non-det. | Faint | Faint | Det. | emb, 2 |
| G-30 | Det. | — | Det. | Det. | Det. | Det. | III, 1, 2 |
| G-32 | Very Faint | — | Faint | Det. | Det. | Det. | II, emb, 2 |
| G-36 | Non-det. | — | Non-det. | Det. | Det. | Det. | I, emb, ext:, 1, 2 |
| G-43 | Non-det. | — | Non-det. | Faint | Det. | Det. | I, emb, ext: |
| G-45 | Very Faint | — | Non-det. | Faint | Faint | Det. | I, emb, 1, 2 |
| G-48 | Very Faint | — | Non-det. | Faint | Non-det. | Det. | emb, 1 |
| G-49 | Det. | — | Det. | Det. | Det. | Det. | TO, 1, 2 |
| G-53 | Faint | — | Non-det. | Faint | Non-det. | Det. | emb, near RCrA, 1, 2 |
| G-57 | Non-det. | — | Non-det. | Faint | Near bright. | Det. | emb, near RCrA, 1, 2 |
| G-61 | Very Faint | — | Non-det. | Faint | Non-det. | Det. | emb, near optical HH, 1, 2 |
| G-64 | Faint | — | Non-det. | Faint | Faint | Det. | I:, HH, 1, 2 |
| G-65 | Faint | 56-42-90-90 | Det. | Det. | Det. | Det. | TO, 1, 2 |
| G-71 | Very Faint | — | Non-det. | Very Faint | Non-det. | Det. | emb/eg:, 1 |
| G-74 | Non-det. | — | Non-det. | Faint | Non-det. | Det. | emb, 1, 2 |
| G-76 | Faint | — | Non-det. | Faint | Non-det. | Det. | I/II:, emb, 1 |
| G-80 | Faint | — | Non-det. | Non-det. | Non-det. | Det. | HH |
| G-85 | Faint | 42-42-90-90 | Det. | Det. | Det. | Det. | II, 1, 2 |
| G-87 | Faint | 180-180-90-90 | Det. | Det. | Det. | Det. | TO, 2 |
| G-88 | Very Faint | — | Non-det. | Faint | Non-det. | Det. | emb, 1, 2 |
| G-90 | Very Faint | — | Non-det. | Faint | Non-det. | Det. | emb, 1 |
| G-94 | Det. | 240-240-360-360 | Det. | Det. | Det. | Det. | TO/III, 1, 2 |
| G-95 | Det. | 42-42-90-90 | Det. | Det. | Det. | Det. | TO , 1, 2 |
| G-99 | Non-det. | — | Non-det. | Faint | Extended | Det. | emb, ext 24m, 1, 2 |
| G-100 | Non-det. | — | Non-det. | Faint | Non-det. | Non-det. | emb, ext, 3 |
| G-101 | Very Faint: | — | Non-det. | Faint | Non-det. | Det. | I: emb, 1 |
| G-102 | Det. | — | Det. | Det. | Det. | Det. | TO/III, 1, 2 |
| G-105 | Very Faint | — | Non-det. | Faint | Faint | Det. | eg: |
| G-108 | Very Faint | — | Non-det. | Faint | Faint | Det. | I:/eg:, 1 |
| G-109 | Non-det. | — | Non-det. | Very Faint | Non-det. | Det. | emb, 1 |
| G-112 | Very Faint | — | Non-det. | Det. | Det. | Det. | I, emb, ext, 1, 2 |
| G-114 | Non-det. | — | Non-det. | Faint | Non-det. | Det. | emb |
| G-115 | Det. | — | Non-det. | Det. | Det. | Det. | eg, quasar, Z=0.62, 1, 2 |
| G-116 | Non-det. | — | Non-det. | Faint | Non-det. | Det. | emb, 1 |
| G-119 | Non-det. | — | Non-det. | Very Faint | Non-det. | Det. | eg:, 1 |
| G-122 | Faint | — | Non-det. | Faint | Extended: | Det. | I, ext |
| G-128 | Very Faint: | — | Non-det. | Very Faint | Non-det. | Det. | emb,1 |
| G-130 | Non-det. | — | Non-det. | Faint | Non-det. | Det. | near II, emb, 1 |
| G-132 | Very Faint: | — | Non-det. | Faint | Near bright | Det. | emb, near RCrA, 1 |
| G-133 | Faint | — | Non-det. | Very Faint | Near bright | Non-det. | emb, near RCrA,3 |
| G-135 | Very Faint: | — | Non-det. | Faint | Faint | Det. | eg:, 1 |
| G-136 | Very Faint | — | Non-det. | Very Faint | Non-det. | Non-det. | eg:, 3 |
Note. — Summary of observations. The ‘Optical’ column indicates whether the object was observed with FLAMES. The ‘IRS’ column indicates the exposure times (in seconds) in each one of the four IRS modules for the objects observed with IRS. The 2MASS, IRAC, MIPS, and Chandra columns indicate if the source was detected in with these instruments. The following labels are used: “Det.”= detected; “Non-det.”= not detected; “Faint”= weak source; “Very Faint” = marginal detection; “Extended”= extended source; “Nebula” = source embedded in nebular emission; “Near bright” = source located near a very bright saturated source that does not allow to extract the photometry. The Class indicates the SED type (Lada et al. 1987): Class I (protostars or proto-BD), Class II (CTTS stars or BD analogs), TO (transition objects between Class II and Class III, with optically thin inner disks), Class III (pre-main sequence stars or BD with no optically thick disks). The class is determined via the IRAC/MIPS/IRS data and the H line. Since all the H nebular emission in the sky positions within the cloud shows weak, narrow lines, objects with broad H and uncertain IRAC/MIPS photometry are likely embedded Class I sources. “HH” denotes Herbig-Haro or shock objects. The note “flat” has been added when the disk (or transition disk) has a slope close to that of a flat disk (F. Embedded and/or heavily extincted objects are labeled “emb”. Some of them could be extragalactic sources located behind the nebula. Extended objects or objects surrounded by nebulosity are labeled “ext”. Extragalactic or possibly extragalactic sources are marked with “eg”. Nearby source that may be affecting (contaminating or saturating) part or all of the Spitzer data are listed. Colon “:” indicates uncertain values. Extended sources, or sources surrounded by nebulosity, are labeled “ext”. 1= X-ray variable source, according to Garmire & Garmire (2003); 2= Listed as X-ray source in Forbrich & Preibisch (2007); 3= low-probability X-ray detection; 4= Source detected in optical (López-Martí et al. 2005).
| Name | Class | Counts | Flare Time(s) | Significance | log(LX / erg s-1) | HR | NH (1022 cm-2) | AV (mag) |
|---|---|---|---|---|---|---|---|---|
| CrA-466b | TO | 23 | 250 | 0.90 | 28.51 | -0.66 | 0.02 | 0.0 |
| CrA-4111a | TO | 17 | 833 | 0.90 | 28.33 | -1.00 | 0.03 | 0.0 |
| G-1 | II | 170 | 600 | 0.95 | 29.33 | -0.52 | 0.37 | 0.2 |
| G-6 | I | 11 | 487 | 0.90 | 28.03 | 0.60 | 0.02 | 0.0 |
| G-14 | TO | 15 | — | — | 28.28 | -0.65 | 0.04 | 0.0 |
| G-17 | I | 6 | — | — | 30.14 | 1.00 | 61.33 | 31 |
| G-28* | I | 4 | 8,000 | 0.97 | 29.02 | 1.00 | 15.63 | 7.9 |
| G-30 | III | 84 | 240 | 0.90 | 29.16 | -0.91 | 0.18 | 0.1 |
| G-32 | II | 9 | 5,290 | 0.80 | 28.45 | -0.59 | 1.13 | 0.6 |
| G-36 | I | 47 | 2,600 | 0.90 | 29.50 | 0.69 | 1.56 | 0.8 |
| G-43 | I | 4 | — | — | 28.46 | 0.48 | 0.72 | 0.4 |
| G-45 | I | 25 | 1,100 | 0.90 | 29.18 | 0.64 | 3.58 | 1.8 |
| G-49 | III | 20 | 1,800 | 0.95 | 28.34 | -0.81 | 0.01 | 0.0 |
| G-64 | I | 11 | 6,000 | 0.84 | 28.63 | 0.27 | 1.34 | 0.7 |
| G-65 | TO | 68 | 1,200 | 0.97 | 29.47 | 0.19 | 1.52 | 0.8 |
| G-76* | I | 4 | 8,400 | 0.97 | 28.94 | 0.49 | 2.17 | 1.1 |
| G-80 | HH | 5 | — | 0.95 | 27.96 | -0.72 | 0.32 | 0.2 |
| G-85 | II | 48 | 1,305 | 0.97 | 29.00 | -0.34 | 0.76 | 0.4 |
| G-87 | TO | 6 | — | — | 27.74 | 0.65 | 0.00 | 0.0 |
| G-94 | III | 123 | 160 | 0.90 | 28.77 | -0.92 | 0.02 | 0.0 |
| G-95 | III | 789 | 30 | 0.97 | 30.18 | -0.56 | 0.65 | 0.3 |
| G-101 | I | 243 | 500 | 0.97 | 29.84 | -0.50 | 0.78 | 0.4 |
| G-102 | III | 59 | 2,000 | 0.97 | 28.94 | -0.75 | 0.03 | 0.0 |
| G-108* | I | 5 | 8,960 | 0.97 | 28.96 | 0.51 | 1.10 | 0.6 |
| G-112 | I | 16 | 1,235 | 0.99 | 28.52 | -0.23 | 0.41 | 0.2 |
| G-122 | I | 5 | — | — | 28.47 | 0.59 | 0.60 | 0.3 |
| G-130 | I | 8 | 205 | 0.90 | 28.00 | 0.39 | 0.00 | 0.0 |
Note. — X-ray properties of the Class III, Class II, TO, and Class I objects and the HH knot G-80. Sources marked with ‘*’ were observed only as flare sources. Errors are 95% errors. a CrA-4111 corresponds to the X-ray source G-110. b CrA-466 corresponds to the X-ray source G-113. The extinction AV is estimated from NH (Vuong et al. 2003; Cardelli et al. 1989)
| Name | ID | J | H | K | 3.6m | 4.5m | 5.8m | 8.0m | 24m | 70m |
|---|---|---|---|---|---|---|---|---|---|---|
| CrA-205 | 19011169-3722213 | 13.3150.023 | 12.7410.023 | 12.4050.023 | — | 11.930.12 | — | 12.420.38 | 9.100.14: | — |
| CrA-432 | 19005974-3647109 | 14.1900.026 | 13.3330.035 | 12.8210.030 | 11.9660.041 | 11.7000.067 | 10.840.11 | 10.7040.075 | 8.4210.099 | — |
| CrA-453 | 19010460-3701292 | 13.3380.024 | 12.5240.025 | 12.0750.023 | 11.6340.022 | 11.6010.037 | 11.540.14 | 11.5390.095 | — | — |
| CrA-465 | 19015374-3700339 | 14.0840.026 | 13.4010.033 | 13.0150.033 | 12.2640.072 | 11.9930.071 | 13.351.20: | 11.020.11 | 7.1200.088 | — |
| CrA-466 | 19011893-3658282 | 12.8340.024 | 11.2450.025 | 10.4530.021 | 9.6110.006 | 9.2040.006 | 8.8050.019 | 8.1730.007 | 5.3660.017 | 2.220.17 |
| CrA-4107 | 19025464-3646191 | 12.4400.022 | 11.7950.022 | 11.4080.021 | 10.7190.009 | — | 10.0430.035 | — | 7.0190.035 | 1.4920.042 |
| CrA-4109 | 19021667-3645493 | 12.0040.023 | 11.3030.022 | 11.0170.021 | 10.6880.012 | — | 10.6010.082 | — | 6.9900.034 | — |
| CrA-4110 | 19011629-3656282 | 12.9540.021 | 12.3140.022 | 11.8970.021 | 11.2080.015 | 10.8460.023 | 10.7770.067 | 10.1910.031 | 7.4100.085 | — |
| CrA-4111 | 19012083-3703027 | 13.2330.024 | 12.6870.023 | 12.4020.024 | 11.9500.031 | 12.0590.063 | 11.710.19 | 11.1930.079 | 6.630.16 | — |
| G-1 | 19022708-3658132 | 9.3070.024 | 8.2920.038 | 7.9000.016 | 7.4650.001 | 7.1380.002 | 6.6330.003 | 6.0100.002 | 4.1980.009 | 2.700.20 |
| G-6 | 19:02:21.9 -36:56:03 | — | — | — | — | 14.820.84: | 13.220.88: | 11.770.17 | 9.200.14 | — |
| G-14 | 19021201-3703093 | 13.4080.029 | 12.5820.029 | 12.1450.021 | 11.5430.025 | 11.2520.033 | 11.240.13 | 10.6070.050 | 7.9970.059 | — |
| G-30 | 19020012-3702220 | 11.8590.026 | 11.2380.024 | 11.0030.026 | 10.7710.017 | 10.7100.024 | 10.3760.081 | 10.4430.058 | 8.820.15 | — |
| G-32 | 19015833-3700267 | 16.945a | 15.2700.117 | 13.6520.051 | 12.2890.063 | 11.9620.070 | 11.170.11 | 11.580.16: | 7.780.25 | — |
| G-36 | 19:01:55.9 -36:52:05 | — | — | — | 16.12.4 | 13.110.34 | 12.050.44 | 10.880.16 | 7.1950.088 | — |
| G-43 | 19:01:52.6 -37:02:44 | — | — | — | 13.640.20 | — | 11.220.17: | 9.3230.025: | 10.00.5: | — |
| G-45 | 19:01:52.2 -37:05:42 | — | — | — | — | — | 14.32.2 | — | — | 1.890.15: |
| G-49 | 19014936-3700285 | 12.4980.026 | 11.8910.025 | 11.6030.024 | 11.3390.021 | 11.2240.028 | 11.2070.097 | 11.3070.089 | — | — |
| G-65 | 19014041-3651422 | 13.8980.032 | 11.6290.023 | 10.4810.019 | 9.4030.009 | 9.0360.008 | 8.3950.067 | 7.650.14 | — | — |
| G-85 | 19013385-3657448 | 14.4480.030 | 11.9100.023 | 10.4740.019 | 9.0240.004 | 8.4340.004 | 8.0850.010 | 7.3770.004 | 4.1370.010 | 0.890.27 |
| G-87 | 19013232-3658030 | 14.8530.037 | 12.6220.029 | 11.4320.023 | 10.3520.009 | 9.8800.011 | 9.6290.040 | 9.1620.016 | 6.2910.056 | — |
| G-94 | 19012901-3701484 | 11.6370.024 | 10.9560.023 | 10.6630.021 | 10.3860.010 | 10.2690.016 | 10.2780.067 | 10.0370.037 | 8.760.21 | — |
| G-95 | 19012872-3659317 | 10.8280.023 | 9.5910.025 | 9.0020.019 | 8.7090.003 | 8.6060.005 | 8.4290.013 | 8.4760.010 | 7.700.12 | — |
| G-100 | 19:01:25.8 -36:53:59 | — | — | — | — | — | 11.210.20 | — | — | — |
| G-102 | 19012562-3704535 | 12.3630.023 | 11.6540.021 | 11.2990.023 | 10.8610.010 | 10.8000.018 | 10.5340.055 | 10.5960.043 | 9.370.49 | — |
| G-112 | 19:01:19.4 -37:01:42 | — | — | — | — | 14.61.1 | — | 11.520.11 | 6.0020.034 | — |
| G-115 | 19:01:15.9 -37:03:44 | — | — | — | 13.690.16 | 12.980.13 | 11.630.24 | 11.1130.057 | 8.770.57 | — |
| G-122 | 19:01:40.9 -36:57:15 | — | — | — | 12.860.11: | 12.350.12: | 10.590.13: | 9.0790.031: | 4.4290.056: | — |
Note. — Archive data available through the 2MASS and Spitzer databases for the objects observed with FLAMES and/or IRS. Only the objects detected clearly at 2 or more wavelengths are listed here. ID indicates the 2MASS ID, or the coordinates, when the source was not detected by 2MASS. For the IRAC and MIPS photometry, the dominant source of error is the array location dependence, which results in typical 10% errors. a: Upper limit 2MASS photometry. The colon (:) indicates uncertain values, mostly due to extended emission and/or very low signal to noise ratio.
| Name | Numerator | Denominator | Range | Calibration | Reference |
|---|---|---|---|---|---|
| PC1 | 7030-7050 | 7525-7550 | M3-M9 | -0.06+2.95 X | 1,2 |
| PC2 | 7540-7580 | 7030-7050 | M4-M8 | -0.63+3.89 X | 1,2 |
| PC3 | 8235-8265 | 7540-7580 | M3-M9 | -8.01+14.08 X-2.81 X2 | 2 |
| PC4 | 9190-9225 | 7540-7580 | M3-M9 | -0.94+4.66 X-0.52 X2 | 2 |
| R1 | 8025-8130 | 8015-8025 | M2.5-M8 | 2.8078+21.085(X-1.044)-53.025(X-1.044)2+60.755(X-1.044)3 | 3 |
| R2 | 8415-8460 | 8460-8470 | M3-M8 | 2.9091+10.503(X-1.035)-14.105(X-1.035)2+8.5121(X-1.035)3 | 3 |
| R3 | (8125-8130)+(8415-8460) | (8015-8025)+(8460-8470) | M2.5-M8 | 2.8379+19.708(X-1.035)-47.679(X-1.035)2+52.531(X-1.035)3 | 3 |
| TiO 8465 | 8405-8425 | 8455-8475 | M3-M8 | 3.2147+8.7311(X-1.085)-10.142(X-1.085)2+5.6765(X-1.085)3 | 3 |
| VO 2 | 7920-7960 | 8130-8150 | M3-M8 | 2.6102-7.9389(X-0.963)-8.3231(X-0.963)2-14.660(X-0.963)3 | 3 |
| VO 7445 | 0.5625(7350-7400)+0.4375(7510-7560) | 7420-7470 | M5-M8 | 5.0881+17.121(X-0.982)+13.078(X-0.982)2 | 3 |
Note. — Indices used for spectral typing. The wavelengths are given in Å. In the calibration, X represents the index, and the resulting number indicates the M subtype. References: 1= Kirkpatrick et al. (1996); 2= Martín et al. (1996); 3= Riddick et al. (2007). The lineal relations for PC1 and PC2 are obtained by fitting together the objects in references 1 and 2.
| Parameter | Meaning |
|---|---|
| Fν | Observed flux |
| Fν,cont | Total continuum flux |
| d | Distance to the source, 150 pc |
| R∗ | Stellar radius, derived from spectral type and luminosity |
| T∗ | Stellar temperature, derived from spectral type |
| Ta,min | Lowest temperature in the disk atmosphere |
| Ta,max | Highest temperature in the disk atmosphere |
| Tr,min | Lowest temperature in the inner rim |
| Tr,max | Highest temperature in the inner rim |
| Tm,min | Lowest temperature in the disk midplane |
| Tm,max | Highest temperature in the disk midplane |
| D0 | Scale of the contribution of the star (to allow 10% error in luminosity) |
| D1 | Contribution of the inner rim to the total flux |
| D2 | Contribution of the midplane to the total flux |
| Di,j | Mass contribution of species i with size j |
| Mass absorption coefficient of species i with size j (Figure 3) | |
| qr | Power exponent of the temperature distribution (as a function of radius) in the rim |
| qa | Power exponent of the temperature distribution (as a function of radius) in the disk atmosphere |
| qm | Power exponent of the temperature distribution (as a function of radius) in the disk midplane |
Note. — List of parameters involved in the TLTD model, as well as their relevances and implications. As mentioned in the text, only the mass contributions D0, D1, D2, Di,j, and the temperature exponents qr, qa, and qm are fitted to the data.
| Name | Sp.Type | AV | H (6563 Å) | Li I (6708 Å) | K I (7665-7699 Å) | Na I (8183-8195 Å)a | Na I (8183-8195 Å)b | Notes |
|---|---|---|---|---|---|---|---|---|
| CrA-453 | M4.5 | 1.840.17 | -3.9 | 0.5 | 1.8—1.3 | 1.0—1.5 | …—1.3 | WTTS, Class III |
| CrA-465 | M7.5 | 0.080.04 | -253 | 0.5 | 2.7—2.5 | 1.0—1.0 | 1.0—1.0 | CTTS, H double peak, Class II |
| CrA-466 | M2.0 | 8.100.44 | -14.5 | 0.5 | 1.4—0.8 | 0.9—1.1 | 0.8—1.0 | CTTS, TO |
| CrA-4110 | M5 | 0.410.34 | -10.9 | 0.5 | 1.7—1.4 | 0.9—2.5: | 1.0—1.2 | WTTS, Class II |
| CrA-4111 | M4.5 | 0.000.46 | -12.3 | 0.5 | 2.3—1.9 | 1.2—1.5 | …—1.5 | WTTS |
| G-14 | M4.5 | 1.890.10 | -7.4 | 0.6 | 2.1—1.5 | 1.2—1.6 | …—1.4 | WTTS,TO |
| G-17 | — | — | -39 | … | … | … | … | Faint |
| G-28 | — | — | -200 | … | … | … | … | Faint, Class I: |
| G-30 | M3.5 | 0.090.50 | -7.5 | 0.3 | 1.8—1.3 | 1.1—1.5 | …—1.4 | WTTS, Class III |
| G-49 | M4.0 | 0.070.02 | -4.3 | 0.6 | 1.6—1.1 | 1.0—1.3 | 1.0—1.2 | WTTS, Class III |
| G-64 | late M:c | — | -26 | 1.5: | 0.5:—… | … | … | Class I + HH |
| G-65 | M1-M2:c | 141 | -6 | 0.4: | 0.5:—0.2 | 0.5—0.7 | 0.6—0.4 | CTTS (broad H), Class II |
| G-76 | — | — | -6 | … | … | … | … | Faint |
| G-80 | — | — | -120 | … | … | … | … | Shock, NII,SII |
| G-85 | M2-M3:c | 171 | -27 | … | 2.4:—0.9 | 0.9—1.3 | … | CTTS, Class II |
| G-87 | M3-M4:c | 141 | -4 | 2.0: | 1.4—1.1 | 0.9—1.0 | 0.9—1.1 | WTTS, TO |
| G-94 | M3.5 | 0.590.02 | -5.6 | 0.1 | 1.7—1.2 | 1.1—1.4 | …—1.2 | WTTS, Class III |
| G-95 | M1.0 | 5.010.45 | — | 0.4 | 1.0—0.3 | 0.4—0.6 | …—0.5 | WTTS, Class III |
| G-102 | M5.0 | 0.720.04 | -15.1 | 0.6 | 2.6—2.1 | 1.4—2.0 | …—1.6 | WTTS, Class III |
| G-108 | late M:c | — | … | … | 0.8:—0.4: | … | … | High extinction |
| G-122 | — | — | -34 | … | … | … | … | Class I, Faint |
| G-133 | K-M:c | — | -4 | 0.3: | … | … | … | High extinction, Class I:, H marginal |
Note. — Equivalent widths of the lines observed in the young stars. EW in Å, negative values mean emission. a: From the spectra centered at 773 nm. b: From the spectra centered at 881 nm. c: Spectral type obtained by comparison with similar type spectra because of low S/N. Colons mark uncertain values. The error in AV is a combination of uncertainty in the spectral type and dispersion in the AV values obtained from J-H and J-K. The “Notes” colum lists the type of object based on the strength and broadness of the H line (CTTS if EW10 and/or broad line; WTTS otherwise) and the SED (Class I, Class II, TO, and Class III).
| Name | Am. (Olivine-type) | Am. (Pyroxene-type) | Forsterite | Enstatite | Silica | |
|---|---|---|---|---|---|---|
| 0.1m | 0.1m | 0.1m | 0.1m | 0.1m | ||
| 1.5m | 1.5m | 1.5m | 1.5m | 1.5m | ||
| 6.0m | 6.0m | 6.0m | 6.0m | |||
| CrA-466 | 10.2 | — | — | 5.2 | 0.01 | — |
| 77 | — | — | 1.9 | — | ||
| — | — | — | — | 16 | ||
| CrA-466l | 9.3 | 1 | 0 | 9 | — | — |
| 28 | 4 | — | — | 0.4 | ||
| — | 54 | — | — | 3.8 | ||
| CrA-4107 | 1.3 | 0.2 | 2 | 2.0 | 1.2 | 0.11 |
| 2.6 | 0.7 | 0.0 | 2.2 | 1.3 | ||
| 73 | 3 | 11 | — | 1.3 | ||
| CrA-4111l | 1.9 | — | — | 11 | 3 | — |
| — | — | — | 62 | 7 | ||
| — | — | — | — | 18 | ||
| G-1 | 6.2 | 2 | 0.08 | 0.48 | 0.02 | 0.56 |
| — | 13.6 | 0.12 | 2.1 | 0.4 | ||
| 6 | 73 | 0.4 | — | 1.2 | ||
| G-14 | 6.5 | 0.7 | — | 2.7 | — | — |
| 32 | — | 0.05 | — | — | ||
| — | 64 | 0.02 | — | — | ||
| G-85 | 6.1 | 11 | — | 3.4 | 2.9 | — |
| — | 61 | — | 2.4 | 0.36 | ||
| 0.4 | 14 | — | — | 4.6 | ||
| G-85l | 1.1 | 2 | 26 | 9.5 | 0.8 | 0.02 |
| 53 | 3 | — | 5 | 0.36 | ||
| — | — | — | — | 0.3 | ||
| G-87 | 3.4 | 0.3 | — | 12 | 11 | — |
| 55 | 19 | 0.3 | 0.2 | — | ||
| — | — | 0.6 | — | 2 |
Note. — Percentage of the mass fraction of the different materials and reduced for each fitted spectrum. The amorphous silicates are classified as having olivine or pyroxene stoichiometry. The crystalline silicates are forsterite, enstatite, and silica. Amorphous carbon grains are included as well. For each component, three different sizes are given (0.1, 1.5 and 6.0 m). The summary lists the final crystallinity fraction and the mass average grain size (including crystalline and amorphous grains). l= Long wavelength composition (17-25m).
| Name | Size (am.) / m | Size (cryst.) / m | Cryst. (%) |
|---|---|---|---|
| CrA-466 | 1.50.1 | 4.30.5 | 232 |
| CrA-466l | 4.32.9 | 1.82.1 | 147 |
| CrA-4107 | 5.72.6 | 4.13.3 | 1911 |
| CrA-4111l | — | 2.11.2 | 70-100∗ |
| G-1 | 5.21.2 | 2.62.1 | 52 |
| G-14 | 4.50.2 | 0.20.4 | 2.80.3 |
| G-85 | 2.10.7 | 2.40.8 | 142 |
| G-85l | 1.00.5 | 0.70.6 | 166 |
| G-87 | 1.50.8 | 0.71.2 | 268 |
Note. — Average grain sizes for amorphous and crystalline silicates and crystallinity fraction (mass fraction of crystalline silicates) from the TLTD fit. For the low S/N spectrum of CrA-4111l, there is only marginal evidence of crystalline silicates, so the crystallinity fraction is constrained taking into account the errors in the marginally detected crystalline silicates. The typical error for this value is 30%.
| Name | log(F10/F10∗) | log(F24/F24∗) | log(F30/F30∗) | log(F70/F70∗) | Disk Type |
|---|---|---|---|---|---|
| CrA-205 | 0.0 | 1.3 | 1.3: | — | TO |
| CrA-4109 | 0.0 | 1.5 | 1.8 | — | TO |
| CrA-4111 | 0.0 | 1.9: | 2.0: | — | TO |
| G-1 | 0.7 | 1.3 | 1.6: | 1.9 | TO |
| G-30 | — | 0.7 | — | — | D |
| G-87 | 0.6 | 1.5 | 1.6 | — | TO |
| G-94 | 0.0 | 0.4: | — | — | D |
| G-95 | 0.0 | 0.5 | 0.8 | — | D |
| G-102 | — | 0.5 | — | — | D |
Note. — Excesses over the photospheric levels for the disks with inner holes. Colon (:) indicates uncertain values. Otherwise, the typical errors are 0.1. The disk type is marked as “transition” (TO) or “debris-like” (D) disk depending on the excess over the photosphere (Kenyon & Bromley 2005). Note that the debris-like disks are considered to be Class III sources and not included in the median SED.
| Name | [N II] 6548Å | [N II] 6583Å | [S II] 6716Å | [S II] 6731Å |
|---|---|---|---|---|
| G-64 | -2.6 | -2.7 | -19.2 | -22.8 |
| G-80 | -18.1 | -68.1 | -48.3 | -43.0 |
Note. — Equivalent widths of the forbidden lines observed in the HH objects detected in the spectra.