Spectral analysis of deformed random networks
Abstract
We study spectral behavior of sparsely connected random networks under the random matrix framework. Sub-networks without any connection among them form a network having perfect community structure. As connections among the sub-networks are introduced, the spacing distribution shows a transition from the Poisson statistics to the Gaussian orthogonal ensemble statistics of random matrix theory. The eigenvalue density distribution shows a transition to the Wigner’s semicircular behavior for a completely deformed network. The range for which spectral rigidity, measured by the Dyson-Mehta statistics, follows the Gaussian orthogonal ensemble statistics depends upon the deformation of the network from the perfect community structure. The spacing distribution is particularly useful to track very slight deformations of the network from a perfect community structure, whereas the density distribution and the statistics remain identical to the undeformed network. On the other hand the statistics is useful for the larger deformation strengths. Finally, we analyze the spectrum of a protein-protein interaction network for Helicobacter, and compare the spectral behavior with those of the model networks.
pacs:
89.75.Hc,89.90.+nI Introduction
The network concept has been gaining recognition as a fundamental tool in understanding the dynamical behavior and the response of real systems from different fields such as biology, social systems, technological systems. Examples of biological systems include food-web, nervous system, cellular metabolism, protein-protein interaction network, gene regulatory networks; social systems include scientific collaboration, citation, linguistic networks, and technological systems include internet, power-grid rev-network . Many of these networks have been shown to have universal structural properties, such as degree distribution following a power law, small diameter, large clustering coefficient, existence of communities rev-network ; SW ; BA ; Newman .
Different network models have been proposed and investigated in detail to understand systems having an underlying network structure rev-network ; SW ; BA ; Amaral . These models concentrate to capture one or more structural properties of the networks mentioned above SW ; BA ; rev-network . Apart from these direct measurements of structural properties, network spectra are also useful to understand various properties of the underlying system. Eigenvalues of the adjacency matrix of networks form what are called network spectra, and provide information about some basic topological properties of the underlying network spectrum ; handbook . Recently, considerable research has been done in the direction of network spectra spectra-net ; Aguiar-SF .
In the following, we mention known results on the spectra of real world and model networks. The spectra of networks have some correspondence with the spectra of random matrices. For instance, the distribution of eigenvalues of a matrix having finite mean number of nonzero Gaussian distributed random elements per row follows Wigner semicircular law in the limit , where is the dimension of matrix mehta ; rev-rmt . For very small , which corresponds to the sparse random matrix, one gets the semicircular law but with peaks at different parts of the spectrum (maximum at the eigenvalue zero) sparseRM . Recent investigations of the spectral behavior of networks, leading to matrices with entries and , show that the random networks erdos follow Wigner semicircular law as well Vicsek with degeneracy at the eigenvalue zero. The small-world model networks SW show a very complex spectral density with many sharp peaks SJ_pre2007a , while the spectral density of the scale-free model networks BA exhibits a triangular distribution Vicsek ; Aguiar-SF ; Chung ; SJ_pre2007a . The spectra of real world networks show remarkably different features than that of the model networks Aguiar-SF ; Chung ; SJ_pre2007a ; Jost , and based on this observation a network construction method was proposed which captures a peak at zero property shown by the spectra of many real world networks such as protein-protein interaction networks Jost . Recently, spacing distributions of Erdös-Rényi networks have been studied under random matrix theory (RMT) framework Vattay . As connection probability decreases Ref. Vattay shows a transition to the Poisson statistics. Additionally, it shows the transition to the Poisson statistics upon the deletion of nodes in the real world networks Vattay . Refs. SJ_pre2007a ; SJ_pre2007b have shown that the spacing distributions of various model networks, namely small-world and scalefree networks, follow the universal behavior of RMT. In contrast to Vattay , these works SJ_pre2007a ; SJ_pre2007b have considered only connected networks. Furthermore, spectral rigidity such as the statistics, defined in Eq. 3, provides a qualitative measure of the level of randomness in networks SJ_new . Recently localization of eigenvectors have also been used to analyze various structural and dynamical properties of real and model networks eigenvector .
RMT, initially proposed to explain statistical properties of nuclear spectra, has also provided successful predictions for the spectral properties of different complex systems such as disordered systems, quantum chaotic systems and large complex atoms among this. It has been followed by numerical and experimental verifications in the last few decades mehta ; rev-rmt . Quantum graphs, which model the systems of interest in quantum chemistry, solid state physics and transmission of waves, have also been studied under the RMT framework Qgraph . Recently, RMT has been shown to be useful in understanding the statistical properties of empirical cross-correlation matrices appearing in the study of multivariate time series in several problems : price fluctuations in stock market rmt-stock , Electro encephalogram data rmt-brain , variation of different atmospheric parameters rmt-atmosphere .
In the present work we study spectral behavior of networks having community structure under the framework of RMT. The study of community structure helps to elucidate the organization of networks, and eventually could be related to the functionality of groups of nodes Amaral ; Newman ; community . Regardless of the type of real world networks in terms of the degree and other structural properties rev-network , it is possible to distinguish communities in the whole networks Newman . However, the question of definition of the community is problematic, and usually community is assigned to the nodes which are connected densely among themselves, and are only sparsely connected with other nodes outside the community. We therefore model here community structure by sparsely connected Erdös-Rényi random networks. This simple approach considers more densely connected nodes as a definition of community, and does not pay attention to the detailed structure of the connections Amaral . Recent literature is largely filled up with methods to detect communities in networks based on structural measures Vespignani ; comm-det , whereas few works emphasize on the spectral properties such as density distribution and eigenvector analysis as well comm-det-spectra . The objective of our work is not the detection of communities, rather we show the applicability of spectral methods under the RMT framework to analyze community structures in networks. Instead of paying attention to the nodes forming communities, we look for the signatures of overlapping of communities in the spectra of the corresponding adjacency matrix. We study various spectral behaviors, namely density distribution, nearest neighbor spacing distribution (NNSD) and spectral rigidity for deformed random networks. We find that the NNSD detects even the small mixing of communities in the network, whereas spectral rigidity probed by the statistics is suitable to analyze larger mixing, which is, in general, the case for real world networks. Communities are modeled by random or scale-free sub-networks, and interactions between communities are considered as random. For small interaction strength the NNSD of the network shows the transition from the Poisson to the Gaussian Orthogonal Ensemble (GOE) statistics. For large interactions, the statistics shows systematic increase in the range for which it follows GOE statistics. Finally, as an application, we study the spectral properties of a protein-protein interaction network of Helicobacter under the RMT framework.
II Deformed networks
For an unweighted network, the adjacency matrix is defined in the following way : , if and nodes are connected and otherwise. For undirected networks, this matrix is symmetric and consequently has real eigenvalues. Random matrices corresponding to unweighted random networks have entries and , where number of ’s in a row follows a Gaussian distribution with mean and variance . This type of matrix is very well studied within the RMT framework mehta ; sparseRM . We then turn our attention to the following structure: (1) Take random networks with connection probability ; the spectral behavior of the matrix corresponding to each of these sub-networks (blocks) separately follows GOE statistics. The matrix corresponding to the full network would be a block diagonal matrix. (2) Introduce random connections among these sub-networks with probability . This configuration leads to block matrix, with blocks having entries with portability , and off diagonal blocks having entries with probability . The above networks can be casted in the following form:
| (1) |

is a blocks diagonal random matrix, where each block represents one community, and the off-diagonal block matrix denotes the interactions among the communities. Each block in is a random matrix, which for large has mean and deviation . Since the nonzero values of introduce deformation to the complete block diagonal form, we refer being a deformed network. This terminology is motivated by the literature on deformed random matrices deformed . Fig. 1 shows the connection matrices for and various values of . Fig. 1(a) represents the two random sub-networks, each of size , with the connection probability inside a sub-network being and between the sub-networks being . The ratio , which can be considered as the relative strength of and , measures the deformation from the block-diagonal form of the matrix, or from the perfect structured network. The value , which corresponds to equal strength of inter and intra-community connections, yields complete random network. Fig. 1(b) plots the connection matrix for , which implies that inter-community connections are of the intra-community connections. Fig. 1(c) shows the connection matrix for ; for this value of , the inter-community strength is () of the intra- community strength. Note that in numerical simulations we use the value of equal to 0.01, which leads to a sparse connected random network () with the average degree , being the number of connections in the network. Larger value of would lead to networks with the larger average degree. Real world networks are sparse rev-network , and hence we chose such a small value of .
III Numerical Simulation Results
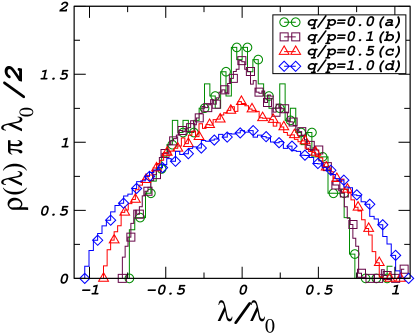
We denote the eigenvalues of the network by , where is the size of the sub-network, and is the number of the sub-networks. Note that the size of each sub-network may be different, but for simplicity we consider here equal size. Fig. 2 plots the spectral density for block matrices having non-zero off diagonal entries, corresponding to the two sub-networks connected with probability . As discussed earlier varies from , which corresponds to the two completely disconnected sub-networks ( , Fig. 1(a) ), to leading to a single random network. The cases for correspond to the configurations when the initial community structure is almost preserved. Increase in the value of leads more entries of in the matrix (Eq. 1). Finally the case destroys the community structure completely, and the network can be treated as one single random network. Fig. 2 presents the density distribution of eigenvalues for various values of . The eigenvalues are scaled with respect to the spectra of the network for . With this scaling, the density distributions are not semicircular for values of . As the coupling between the two blocks increases (), the density distribution shows a transition to the semicircular form at :
where is the radius of the semicircular distribution for calculated from the spectra of network as , and being the highest and the lowest eigenvalue. Now we turn our attention to the statistics of eigenvalue fluctuations.
III.1 Nearest neighbor spacing distribution
In the following, we study spectral fluctuations of the networks for different values of . In order to get universal properties of the eigenvalue fluctuations, one has to remove the spurious effects due to variations of the spectral density and to work at the constant spectral density on the average. Thereby, it is customary in RMT to unfold the eigenvalues by a transformation , where is the averaged integrated eigenvalue density mehta . Unfolding is a transformation which produces the eigenvalues with a constant average level density. Since we do not have an analytical form for , we numerically unfold the spectrum by polynomial curve fitting.
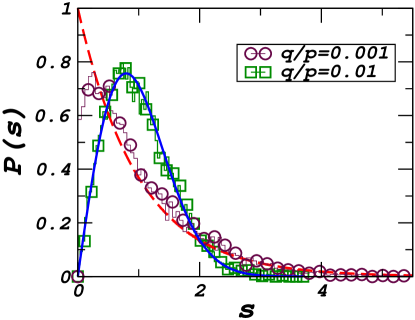
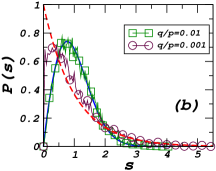
Using the unfolded eigenvalues, we calculate the NNSD , where , for different values. Fig. 3 plots the spacing distribution for the two values of , and . For such small values of , although the density distributions remain unchanged, the NNSD shows significant changes. Spacing distributions calculated from the network spectra are fitted using Brody formula Brody ,
| (2) |
where and are determined by the parameter as follows :
Eq. 2 is a semi-empirical formula characterized by the single parameter . As goes from zero to one, the Brody formula smoothly changes from Poisson to GOE. As can be seen from Fig. 3, for , the value of the Brody parameter , which suggests that distribution is very close to the Poisson [] denoted by the dotted curve in the figure. As the value of increases, also increases, and it is of the order of 1 for the value of (which corresponds to the value of as less as ), and becomes insensitive for a further increase in . For larger values of , we analyze the spectra using the spectral rigidity test of RMT.
III.2 Spectral rigidity via statistics
The spectral rigidity, measured by statistics of RMT, gives information about the long-range correlations among the eigenvalues. The statistics measures the least-square deviation of the spectral staircase function representing the cumulative density from the best straight line fitting for a finite interval of the spectrum, i.e.,
| (3) |
where and are obtained from a least-square fit. Average over several choices of gives the spectral rigidity . For the uncorrelated eigenvalues, , reflecting strong fluctuations around the spectral density . For the GOE case, statistics is given by
| (4) |
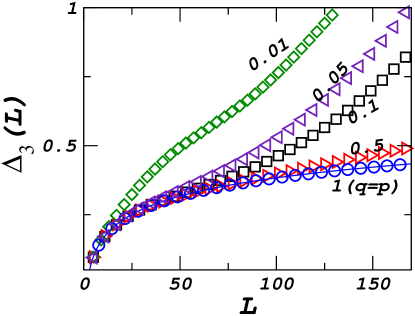
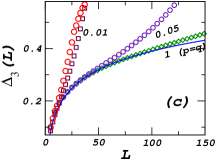
Fig. 4 plots the statistics for five different values of . Various open symbols are the numerical values of for various values, and the solid line (merged with the case) is the statistics for the GOE case (Eq. 4). As seen from Fig. 4, the statistics follows RMT predictions of GOE (Eq. 4) up to a certain . It has a linear behavior in semi-logarithmic scale with the slope of . The value of for which it follows GOE statistics depends upon . For small values of such as and , follows RMT prediction till very small range of and , respectively. As increases, the value of for which follows the GOE statistics also increases. For , it agrees with the RMT predictions of GOE behavior for , and after this value, deviation from the RMT prediction is seen. This deviation corresponds to the existence of community structure in the network. As the value of increases, the communities have more and more random connections between them. For the community structure is destroyed fully, and the network is a complete random network. This fact is reflected in the statistics corresponding to . At this value of , it follows RMT prediction up to a very long-range . After this value of , for the network of size we do not have a meaningful calculation of the statistics casati . For (see Fig. 1), where the strength of inter-community is as large as of the intra-community connections strength, the statistics correctly reflects the deviation from complete random matrices, suggesting the existence of communities in the network.
Note that we present results for each sub-network having equal size. For sub-networks having different sizes, all the figures remain the same. The crucial quantity, which affects correlations of eigenvalues, is the variance of each block or the ratio . For blocks with different sizes, but with the same , similar results are obtained, except for the exact value of in Fig. 4 for which the statistics follows GOE distribution, which scales with the network size SJ_new .
IV Deformed scalefree networks
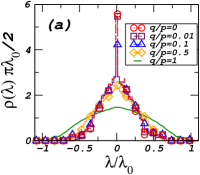
In the following we consider scalefree networks as the sub-networks, and study the spectral behavior for various values of . Again measures the strength of the off-diagonal block matrix defining the interaction between the sub-networks. Matrix in Eq. 1, corresponding to the scalefree sub-networks, consists of two block diagonal matrices, with entries of one in each block following a power law characteristic of the sub-network. We use Barabási-Albert algorithm BA to generate the scalefree sub-networks. In scalefree network the probability , that a node has degree , decays as a power law , where is a constant and for the type of probability law used in the simulations . Other forms for the probability law are also possible which gives different exponent BA-exact . However, the results reported here are independent of the value of note1 . Size and average degree of the sub-networks remain the same as for the random sub-networks, i.e. and . The average degree () of a network can be calculated as , where is the number of connections and is the size of the network. With the increase in the value of , deformation from the network having scalefree community structure also increases. Fig. 5 plots various spectral behavior of deformed networks made of the scalefree sub-networks. Fig.5(a) plots the density distribution for the various values of . For small values of , the density is very different from that of the deformed random networks (Fig. 2). It has a triangular shape with a peak at zero. This is a well-known shape for sparse scalefree networks Aguiar-SF ; SJ_pre2007a ; Chung . For , when the scalefree structure of the sub-networks dominates over the random interaction between them, the eigenvalue density distribution does not show any noticeable change. But the NNSD in Fig. 5(b) suggests a possible structure in the network. As shown in Fig. 5(b), for () the NNSD is close to Poisson statistics with a value of the Brody parameter . As increases, value of the Brody parameter increases as well, becoming one for . After this value of , the NNSD does not provide any further insight, and we probe for long-range correlations among eigenvalues. Fig. 5(c) plots the statistics for various values of . It shows similar behavior as for the deformed random networks (see Fig. 4). For , when the network has distinguishable community structure, the value of for which follows the GOE statistics (4) is as small as 25. As is increased, also increases, becoming for .
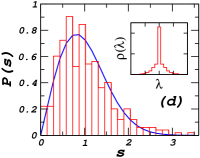
Fig. 5(d) shows the density distribution (inset) and the spacing distribution of the protein-protein interaction network of Helicobacter cosin . The largest connected component of the network has dimension and number of connections . The average degree of this scalefree network is . The density distribution has triangular form with a peak at zero. This behavior of the density distribution suggests scalefree properties of the network Aguiar-SF ; SJ_pre2007a ; Chung , but does not provide information of randomness or structure in the network. To get further insight, we calculate the NNSD and the spectral rigidity of the network. For this, first we unfold the eigenvalues using the procedure explained earlier. The NNSD of the network follows GOE statistics with the value of , suggesting enough random connections in the network. Further test of long-range correlations among eigenvalues shows that the statistics follows the GOE prediction (Eq. 4) up to in Fig. 5(c), and after this value deviation from the universal behavior is seen. It suggests that, though the network has enough random connections which give rise to short-range correlations among eigenvalues, it has strong community structure causing deviation of the statistics from the random matrix behavior after a certain range.
In the present paper we consider only the random interactions between communities. For other kind of interactions, for instance interactions among the scalefree sub-networks as considered in Amaral which leads to a hierarchical scalefree network, the density distribution would show an entirely different behavior from the semi-circular distribution. case would lead to a scalefree topology which has a triangular density distribution with peak at zero. However, spectral fluctuations would show qualitative similar behavior. For small coupling interactions among the sub-networks, the NNSD results would be same as presented here, showing a transition from Poisson to GOE statistics SJ_new , whereas for large coupling interactions the exact range for which the statistics follows GOE would be different from those of the random interactions. Further detailed results of this model as well as real world networks having more complicated structures analyzed under the deformed random matrix framework would be discussed elsewhere SJ_Mahir_new .
V Conclusions and Discussions
The eigenvalue density distribution of networks having two sub-networks tend towards the semi-circular distribution as the random connections between the sub-networks are increased. For very small values of , corresponding to the very small deformation from the community structure, the density distribution does not present any noticeable changes, but the NNSD, which reflects short-range correlations among eigenvalues, show important features. For two random sub-networks, which are almost uncoupled (i.e. ), the NNSD is very close to the Poisson statistics, and as increases, it has a smooth transition to the GOE statistics. Note that this Poisson to GOE transition is found for many different systems, for example spectra of insulator-metal transition, order-chaos transition follow this Poisson-GOE transition rev-rmt . Sade et. al Sade have studied transition to the GOE statistics as a function of site disorder for the spectra of small-world and scale-free networks. Here, by keeping the network structure fixed, disorder at nodes is increased and depending upon the network average degree transition to GOE statistics is seen. The main difference between Sade and the study presented in this paper is the following: we track changes in the spectra with structural changes in the network architecture. As random connections among the sub-networks are increased, first there is transition for the NNSD to the GOE statistics, and this transition occurs for very small value of random connections among networks. This is the crucial and remarkably different result observed here, which suggests that very small random interaction between communities is enough to introduce short-range correlations among them, spreading the randomness in the whole network. Second, further increase in coupling among the sub-networks is reflected by long-range correlations among eigenvalues. For this increase in the value of , the NNSD does not give additional insight to the deformation of the network, as it remains same with the , so we turned our attention to the statistics.
The statistics, which measures long-range correlations among the eigenvalues, detects deformation from a network having two coupled sub-networks, to a single random network. More deformation of the network from community structure, leads to a larger range of for which follows the GOE statistics. Note that, for the case of sub-networks being completely random, the spacing and the statistics of each of them follows RMT prediction. Therefore, any deviation from GOE statistics is due to the community structure these two sub-networks form when considered as a single network.
It is interesting to note that our results resemble the behavior of deformed random matrix ensembles (DGOE) introduced to study the effect of isospin symmetry breaking in nuclei deformed . The qualitative behavior of the spectral density and the statistics of networks presented here is similar to that of deformed matrices studied in Mahir ; Mahir_density ; Mahir_delta3 . The analytical form of the density derived in Mahir_density depends on a parameter measuring the relative strength of the off-diagonal random matrices to the block diagonal random matrices. In similar lines, for deformed networks, we can compare , relative strength of off-diagonal and diagonal networks, with . The results presented here suggest that further investigations of complex networks following similar lines as in deformed random matrices Mahir_density would be useful to have detailed information of communities in the networks SJ_Mahir .
To conclude, we have studied the spectral behavior of networks having community structure, and shown that the NNSD and statistics capture features related to the structure in the network. We investigate the spectral properties of a real world network as well, and compare the results with those of the model networks. On the one hand, results presented in this paper advances the studies of the spectral properties of network with the community structure under the universal RMT framework; on the other hand, variations in the correlations among eigenvalues shed light on the coupling among communities. For the simulations, the community structure in network is modeled by the very simple random or scalefree sub-networks, and the interactions among these sub-networks are considered random, whereas real world networks have richer structure Amaral . However, the results presented here provide a platform to investigate the community structure of networks using a well developed theory of random matrices; the further investigations in this direction would deal with real world networks with richer and more complicated structure under the deformed random matrix framework SJ_Mahir_new ; SJ_Mahir .
VI Acknowledgments
We acknowledge Dr. M. Hussein for useful suggestions and Dr. G. Vattay for stimulating discussions about prospective of the results.
References
- (1) R. Albert and A.-L. Barabási, Rev. Mod. Phys. 74, 47 (2002) and references therein; S. Boccaletti, V. Latora, Y. Moreno, M. Chavez, D.-U. Hwang, Phys. Rep. 424, 175 (2006).
- (2) D. J. Watts and S. H. Strogatz, Nature 440, 393 (1998).
- (3) A.-L. Barabási and R. Albert, Science 286, 509 (1999).
- (4) M. Girvan and M. E. J. Newman, Proc. Natl. Acad. Sci. USA 99, 7821 (2002); M. E. J. Newman, Social Networks 27, 39 (2005); M. E. J. Newman, Proc. Natl. Acad. Sci. USA 103, 8577 (2006); M. J. Krawczyk, Phys. Rev. E 77 065701 (R) (2008).
- (5) E. Ravsaz et al., Science 297, 1551 (2002); R. Guimerá and L. A. N. Amaral, Nature 433, 895 (2005).
- (6) D. M. Cvetković, M. Doob and H. Sachs, Spectra of Graphs : theory and applications, (Academic Press, 3rd Revised edition, 1997).
- (7) M. Doob in Handbook of Graph Theory, edited by J. L. Gross and J. Yellen (Chapman & Hall/CRC, 2004).
- (8) K. -I. Goh, B. Kahng, and D. Kim, Phys. Rev. E 64, 051903 (2001); S. N. Dorogovtsev, A. V. Goltsev, J. F. F. Mendes and A. N. Samukhin, ibid 68, 046109 (2003); E. Estrada, Europhys. Lett. 73 (4) 649 (2006); D. Kim and B. Kahng, Chaos 17 026115 (2007); H. Yang, C. Yin, G. Zhu and B. Li, Phys. Rev. E 77 045101(R) (2008); G. Bianconi, arXiv:0804.1744.
- (9) M. A. M. de Aguiar and Y. Bar-Yam, Phys. Rev. E 71, 016106 (2005); A. N. Samukhin, S. N. Dorogovtsev, and J. F. F. Mendes ibid 77, 036115 (2008).
- (10) M. L. Mehta, Random Matrices, 3rd ed. (Elsevier Academic Press, Amsterdam, 2004).
- (11) T. Guhr, A. Muller-Groeling and H. A. Weidenmuller, Phys. Rep. 299, 189 (1998).
- (12) S. N. Evangelou, Journal of Statistical Physics, 69, 361 (1992).
- (13) P. Erdös and A. Rényi, Publ. Math. Inst. Hungar. Acad. Sci. 5, 17 (1960).
- (14) I. J. Farkas, I. Derényi, A. -L. Barabási, and T. Vicsek, Phys. Rev. E 64, 026704, (2001).
- (15) J. N. Bandyopadhyay and S. Jalan, Phys. Rev. E 76, 026109 (2007).
- (16) F. Chung, L. Lu and V. Vu, Proc. Natl. Acad. Sci. USA 100 6313 (2003).
- (17) A. Banerjee and J. Jost, Networks and Heterogeneous Media 3, 395 (2008); A. Banerjee and J. Jost, Lin. Alg. Appl., 428, 2008, 3015-3022;
- (18) G. Palla and G. Vattay, New J. Phys. 8 307 (2006).
- (19) S. Jalan and J. N. Bandyopadhyay, Phys. Rev. E 76, 046107 (2007).
- (20) S. Jalan and J. N. Bandyopadhyay, Euro. Phys. Letts. (in press).
- (21) P. N. McGraw and M. Menzinger, Phys. Rev. E 77 031102 (2008); G. Zhu, H. Yang, C. Yin and B. Li, ibid 77, 066113 (2008).
- (22) T. Kottos and U. Smilansky, Phys. Rev. Lett. 79, 4794 (1997); J. Phys. A: Math. Gen. 36, 3501 (2003).
- (23) L. Laloux, P. Cizeau, J.-P. Bouchaud, and M. Potters, Phys. Rev. Lett. 83, 1467 (1999); V. Plerou, P. Gopikrishnan, B. Rosenow, L. A. N. Amaral, and H. E. Stanley, Phys. Rev. Lett. 83, 1471 (1999).
- (24) P. Seba, Phys. Rev. Lett. 91, 198104 (2003).
- (25) M. S. Santhanam and P. K. Patra, Phys. Rev. E 64, 016102 (2001).
- (26) G. Palla, I. Derenyi, I. Farkas and T. Vicsek, Nature 435, 814 (2005); M. E. J. Newman, Phys. Rev. E 70, 056131 (2004); A. Arenas, A. Fernandez and S. Gomez, New J. Phys. 10 053039 (2008).
- (27) V. Colizza, A. Flammini, M. A. Serrano and A. Vespignani, Nature Physics 2, 110 (2006).
- (28) M. E. J. Newman, Phys. Rev. E 69, 066133 (2004); M. B. Hastings Phys. Rev. E 74, 035102 (2006); S. Fortunato and M. Barthelemy, Proc. Natl. Acad. Sci. USA 104, 36 (2007) ; P. Schuetz and A. Caflisch, Phys. Rev. E 78, 026112 (2008).
- (29) M. E. J. Newman, Phys. Rev. E 74, 036104 (2006)
- (30) N. Rosenzweig and C. E. Porter, Phys. Rev. E 120, 1698 (1960); C. E. Porter, Statistical Theory of Spectra : Fluctuations (Academic, New York, 1965).
- (31) T. A. Brody, Lett. Nuovo Cimento 7, 482 (1973).
- (32) O. Bohigas, M. -J. Giannoni and C. Schmidt, in Chaotic behaviour in quantum systems edited by G. Casati, p.103 (Plenum Press, NewYork 1985).
- (33) S. N. Dorogovtsev, J. F. Mendes, and A. N. Samukhin, Phys. Rev. Lett. 85, 4633 (2000).
- (34) The relation between the preferential attachment rule used in the manuscript and the degree distribution exponent is, BA-exact , where is the initial attractiveness of nodes and is the number of connections new node makes. For the Barabási-Albert (BA) model BA , which leads to the degree distribution with . In the limit of zero initial connectivity , all new nodes connect only the first one. This case gives , and the network would be star network, with nodes having connection and node with connections. The eigenvalues of this star network are , which gives the spectral density with three peaks at these three values. The analysis and the comments about the spectral behavior of scale-free networks presented in the section IV are made for . Most of the real world networks lie between rev-network . For this range the density distribution show typical triangular shape, and the tail of at large is related to the behavior of the degree distribution . In particular, as , spectra-net . Nearest neighbor spacing distribution for the individual sub-network would show GOE statistics of RMT SJ_pre2007b . The spectral behavior of the combined network would show qualitative similar behavior of transition from Poisson to GOE statistics as coupling between the sub-networks is increased, only the range of statistics for which it follows GOE statistics may be different.
- (35) http://pil.phys.uniroma1.it/ gcalda/cosinsite/extra/data/ proteins/helico
- (36) J. X. de Carvalho, S. Jalan and M. S. Hussein (under preparation).
- (37) M. Sade and R. Berkovits, Phys. Rev. B 68, 193102 (2003);M. Sade, T. Kalisky, S. Halvin and R. Berkovits, Phys. Rev. E 72, 066123 (2005).
- (38) M. S. Hussein and M. P. Pato, Phys. Rev. Lett. 70, 1089 (1993).
- (39) A. C. Bertuola, J. X. de Carvalho, M. S. Hussein, M. P. Pato, and A. J. Sargeant, Phys. Rev. E 71 036117 (2005)
- (40) J. X. de Carvalho, M. S. Hussein, M. P. Pato and A. J. Sargeant, Phys. Rev. E 76, 066212 (2007).
- (41) J. X. de Carvalho, S. Jalan and M. S. Hussein, Phys. Rev. E 79, 056222 (2009)