Avatar Mobility in Networked Virtual Environments:
Measurements, Analysis, and Implications
Abstract
We collected mobility traces of 84,208 avatars spanning 22 regions over two months in Second Life, a popular networked virtual environment. We analyzed the traces to characterize the dynamics of the avatars mobility and behavior, both temporally and spatially. We discuss the implications of the our findings to the design of peer-to-peer networked virtual environments, interest management, mobility modeling of avatars, server load balancing and zone partitioning, client-side caching, and prefetching.
category:
H.5.1 Multimedia Information Systems Artificial, Augments, and Virtual Realitiescategory:
C.2.4 Distributed Systems Distributed Applicationskeywords:
Networked Virtual Environment, Avatar Mobility, Avatar Behavior, Caching, Interest Management, Load Balancing, Peer-to-Peer1 Introduction
The possibility of multiple users communicating and interacting with each other in a networked virtual environment (NVE) over the Internet has excited many researchers in the past 20 years. Building an NVE that scales to many users, while maintaining interactivity requirements, however, remains a difficult challenge. Much research effort has gone into reducing communication overhead, maintaining state consistency, and managing server resources.
These research efforts were previously handicapped by a lack of deployed, open, large-scale NVE systems, on which the researchers could evaluate the effectiveness of their proposed solutions. In particular, the effectiveness of many of these solutions depends heavily on the avatar behavior, movements, and interactions within the NVE. Without such data, previous research mainly based their evaluations either on simulations with a simple model of avatar behavior (such as random way-point mobility model), or on collected traces from small-scale games and NVEs.
In recent years, however, the increase in bandwidth to home users and availability of powerful graphics capability in commodity PCs have lead to development of several NVEs targeted at the Internet mass. Among the notable NVEs are Second Life, There, Active Worlds, and HiPiHi. Second Life is the most popular NVE available, with an average of 38,000 simultaneous users spending 28 million man-hours in January of 2008 alone111http://secondlife.com/whatis/economy_stats.php. Furthermore, the Second Life client is open source, providing opportunities for reverse engineering the protocols on which Second Life runs. We believe that the availability of such large-scale, open NVEs provides exciting opportunities for researchers to evaluate their solutions using a large amount of real traces under realistic scenarios. This belief drives our work in this paper.
This paper presents our effort in collecting and analyzing avatar traces from Second Life. By using a custom Second Life client, we collected the identity, action, positions, and viewing directions of 84,208 avatars over two months, spanning 22 regions on Second Life, giving a total of 62 million records.
We analyze our traces to study the temporal and spatial dynamics of avatars. For temporal dynamics, we ask the following questions: (i) How does avatar population vary over time? (ii) How long does an avatar stay in a region? (iii) How often does an avatar return to the same region? (iv) If an avatar does return, how much time has passed before the avatar returns? and (v) How do avatar arrival and departure rates vary over time?
The traces also provide a rich amount of information on the spatial distribution of avatars in a region and their movement patterns. We divide the region into cells, and ask: Given a cell, (i) how many times does an avatar visit the cell? (ii) How long does an avatar stay in the cell? (iii) How fast does an avatar move in the cell?
We also analyze the contact patterns among the avatars. In particular, we are interested in characterizing (i) the number of avatars within an avatar’s area-of-interest, (ii) the duration two avatars stay within each other’s area-of-interest, and (iii) how dynamic is the set of avatars within an avatar’s area-of-interest.
Our traces and analysis are useful in many ways. First, the traces, which we plan to share with the research community, capture actual movements and activities of large number of avatars. It can be used in trace-based simulations of NVEs, allowing new and existing designs and algorithms to be evaluated under realistic conditions.
Second, the traces can be used to derive and verify new mobility models for NVEs. Most research assumes a mobility model based on random walk [20, 29], random waypoint or their variations [9, 6, 1, 2]. Research, however, has shown that the evaluation results based on these simple models are significantly different from those based on actual traces. A new avatar mobility model for NVE is therefore needed. Our traces and findings serve as a crucial first step towards that goal. The traces can also help in deriving and verifying appropriate models for the spatial distribution of avatars in the virtual world, where past research has assumed that avatars are uniformly distributed [16] and distributed in clusters [19].
Finally, our analysis provides insights into how avatars behave and move in an NVE such as Second Life. This knowledge can lead to design of new and more effective algorithms for NVEs. For instance, in designing a peer-to-peer NVE, it is important to understand the expected churn rate, identify peers that stay in the system for a long time, and understand if (and how) the avatars move and congregate. In designing load balancing and zone partitioning schemes for NVE servers, knowing the expected spatial distribution of avatars and their tendency to moves across zones is helpful.
It is not our intention in this paper to evaluate previous work using our traces, nor do we intend to propose new mobility and avatar behavioral models. These are important research directions that we believe need to be explored, but do not fit into the scope of this paper. Instead, in this paper, we discuss our findings from our analysis of the measured traces, and how the findings will affect various aspects of NVE design in general.
The rest of this paper is structured as follows. We present previous work related to ours in Section 2. Section 3 briefly introduces Second Life. We explain how we collect and verify our data in Section 4. Section 5 presents our analysis of the traces. We discuss the implications of our traces in Section 6. Finally, we conclude in Section 7.
2 Related Work
We now describe previous efforts in collecting avatar traces from networked virtual environments and games. Rieche et al. [25] collected a 5-hour trace of 400 players from an online game called FreeWar. Boulanger et al. [4] collected a trace of 28 players from a game they developed called Orbius. The focus of their work is not on the trace, but rather, the trace is a way to evaluate their proposed algorithms. Rieche et al. use their trace to evaluate a load balancing scheme, while Boulanger et al. use their trace to evaluate different interest management algorithms. Beside traces collected from games, both works use randomly generated movements in their evaluation, and both observe significant differences in their results evaluated using the traces and using generated movements. Their results highlight the importance of having real mobility traces for researchers to evaluate their work.
Tan et al. [27] and Bharambe et al. [3] collected traces from Quake III, a popular, multi-player, first person shooting (FPS) game and developed mobility models to describe the movement of the players. Pittman et al. [24] collected a large trace, comparable in scale to ours, of players movement from World of Warcraft (WoW), a massively multi-player online role playing game (MMORPG), and analyzed the dynamics of the populations, players arrival/departure rate, session length, player distribution, and player movements. FPS games and MMORPGs have different characteristics than NVEs. Players in fast-action, FPS games tend to move around constantly. In MMORPGs, players usually engage in quests to gain level and new abilities. Players tend to gather in a location for an event (e.g. new monsters to fight) and disperse afterwards. Players also tend to move in groups. We observed a different pattern for NVEs.
Most recently, La and Pietro have independently conducted a similar study on mobility in Second Life [17]. Their study, however, focuses on metrics relevant to mobile communications, such as graph theoretic properties of line-of-sight networks formed by the avatars, travel length and time of avatars, and contact opportunities among avatars. Their goal is to use the mobility traces of avatars to model human mobility for applications related to wireless and delay-tolerant networks. On the other hand, we focus on metrics that are of interest to systems design of NVEs.
3 Second Life
Before we describe how we collected our traces, we briefly introduce Second Life in this section. Second Life is an NVE launched by Linden Lab in 2003. It is a so-called metaverse, where users participate in creating the virtual world by constructing buildings and authoring objects. Furthermore, users control avatars that can interact with each other, socialize, and trade user-created objects.
Unlike popular massively multiplayer online games (MMOG) such as World of Warcraft, the virtual world in Second Life is highly dynamic – users can create objects, place them into the virtual world, and write scripts to program the behavior of the objects. In comparison, the world or game maps in MMOG are mainly static and are built by game publishers. As such, it is possible to distribute the data describing the game world on DVDs. In Second Life, however, only a viewer program is distributed to the users. Data pertaining to the virtual world, such as terrain, objects, behavioral scripts, and textures, are downloaded on demand as the user explores and interacts with the virtual world.
The virtual world in Second Life is made up of regions. Each region is a 256m 256m piece of land, managed by a Second Life server process that maintains the states of all avatars and objects within the region. The virtual world in Second Life is not seamless – the user cannot walk seamlessly between regions, but rather has to teleport from region to region. As the user teleports, the state of the avatar is transferred to the destination’s simulator (usually takes order of seconds). Each region has a teleportation point called the landing point, where all arriving avatars will appear.
An activity unique to Second Life is camping, where avatars can earn free virtual money by engaging in certain activities (e.g., get paid by the hour to sit on a chair) Region owners typically use camping to boost the popularity of the regions.
Within a region, a user can walk, run, or fly. The user can also teleport from one place to another within a region, if intra-region teleportation points exist. In this paper, we are interested in collecting the mobility traces of the avatars as they move around within a region. We describe how we collect the traces next.
4 Data Collection
To collect the traces of avatars, we developed a client for Second Life based on an open source library called libsecondlife222www.libsecondlife.org. Our client visits selected regions in Second Life using a bot, and by parsing update packets from the servers, we can obtain information about other avatars in the regions. We log information about all detected avatars at ten second intervals.
Second Life uses an architecture that stores the states of all avatars in a centralized server. The server pushes information about other avatars and objects in the region to the clients, depending on the client’s avatar position. How the server decides which information to push is unfortunately proprietary and unknown to us. It was therefore not clear to us whether our bot is able to track the positions of every avatar on the region. For instance, if the server uses interest management techniques, then only positions of other avatars within the area-of-interest (AoI) of our bot will be updated, while those outside are culled.
We inserted several avatars into Second Life to determine how interest management is done. We observe that culling indeed does occur for avatars outside of the AoI, but, once the bot starts detecting an avatar, updates about that avatar will no longer be culled, even if the avatar moves outside the bot’s AoI. To track the movement of as many avatars as possible, we therefore place our bot at the landing point. As such, all incoming avatars will be immediately detected by the bot and subsequently our bot will receive update of these avatars regardless of where they are in the region. The existing avatars that are already in the region when we started our bot, however, may not be tracked. Fortunately, our measurements show that 95% of the avatars stay less than an hour in the region (see Section 5.1). Thus, after the first couple of hours, our bot should be able to track nearly all of the avatars in the region.
4.1 Difficulties Encountered
We now briefly explain several issues we ran into during our data collection process, which lead to imperfect traces.
One source of imperfection in our traces is related to avatars that are sitting on objects. Second Life reports the locations of these avatars relative to those objects. To recover the position of the avatars, we therefore need to know the position of the objects they are sitting on. We observe that packets containing information on objects are sometimes culled if they fall outside the bot’s AoI. In this case, we are unable to compute the position of the avatars sitting on these objects. Such records are removed from the trace, but only when we compute metrics that require the positions of the avatar. About 8% of our records have unknown avatar positions.
Occasionally, our bots are kicked out by the region owner, as the owner may not take kindly to bots. Each region allows a limited number of avatars inside at any one time, due to server’s resource constraints. An inactive bot occupies a valuable slot that could have been filled by an actively contributing avatar. On a few occasions, region owners went as far as to ban our bots from returning, creating temporal breaks within the data set.
Temporal breaks also happen when our client crashes due to insufficient memory. The libsecondlife library maintains a staggering amount of states about each object and avatar in a region (at least 1 GB in densely populated regions). We have a script to automatically restart the client in such situations, but the bot may not be able to log back to the same region, because the region becomes full during the crash, creating temporal breaks in our traces.
4.2 Verification
Positional prediction techniques, such as dead reckoning, are commonly used in NVE to reduce update frequency between server and clients at the cost of reduced consistency in avatar position. We are concerned with how consistent the reported positions of the avatars are and if any predictions are done at the client.
An experiment was conducted to verify the consistency of the reported position. We placed seven bots on a region called Freebies, with four static bots at each corner of the region, one static bot at the center of the region, and two bots that walk around the region following a random walk model. We log the positions of other avatars in the region as seen by each bot. For each avatar at each time instance, seven records of the positions are obtained. We compute the standard deviations of x and y positions of the avatars seen by these bots. We found that only 1.14% of the reported x positions and 1.39% of the reported y positions have a standard deviations of more than 10 meters, while 9.00% and 10.15% of the records have standard deviations of more than 1 meters for x and y positions respectively. There are instances where the two bots detected the same avatar with reported positions more than 100 meters apart – this happens when the avatar teleports with the region. Delay in receiving updates from the server causes these discrepancies.
Another concern we have is whether our bot consistently observe the same set of avatars. To verify this, we place two bots close together at the teleportation point on Freebies, and each bots recorded the number of avatars it currently knows of every 10 seconds for 30 minutes. We found that the numbers reported by the two bots are very close. Each bot detected an average of 71.22 avatars, and the mean difference between the reported number of avatars at each scan is 1.16 (1.63%). This difference is caused by one to two avatars (who are already in the region when we started our experiments) moving into the AoI of one bot but not the other.
The verification experiments above indicate that our collected data contain some errors, caused by state synchronization delay and interest management techniques used by the server. With no access to the server states, we can only collect the traces at a client, where these errors are unavoidable. Fortunately, we found that the errors are reasonably small and we believe they will not affect the general conclusions we obtain from the analysis of the traces.
4.3 Limitations
Our traces and analysis have two limitations. First, our bot cannot tracks movement of avatars between regions. Second Life does not provide information about the destination of an avatar when it leaves a region. In fact, we cannot differentiate between an avatar logging out and teleporting to another region.
Second, we ignore the z-coordinates of avatars in our analysis. Each avatar position gives the coordinate of the avatar in a 3D space. We observe, however, that most of the time the avatars stay on the ground. We therefore focus only on the x- and y-coordinates. As a result, an avatar that hovers in the air is considered to be at the same position as another avatar standing on the ground if they have the same x- and y-coordinates.
4.4 Regions
| Name | Number of Avatars | Date |
|---|---|---|
| Isis | 2,735 | 28 Mar 2008, Fri |
| Ross | 560 | 11 Mar 2008, Tue |
| Freebies | 3,153 | 11 Mar 2008, Tue |
| The Pharm | 1,537 | 5 Mar 2008, Wed |
| Isis (Long) | 8,795 | 28–31 Mar 2008, Thu to Sun |
While we collected data from 22 regions over several weeks, we focus our analysis on a one-day trace from four regions in this paper, namely Isis, Ross, Freebies, and The Pharm. A summary of these traces are shown in Table 1.
We focus on three popular regions, Isis, Freebies, and The Pharm. Isis has a mature adult theme. Residents can participate in paraphiliac activities, buy adult-novelty items, and camp. Freebies gives away free objects, clothes, accessories, and other inventory items to any resident. It also features a very small camping area. The Pharm is a region focus only on camping. These three regions are consistently among the most popular regions in Second Life.
Ross, a region with medium popularity is chosen to contrast the results from the popular regions. Ross is provided by Linden Lab to distribute information and serves as meeting place for avatars.
Besides popularity and variation in themes, we choice of these four regions is also due to the completeness of their traces. As mentioned in Section 4.3, we encountered temporal breaks in our traces. The set of traces from these regions are the most complete, with only six, small breaks in between. The average break is 8 minutes, with the longest break being 16 minutes and 30 seconds. Out of four days, only 0.8% of the traces are lost due to the breaks.
Besides the above traces, we also included our analysis for a 4-day trace for Isis to study if there is any changes in our observation over multiple days, covering both weekdays and weekends.
We did not choose any unpopular regions to study, as those usually yield few avatars and give no interesting results.
5 Characterizing Avatars
5.1 Session Behavior


We now report on the session behavior of avatars based on the traces in Table 1.
Population over Time: Figure 1 shows how region population changes over time. The three popular regions, Isis, Freebies, and The Pharm exhibits similar patterns in population over time where there is a slight drop in population from 12 noon to 6 pm. The diurnal pattern is not as obvious as observed in other NVEs [24]. The population from Ross exhibits a different pattern, where population increases steadily but suddenly drops. These drops could be due to server reset, causing all avatars (include our bot) to be logged out. We observe similar patterns when studying our traces from other days. Our 4-day Isis trace, for instance, exhibits similar drop, surprisingly, even on weekends.
We have two possible explanations for the lack of obvious diurnal pattern. First, Second Life limits the number of avatars visiting the regions. For popular regions, there is a constant demand for users to enter the region – so, when a user leaves and the region has a slot open, another users is likely to enter the region. Second, Second Life users span many parts of the world. According to the economy statistics published by Linden Lab, about 40% of the users come from North America. Another 40% come from Europe. The rest are from Asia, South America, and Oceania. Users log onto Second Life at all times of the day. The slight drop during 12 noon to 6 pm local time corresponds to daytime in North America. The diurnal pattern caused by users in Europe is not as obvious as the continent spans many time zones.
Arrivals and Departures: Figures 1 and 1 show the number of arrivals and departures over time. These figures show that the population on the regions is highly dynamic, as expected from the maximum number of avatars in a region (Figure 1) and number of unique avatars observed (Table 1). We can see a high churn rate for Freebies, as avatars tend to drop into the region, picks up free items, and leaves. The churn rate is especially high from 12 midnight to 6am (up to 60 churns per hour). The churn rates for The Pharm and Ross are lower, due to the camping activities and low popularity of the region, respectively.
Returning to the Same Island: We are interested in how many times an avatar revisits a region. Surprisingly, even within a day, we observed multiple visits by the same avatar. The maximum number of revisits observed is 55 (for Freebies). We speculate that these avatars might be hoping from region to region. About 25 - 35% of the avatars revisited the same region within a day. The CDF for this metric is shown in Figure 1. Figure 1 shows the CDF for the time that passed between an avatar leaving the region and returning to the region. We call this metric inter-return time. The median inter-return time for the three regions on the day observed ranges from 45 minutes to an hour. 90% of the inter-return time observed is less than 10 hours.
Stay Time: Figure 1 shows the cumulative distribution of how long an avatar stays in a region. We call this the stay time of an avatar. We note that this does not correspond to the time an avatar stays in Second Life, since the avatar could have just teleported to another region rather than leaving Second Life. We compute the stay time by logging the time between the arrival and departure of an avatar, excluding all avatars that are already in the region at the beginning of our trace. The distribution of stay time is highly skewed, close to a power law distribution. An obvious observation is that the stay time at Ross is lower (median of 92 seconds) than that of Isis and Freebies (median of 448 seconds and 373 seconds). The distribution of stay time at The Pharm is skewed towards higher values (despite a median of only 427 seconds) than Isis and Freebies, since avatars have incentives to stay on the island. The periodic reset on Ross could explain the shorter stay time.
5.2 Mobility
We now characterize how avatars move: where they visit, how long do they pause, how fast do they move, and whether they stay in groups. We quantize the regions into equal size cells, and compute a set of metrics for each cell. Figures 5-5 show the choropleth maps of the regions for various metrics. Figure 6 plots the CDF of the same metrics (x-axis in log-scale). Figures 6(b) and 6(c) shows the distribution over all cells visited.
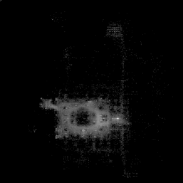

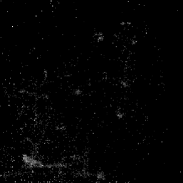
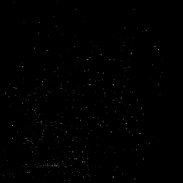


Number of visits: An indication of cell popularity is how many times the avatars visit a cell. We count the number of times an avatar enters a cell . If the same avatar enters and leaves the cell multiple times, it is counted as multiple visits. If an avatar logs out and logs in again, Second Life will place the avatar at the previous position when it logs out. We do not count this entry as a new visit.
Figures 2(a) to 2(d) show the choropleth map of the number of visits to a cell in log-scale. The number of visits to cells is highly skewed. There are many cells that are not visited by any avatars in our traces, and a small number of cells are visited many times. Figure 6(a) shows the CDF for number of visits for all four regions. Freebies has the most visited cells (52% are visited at least once), as its activities spread to all corners of the region (Figure 2(c)). The regions have 2 (Ross) to 17 (Isis) cells that are visited more than 100 times, with the most visited cell having been visited 2487 times (in Isis). This cell corresponds to the landing point on Isis, which can be seen as the bright white spot in Figure 2(a). Other regions show similar spots at their landing points.
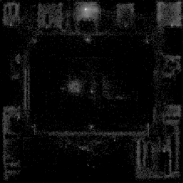
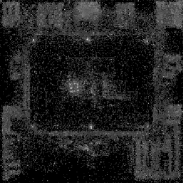
Average pause time: Another indication of the popularity of a cell is the duration an avatar stays in a cell (until it moves to another cell, teleports to another region, or logs out). The total pause time of a cell is the sum of the pause time of all avatars that have ever been to . Note that since we log the movement of avatars every 10 seconds, the pause time has a minimum resolution of 10 seconds. The average pause time of a cell is thus total pause time divided by number of visits. This metric indicates the stickiness of a cell.
Figures 3(a) to 3(d) show the choropleth map of the average pause time of a cell in log-scale. Comparing these maps to Figures 2(a) to 2(d) shows there exist cells with high average pause time that are not visited often (for instance, the group of cells at the top right quadrant of the map in Figure 3(a)). The distribution of average pause time is again highly skewed (Figure 6(b)). On Isis and Freebies, avatars pause for less than 100 seconds in 95% of the visited cells but 11 and 5 avatars pause more than 3 hours on Isis and Freebies respectively. In the camping region, The Pharm, 40 avatars paused more than 3 hours. The longest average pause time observed is just over 14 hours in The Pharm.
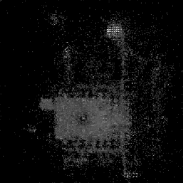
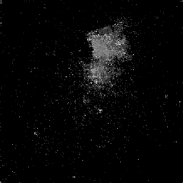
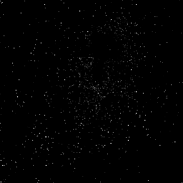
Average speed in a cell: For each pair of consecutive recorded avatar positions, we note the time between the records and the distance traveled . The average speed of that avatar is then simply . We consider as the speed of a movement in cell , where is the new cell the avatar is in. The average speed in a cell is then the average speed over all movements.
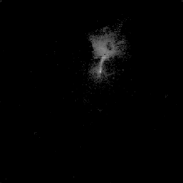
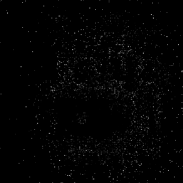
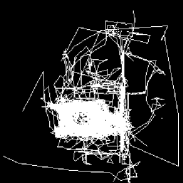
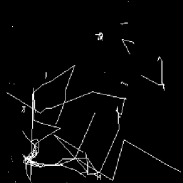
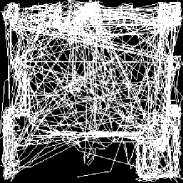
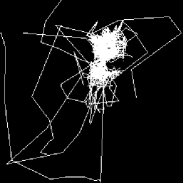
The map for average speed is shown in Figures 4(a) to 4(d), with the corresponding CDF shown in Figure 6(c). Comparing these maps to Figures 2(a) to 2(d) shows bright spots (high average speed) outside of the frequently visited cells. This observation confirms the intuition that avatars move quickly (either run or fly in Second Life) in non-interesting regions but move normally (walk) within interesting regions. This is confirmed in Figure 5(a) to 5(d), which show the trail of the avatars in a one-hour sub-trace (6am) of the four one-day traces in Table 1. A long and straight line means the avatar is moving at a fast speed (including intra-region teleport).
Figure 6(c) indicates something interesting: the average speed of about 30% of the visited cells have a zero average speed in The Pharm and Ross, implying that some avatars never move – likely these users log in and leave the session running, exploiting camping facilities to earn virtual money (Note that Second Life leaves the avatar at their previous location when the user logs in).
5.3 Contact Patterns
To characterize the spatial relationship among avatars, we look at meetings among the avatars. Two avatars meet if their distance in a region is within a certain threshold. We use 64m as our threshold since this is the default AoI distance in Second Life.
Meeting Durations: Figure 6(d) shows the distribution of meeting duration. Meeting durations are long – over 50% of the durations are over 82 seconds (for Freebies) and 303 seconds (for The Pharm). On The Pharm, 9% of the meetings are over an hour.
Average Meeting Size: A closely related measure we compute is average meeting size over time. For every 10 seconds, we computed the meeting size – the number of avatars within their AoI. We then compute, for each avatar, the average meeting size over time. We found that the meeting size is generally large in the regions we studied. On The Pharm, the average meeting size for avatars is above 40 for 99% of the avatars. Even on Ross, a medium popularity region, the median meeting size is 11.4.
Meeting Stability: To see how the avatars in a meeting change over time, for each avatar , we take the ratio of average meeting size over the number of unique avatars ever met by in the region. We call this ratio meeting stability. If an avatar’s stability is 1, then the avatar always meets with the same set of avatars while she is in the region. The distribution of this ratio is shown in Figure 6(f). Avatars in The Pharm and Ross have a high meeting stability, with 50% or more having a stability of 0.67 and 0.79 respectively. 19% of avatars have a stability of 1.0 in Ross. Avatars in Freebies show much more dynamic behavior, with a median stability of only 0.33.
5.4 Temporal Variation
We are interested in seeing if the general observations we made above change over time. We analyze a four-day trace from Isis, hour-by-hour. We pick the number of visits to a cell as the metric to study, as it is a good indication of whether a cell is popular. For each cell, we sample the number of visits to that cell in each hour, and computed the standard deviation of the samples.
We found very little variation in the number of visits to the cells, hour-by-hour, over the course of four days. 99% of the cells have a standard deviation less than 1.05. The largest standard deviation, 20, is observed at the landing point.
6 Implications
In this section, we discuss our observations from the traces and how they relate to existing research in NVEs.
6.1 Peer-to-peer NVEs
Centralized server architectures, such as those employed by Second Life, do not scale well to a large number of players. This challenge of scalability has motivated research into alternative architectures, one of which is the peer-to-peer architecture, where clients communicate directly with other clients through an overlay, without going through the server [11, 12]. A client may also share some responsibility of the server (such as maintaining states) [3, 16].
Our traces show evidence of high churn rate, averaging about one every two minutes on the popular regions, and could have drastic effect on the efficacy of peer-to-peer NVEs. Such high churn rates imply that the system has to continuously configure the peer-to-peer overlay and sufficient redundancy needs to be built-in to prevent loss of information [3]. Our analysis shows that the stay time is highly skewed. This observation supports peer-to-peer NVEs that employ super-nodes to store states and manage other peers [16, 6]. The avatars who stayed for a long time in a region may be good candidates to be super nodes.
Our traces also suggest a novel and interesting way to identify the potential super nodes. We observe that there are cells within the regions that are “sticky” – avatars tend to pause within these cell for much longer time than other cells. Thus, avatars that pause at these sticky cells are more likely to pause for a long time.
Many P2P NVE schemes build an overlay by connecting peers within an AoI as neighbors [15, 12, 8]. Our traces support this design in regions with low popularity and low mobility (such as Ross and The Pharm), where the meeting stability is relatively high. For regions such as Isis and Freebies, where the AoI neighbors change frequently, reducing overhead in establishing and tearing down connections among neighbors remains a challenge.
6.2 Zone Partitioning and Load Balancing
Besides P2P architectures, another architecture that has been proposed to improve the scalability of NVEs is to employ a cluster of servers. The game world is divided into zones, each managed by a server. This architecture is similar to what Second Life employs today. The research challenge is to make the game world seamless by making zoning transparent to the users.
A consequence of seamless zone partitioning is that we can dynamically repartition the zones to balance the load on the servers [30, 7, 19, 9]. Two important factors that affect any load balancing schemes are population in a zone, and movement across zones.
Our traces show that, unsurprisingly, the spatial distribution of avatars is far from uniform, especially for Isis and The Pharm. This observation supports the need for more sophisticated partitioning scheme, beyond grid-based partitioning.
We also observed from our traces that avatars tend to move quickly in lowly populated, non-interesting areas within a region. This creates another issue in which such fast-moving avatars have to be handed off from one server to another as they move across the zones, increasing server overheads. The existence of such behavior also points to the importance of load balancing schemes that dampen sensitivity to minor increase in load – to avoid frequent triggers of the load balancing mechanism due to such fast-moving avatars. Our traces show that the popularity of cells does not show much variation over time, suggesting that dynamic load re-balancing of zone would occur only rarely.
6.3 Interest Management
Interest management techniques suppress updates from one avatar to another avatar if the two avatars are deemed to be irrelevant to each other. For peer-to-peer architectures, there is no centralized authority that stores the states of all avatars. Researchers have previously proposed novel, distributed schemes to determine the interest between two avatars [20, 26]. The ideas behind these schemes are that, two avatars exchange their locations and each computes a safe zone333the term zone here has no relationship to that in Section 6.2, based on occlusions and visibility information, where they can remain in without needing to update each other. If one avatar moves out of this safe zone, they exchange their location again and recompute the safe zones.
Our traces mean both good news and bad news for these schemes. On one hand, we found that in interesting cells, where there are typically many occlusions, avatars move slowly. Thus avatars need to update each other rarely. On the other hand, in non-interesting cells, there are few occlusions and avatars move quickly, and thus need to update their locations to each other frequently.
Since determining visibility between avatars can be expensive, another popular technique for determining relevancy between two avatars is to use the AoI – two peers update each other as long as their avatars are in the other’s AoI. Our traces indicates large average meeting size (Figure 6(e)), suggesting high overhead in exchanging updates for this technique.
6.4 Mobility Modeling
Our traces are useful in designing and verifying new mobility models for NVEs. We observed that on popular regions such as Isis and Freebies, avatars tend on congregate in interesting places and move at a slower speed. They also move faster in non-interesting places, perhaps exploring and looking for interesting things, or moving from one interesting place to another (See Figures 5(a)-5(d)). This observation suggests that simple mobility models such as random walk and random way-point [13] are insufficient in modeling mobility of all regions in NVEs such as Second Life.
The movement within high density areas in a region seems to suggest a pathway model – where avatars move along constrained paths (such as corridors or bridges) and visit various rooms [28]. This model, however, does not account for the high speed movements when avatars move in non-interesting cells. Thus, our measurements seem to suggest that a hybrid mobility model that incorporates both random way-point mobility model (for outdoor) and pathway mobility model (for indoor) would be more suitable. Our analysis also suggests the mobility model should incorporate skewed distributions in movement speed and pause time.
6.5 Prefetching
Prefetching is commonly used to reduce the object access latency in NVEs [5, 10, 18, 23]. The key to successful prefetching is predicting accurately which objects are needed, so that bandwidth is not wasted in retrieving objects that will not be eventually used.
Second Life prefetches the data within a circular region of an avatar. We found from our Isis and Freebies traces, however, that avatars only spent 18% of their time rotating around a point.
Our extended analysis of the multiple day traces reveals that the popularity of the cells in a region do not change over days, or even over hours. This observation suggest that we can use short-term, historical information about the popularity of a cell as an input to the prefetching algorithm to help with predictions.
6.6 User-based Caching
Our traces show that even within a day, there are multiple revisits to the same region by the same avatar. This pattern supports user-based caching in Second Life. It also suggests the possible benefits of region-aware caching, which considers access patterns to a region, in addition to access patterns to objects, in the cache replacement algorithm – so that if a user is hopping from region to region, objects from a region they repeatedly visit are not evicted from the cache when they visit other region.
7 Conclusion
This paper presents our effort in collecting and analyzing large traces of avatar mobility in Second Life. We focus on four regions with different characteristics in this paper. It would be interesting to capture such traces on regions which hold transient events (such as parties), where popularity could vary both spatially and temporally.
In this paper, we computed baseline metrics related to system design in NVEs. One could mine the traces for answers to other interesting questions (such as whether an avatar tends to move towards cells with other avatars). We plan to continue analyzing our traces to reveal interesting patterns in avatar mobility.
We also discussed how our findings could impact many other aspects of NVE design and suggested several potentially beneficial ideas (e.g., identifying super-nodes, region-aware caching, and popularity-based prefetching). We plan to investigate these ideas in depth and evaluate their effectiveness using our traces.
Acknowledgment
We thank Vikram Srinivasan of Bell Labs Research India for useful discussions throughout this project.
References
- [1] H. Backhaus and S. Krause. Voronoi-based adaptive scalable transfer revisited: gain and loss of a voronoi-based peer-to-peer approach for mmog. In Proc. of NetGames ’07, pages 49–54, Melbourne, Australia, 2007.
- [2] A. Bharambe, M. Agrawal, and S. Seshan. Mercury: supporting scalable multi-attribute range queries. In Proc. of SIGCOMM ’04, pages 353–366, Portland, OR, 2004.
- [3] A. Bharambe, J. Pang, and S. Seshan. Colyseus: a distributed architecture for online multiplayer games. In Proc. of NSDI ’06, pages 12–12, San Jose, CA, 2006.
- [4] J-S. Boulanger, J. Kienzle, and C. Verbrugge. Comparing interest management algorithms for massively multiplayer games. In Proc. of NetGames ’06, page 6, Singapore, 2006.
- [5] A. Chan, R. W. H. Lau, and B. Ng. A hybrid motion prediction method for caching and prefetching in distributed virtual environments. In Proc. of VRST ’01, pages 135–142, Baniff, Alberta, Canada, 2001.
- [6] A. Chen and R. R. Muntz. Peer clustering: a hybrid approach to distributed virtual environments. In Proc. of NetGames ’06, page 11, Singapore, 2006.
- [7] J. Chen, B. Wu, M. Delap, B. Knutsson, H. Lu, and C. Amza. Locality aware dynamic load management for massively multiplayer games. In Proc. of PPoPP ’05, pages 289–300, Chicago, IL, 2005.
- [8] J.F. Chen, W.C. Lin, H.S. Bai, and S.Y. Dai. A message interchange protocol based on routing information protocol in a virtual world. In Proc. of 19th Int. Conf. on Advanced Information Networking and Applications (AINA 2005), pages 377–384, Taipei, Taiwan, March 2005.
- [9] R. Chertov and S. Fahmy. Optimistic load balancing in a distributed virtual environment. In Proc. of NOSSDAV ’06, pages 74–79, May 2006.
- [10] J. H. P. Chim, M. Green, R. W. H. Lau, H. V. Leong, and A. Si. On caching and prefetching of virtual objects in distributed virtual environments. In Proc. of ACM MULTIMEDIA ’98, pages 171–180, Bristol, UK, 1998.
- [11] L. Gautier and C. Diot. Design and evaluation of MiMaze, a multi-player game on the Internet. In International Conference on Multimedia Computing and Systems, pages 233–236, 1998.
- [12] S-Y. Hu, J-F. Chen, and T-H. Chen. VON: a scalable peer-to-peer network for virtual environments. IEEE Network, 20(4):22–31, July-Aug. 2006.
- [13] D. B. Johnson and D. A. Maltz. Dynamic source routing in ad hoc wireless networks. In Imielinski and Korth, editors, Mobile Computing, volume 353. 1996.
- [14] T. Johnson and D. Shasha. 2Q: A low overhead high performance buffer management replacement algorithm. In Proc. of VLDB ’94, pages 439–450, San Francisco, CA, 1994.
- [15] J. Keller and G. Simon. Solipsis: A massively multi-participant virtual world. In Proc. of International Conference on Parallel and Distributed Techniques and Applications, pages 262–268, Las Vegas, NV, 2003.
- [16] B. Knutsson, H. Lu, W. Xu, and B. Hopkins. Peer-to-peer support for massively multiplayer games. In Proc. of INFOCOM ’04, March 2004.
- [17] C-A. La and M. Pietro. Characterizing user mobility in Second Life. Technical Report RR-08-212, Institut Eurecom.
- [18] R. W. H. Lau, J. H. P. Chim, M. Green, H. V. Leong, and A. Si. Object caching and prefetching in distributed virtual walkthrough. Real-Time Syst., 21(1/2):143–164, 2001.
- [19] J. C. S. Lui and M. F. Chan. An efficient partitioning algorithm for distributed virtual environment systems. IEEE Trans. Parallel Distrib. Syst., 13(3):193–211, 2002.
- [20] Y. Makbily, C. Gotsman, and R. Bar-Yehuda. Geometric algorithms for message filtering in decentralized virtual environments. In I3D ’99: Proc. of the 1999 symposium on Interactive 3D graphics, pages 39–46, Atlanta, GA, 1999.
- [21] N. Megiddo and D. S. Modha. ARC: A self-tuning, low overhead replacement cache. In Proc. of FAST ’03, pages 115–130, San Francisco, CA, 2003.
- [22] E. J. O’Neil, P. E. O’Neil, and G. Weikum. The LRU-K page replacement algorithm for database disk buffering. In Proc. of SIGMOD ’93, pages 297–306, Washington, DC, 1993.
- [23] S. Park, D. Lee, M. Lim, and C. Yu. Scalable data management using user-based caching and prefetching in distributed virtual environments. In Proc. of VRST ’01, pages 121–126, Baniff, Alberta, Canada, 2001.
- [24] D. Pittman and C. GauthierDickey. A measurement study of virtual populations in massively multiplayer online games. In Proc. of NetGames ’07, pages 25–30, Melbourne, Australia, 2007.
- [25] S. Rieche, K. Wehrle, M. Fouquet, H. Niedermayer, L. Petrak, and G. Carle. Peer-to-peer-based infrastructure support for massively multiplayer online games. In Proc. of the 4th IEEE Consumer Communications and Networking Conference, pages 763–767, Jan. 2007.
- [26] A. Steed and C. Angus. Supporting scalable peer to peer virtual environments using frontier sets. In Proc. of IEEE Virtual Reality, pages 27–34, 12-16 March 2005.
- [27] S. A. Tan, W. Lau, and A. Loh. Networked game mobility model for first-person-shooter games. In Proc. of NetGames ’05, pages 1–9, Hawthorne, NY, 2005.
- [28] J. Tian, J. Haehner, C. Becker, I. Stepanov, and K. Rothermel. Graph-based mobility model for mobile ad hoc network simulation. In Proc. of the 35th Annual Simulation Symposium, page 337, Washington, DC, 2002.
- [29] K-H. Vik, C. Griwodz, and P. Halvorsen. Applicability of group communication for increased scalability in MMOGs. In Proc. of NetGames ’06, page 2, Singapore, 2006.
- [30] B. De Vleeschauwer, B. Van Den Bossche, T. Verdickt, F. De Turck, B. Dhoedt, and P. Demeester. Dynamic microcell assignment for massively multiplayer online gaming. In Proc. of NetGames ’05, pages 1–7, Hawthorne, NY, 2005.