The Physical Scale of the Far–Infrared Emission in the Most Luminous Submillimeter Galaxies
Abstract
We present high resolution submillimeter interferometric imaging of two of the brightest high–redshift submillimeter galaxies known: GN20 and AzTEC1 at 0.8 and 0.3 arcsec resolution respectively. Our data – the highest resolution submillimeter imaging of high redshift sources accomplished to date – was collected in three different array configurations: compact, extended, and very extended.We derive angular sizes of 0.6 and 1.0 arcsec for GN20 and 0.3 and 0.4 arcsec for AzTEC1 from modeling their visibility functions as a Gaussian and elliptical disk respectively. Because both sources are B–band dropouts, they likely lie within a relatively narrow redshift window around , which indicates their angular extent corresponds to physical scales of 4-8 and 1.5-3 kpc respectively for the starburst region. By way of a series of simple assumptions, we find preliminary evidence that these hyperluminous starbursts – with star formation rates yr-1 – are radiating at or close to their Eddington limit. Should future high resolution observations indicate that these two objects are typical of a population of high redshift Eddington–limited starbursts, this could have important consequences for models of star formation and feedback in extreme environments.
Subject headings:
cosmology: observations – galaxies: evolution – galaxies: high–redshift – galaxies: starburst – galaxies: submillimeter – galaxies: formation1. Introduction
| Target | Configuration | Coverage | Beam Size | Date | Obs. Timea | Referenceb | |
|---|---|---|---|---|---|---|---|
| [k] | [arcsec] | [dd.mm.yy] | [hrs] | ||||
| GN20 | COM | 15-75 | 20.02.05, 05.03.05 | 0.04, 0.06 | 10.4 | I06 | |
| EXT | 40-200 | 10.02.08, 11.02.08 | 0.04, 0.04 | 5.3 | This work | ||
| AzTEC1 | COM | 20-75 | 17.01.07 | 0.05 | 5.6 | Y07 | |
| EXT | 50-250 | 16.01.08 | 0.03 | 4.0 | This work | ||
| VEX | 60-550 | 05.04.08 | 0.03 | 3.4 | This work |
Wide area surveys at millimeter (e.g., Greve et al., 2004; Bertoldi et al., 2007; Scott et al., 2008) and submillimeter (e.g., Smail et al., 1997; Hughes et al., 1998; Barger et al., 1998; Pope et al., 2006; Coppin et al., 2006) wavelengths have revealed a large population of ultra– and hyperluminous infrared galaxies – ULIRGs and HyLIRGs – at high redshift (median for a radio–selected sample Chapman et al., 2005). Since their initial discovery it has become clear that these “submillimeter galaxies” (SMGs) are likely massive, gas–rich merging systems (Frayer et al., 1998, 1999; Chapman et al., 2003; Greve et al., 2005; Tacconi et al., 2006, 2008) that represent massive galaxies in formation (Scott et al., 2002; Blain et al., 2004). Extremely luminous infrared objects take on increasing cosmological importance at (Sanders & Mirabel, 1996; Le Floc’h et al., 2005), and may dominate cosmic star formation for up to the first half of the lifetime of the universe (Blain et al., 1999, 2002).
Despite significant progress over the past decade, a more complete understanding of SMGs has been hampered in part by the relatively poor resolution of submillimeter cameras ( arcsec FWHM). In particular, the size scale of the starburst region – traced by the rest frame far infrared (IR) – potentially provides important insights into the nature of the engine driving the tremendous luminosity of these systems. If they are scaled up versions of local ULIRGs, we would expect far–IR emission on scales of kpc (e.g., Downes & Solomon, 1998; Iono et al., 2007, see also Iono et al. 2008, in preparation). Hydrodynamic modeling of merger driven nuclear starbursts (e.g., Mihos & Hernquist, 1994) of the kind thought to drive many SMGs (Chapman et al., 2003; Tacconi et al., 2006, 2008) can be somewhat more compact, a result that could have important physical consequences: Eddington arguments suggest a minimum size scale for such regions (Murray et al., 2005; Thompson et al., 2005). Unfortunately, at typical SMG redshifts, all of these size scales are far smaller than the typical angular resolution of submillimeter cameras on single–dish instruments.
The first breakthrough came with deep radio continuum surveys, which leveraged the local far–IR/radio correlation (Condon, 1992) in combination with statistical arguments (Ivison et al., 2002, 2007) to associate faint radio counterparts within the submillimeter beam with SMGs. Higher resolution radio imaging of these sources (Chapman et al., 2004; Biggs & Ivison, 2008) found a range of source structures on physical scales of kpc with a median of 5 kpc. While promising, this technique assumes a spatially resolved far–IR/radio correlation which is not particularly well understood locally (e.g., Hippelein et al., 2003; Murphy, 2006; Tabatabaei et al., 2007). As a consequence, these results are not straightforward to interpret.
This motivates high–resolution imaging of the rest frame far–IR directly, via submillimeter interferometry. The vast majority of previous work was done at resolutions of arcsec, and found that the far–IR continuum in SMGs originates at physical scales of kpc (Neri et al., 2003; Greve et al., 2005; Tacconi et al., 2006; Wang et al., 2007; Younger et al., 2007, 2008; Dannerbauer et al., 2008). More recently, very high resolution CO imaging by Tacconi et al. (2008) showed that gas motions in typical SMGs are disordered on scales of kpc, suggesting that they are ongoing major mergers.
In this paper, we present high resolution (beam size arcsec) 890 continuum imaging of two of the brightest SMGs known – GN20 (Pope et al., 2006; Iono et al., 2006) and AzTEC1 (Younger et al., 2007; Scott et al., 2008) – with the Submillimeter Array (SMA: Ho et al., 2004). By targeting the brightest – and therefore likely the most luminous (Blain & Longair, 1993) – objects, we constrain the physical scale of the far–IR in extreme conditions. In addition, since these objects are thought to lie at higher redshift than radio–selected samples (Younger et al., 2007), they offer an intriguing probe of the nature of star formation at earlier epochs. Throughout this work we assume a concordance cosmology with , , and .
2. Observations and Data Reduction
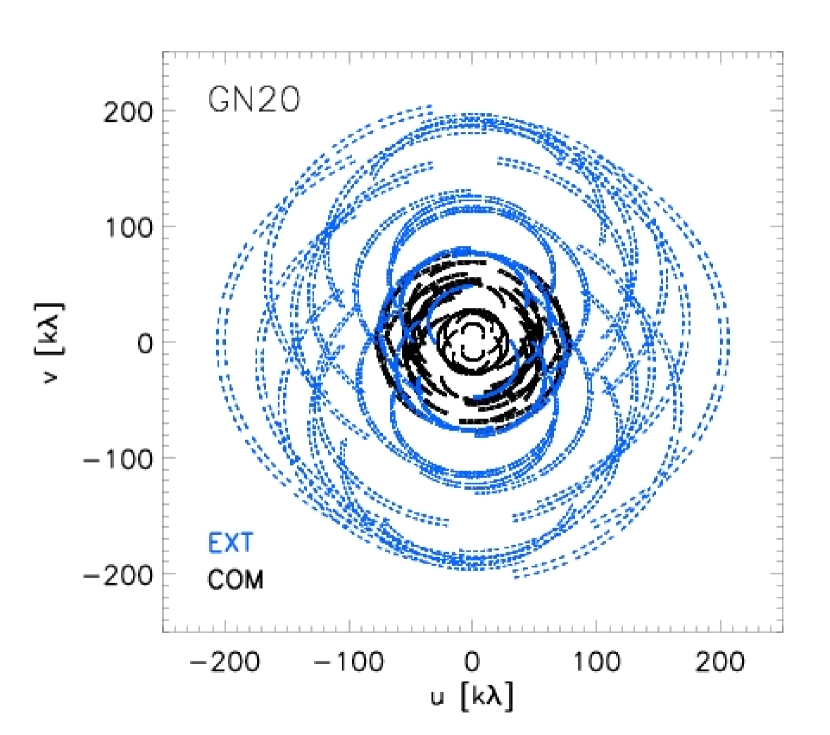
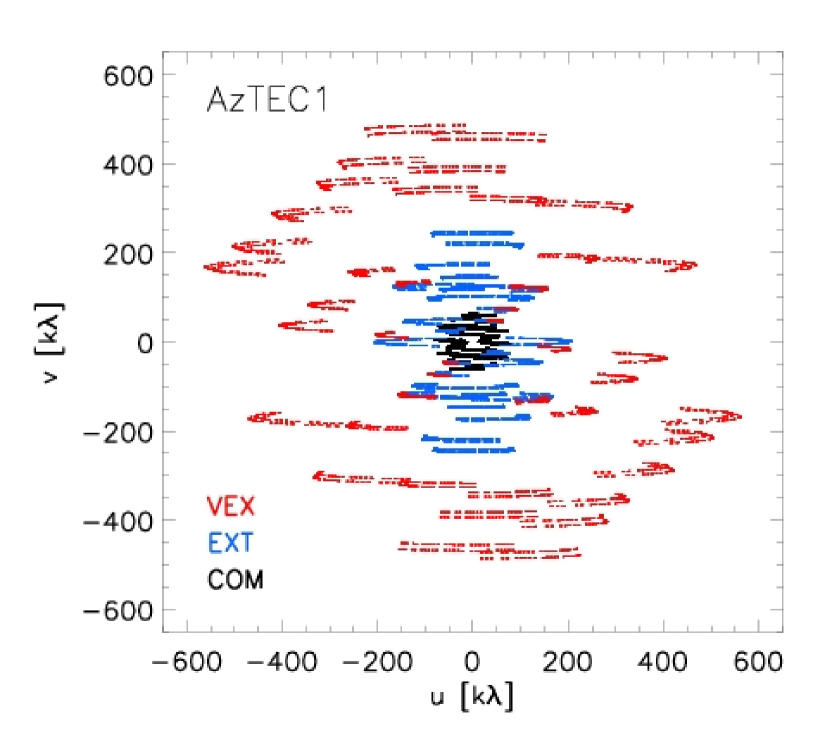
The two targets were GN20 – the brightest 850 source in the Submillimeter Common–User Bolometric Array (SCUBA: Holland et al., 1999) survey of the Hubble Deep Field North (HDFN: see Pope et al., 2006), and AzTEC1 – the brightest 1.1mm source in the AzTEC (Wilson et al., 2008) survey of the COSMOS field (Scott et al., 2008). Both were previously detected as single point–sources with flux densities of (Iono et al., 2006) and mJy (Younger et al., 2007) respectively with the SMA in compact configuration (COM). We have re–observed both these targets with the SMA in extended configuration (EXT), which provides a improvement in angular resolution over COM, using the same pointing center as the COM tracks. The EXT tracks – two for GN20, one for AzTEC1 – were taken in excellent weather in January and February 2008. Since AzTEC1 was unresolved in the EXT track (see § 3 and Figure 3), we re–observed it in very extended configuration (VEX) in April 2008, which provided a further improvement in angular resolution. For details on the tracks, configurations ( range, beam size, etc.), and observing conditions, see Table 1.
The receiver was tuned to 345 GHz in the USB, and averaged with the LSB for an effective bandwidth of 4 GHz centered at 340 GHz. For GN20, passband calibration was done using 3C273 and 1921-293, and primary flux calibration was done using Titan. The target was observed on a 10 minute cycle – 5 minutes on source, 5 minutes on calibrators – with two primary gain calibrators: 1048+717 ( Jy; 14 degrees away) and 1153+495 ( Jy; 14 degrees away). For AzTEC1, passband calibration was done using 3C111 and 3C273, and primary flux calibration was done using Ceres. As with GN20, the target was observed on a 10 minute cycle with two primary gain calibrators: 1058+015 ( Jy; 15 degrees away) and 0854+201 ( Jy; 24 degrees away). Because Ceres is known to be variable at the level due to rotation (Altenhoff et al., 1994; Redman et al., 1998; Barrera-Pineda et al., 2005), we confirm this flux scale by checking that the flux density for 0854+201 derived from this track ( Jy) is consistent to that measured one day earlier ( Jy) for which Titan was the primary flux calibrator.
In addition to the two primary targets, we observed a nearby test quasar once every 60 minutes throughout the track to empirically verify the phase transfer and inferred source structure, and estimate the systematic positional uncertainty. The test quasars for GN20 and AzTEC1 were J1302+578 ( Jy; 5.5 degrees away) and J1008+063 ( Jy; 5 degrees away) respectively. Both are included in both the JVAS (Patnaik et al., 1992; Browne et al., 1998) and VLBA Calibrator (Ma et al., 1998; Beasley et al., 2002) surveys of compact, flat–spectrum radio sources, and have absolute positions known to better than 20 mas.
For the VEX track on AzTEC1, time dependent gain calibration dervied from 1058+015 left clear, slow, residual phase variations on 0854+201 (and J1008+063) due to uncertainties in the baseline parameters or other limitations of the SMA interferometer model. To improve the phase transfer and prevent decorrelation, an additional gain calibration was performed using J1008+063, just 4 degrees away from AzTEC1 in declination, since conditions were good enough to yield sufficient signal-to-noise () in each of the hourly scans on this source. This additional step minimized the phase errors owing to baseline effects in the calibrated visibilities. Remaining phase fluctuations dominated by the atmospheric effects on short timescales left an effective seeing sizescale of arcsec in J1008+063 (see § 3 and Figure 4 for further discussion).
We also make use of extensive multiwavelength data in both fields. For the HDFN, this includes HST/ACS B–, V–, i–, and z–band optical (Giavalisco et al., 2004a), IRAC 3.6–8.0 and MIPS 24 (Dickinson et al., 2003), and VLA 20cm (Biggs & Ivison, 2006) imaging data. For the COSMOS field (see Scoville et al., 2007, for an overview), this includes Subaru ground based optical (Taniguchi et al., 2007), HST/ACS i–band (Koekemoer et al., 2007), IRAC 3.6–8 and MIPS 24 (Sanders et al., 2007), and VLA 20cm (Schinnerer et al., 2007) imaging.
3. Results
| Name | Config.a | Model | ||||||||
|---|---|---|---|---|---|---|---|---|---|---|
| [J2000] | [J2000] | [arcsec] | [arcsec] | [mJy] | [arcsec] | [arcsec] | [deg] | |||
| GN20 | C | Point | 12:37:11.920 | +62:22:12.17 | 0.10e | 0.10e | … | … | … | |
| E | Gaussian | 12:37:11.898 | +62:22:12.14 | 0.06 | 0.09 | 15 | ||||
| E | Disk | 12:37:11.897 | +62:22:12.16 | 0.06 | 0.09 | 25 | ||||
| C+E | Gaussian | 12:37:11.903 | +62:22:12.16 | 0.06 | 0.09 | 35 | ||||
| C+E | Disk | 12:37:11.901 | +62:22:12.17 | 0.05 | 0.06 | -25 | ||||
| AzTEC1 | C | Point | 09:59:42.859 | +02:29:38.21 | 0.11 | 0.20 | … | … | … | |
| E | Point | 09:59:42.863 | +02:29:38.19 | 0.07 | 0.07 | … | … | … | ||
| C+E | Point | 09:59:42.863 | +02:29:38.19 | 0.05 | 0.06 | … | … | … | ||
| Vf | Gaussian | 09:59:42.863 | +02:29:38.20 | 0.04 | 0.06 | 40 | ||||
| Vf | Disk | 09:59:42.863 | +02:29:38.20 | 0.04 | 0.06 | 25 |
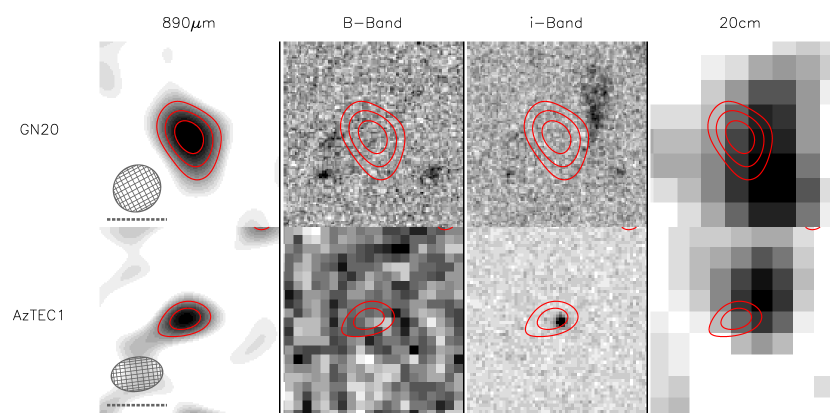
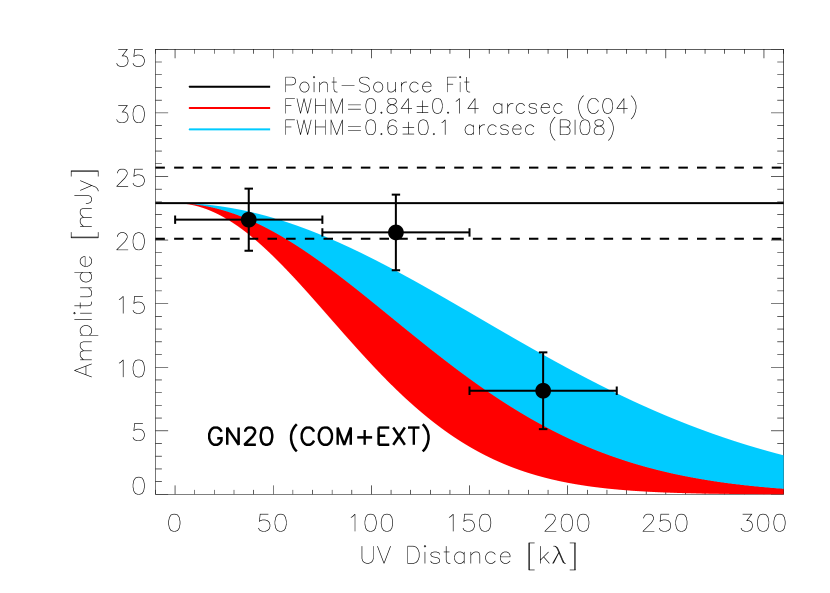
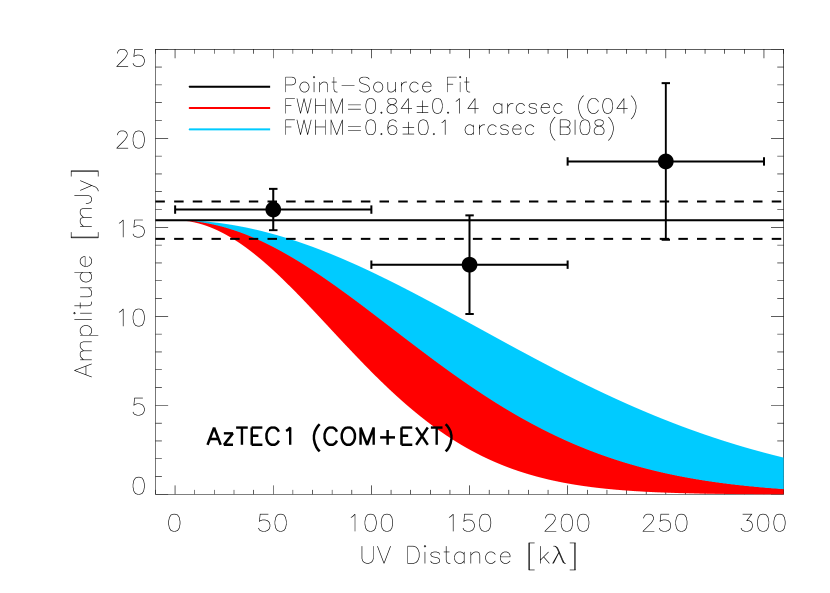
Both targets were detected at high significance by the SMA in EXT configuration with a arcsec beam. The maps, along with overlays on multiwavelength imaging data, are presented in Figure 2. Source structure derived from the calibrated visibilities – which show flux density as a function of decreasing angular scale – and the empirical verification of phase transfer are summarized in Figures 3 and 4, and in Table 2.
GN20 shows evidence of being partially resolved by the SMA in EXT configuration, with a characteristic angular scale of arcsec (see Figure 3 and Table 2) as inferred from modeling its visibility as both a Gaussian and elliptical disk. Its submillimeter position is coincident with a bright IRAC 3.6–8 and faint MIPS 24 ( Jy; Pope et al., 2006) source, and roughly so with a radio source ( Jy; arcsec away). The SMA map is also consistent with the radio morphology, which shows some evidence of being resolved along its major axis with a beam size of arcsec (Biggs & Ivison, 2006). High–resolution ( arcsec PSF) ACS imaging shows that the submillimeter detection is not coincident with the nearby optical “smudge” . However, since this source is a B–band dropout, which suggests a redshift range consistent with the observed radio–to–submillimeter (see Carilli & Yun, 1999; Yun & Carilli, 2002) and 24–to–submillimeter (see Wang et al., 2007; Younger et al., 2007) flux density ratios of GN20 (see § 4), it is plausible that this object is physically associated with GN20 and represents a region of lower dust opacity.
AzTEC1 is not resolved by the SMA in EXT configuration: its visibility function is flat out to k, which suggests a characteristic angular scale of arcsec (see Figure 3). The inferred flux density from the EXT track () is furthermore consistent with that from the COM track ( mJy; Younger et al., 2007). The EXT detection is coincident with its compact i–band counterpart in ACS imaging, a faint IRAC 3.6–8 source (Younger et al., 2007), and roughly so with the radio counterpart ( Jy; arcsec away) to within the uncertainties – though Figure 2 appears to show a potentially significant offset between the radio and SMA positions, this is roughly within the total uncertainty in the measurement of their relative position111The total uncertainty in the offset between the SMA and VLA positions is the combined error from the statistical and systematic uncertainties in the SMA position ( arcsec and arcsec), the systematic uncertainty in the test quasar’s absolute position ( mas), and the statistical and systematic uncertainties in the radio position ( arcsec; mas; Schinnerer et al., 2007). This yields a total uncertainty of arcsec which is comparable to the observed discrepancy in Figure 2.. It is not detected in the deep COSMOS 24 imaging (Younger et al., 2007). The submillimeter size of AzTEC1 is also consistent with its 20cm counterpart, which is compact compared to the arcsec VLA beam. As with GN20, the optical counterpart is a B–band dropout, which suggests a redshift range consistent with the observed radio–to–submillimeter and 24–to–submillimeter ratios (Younger et al., 2007).
The visibility function for AzTEC1 and J1008+063 derived from the VEX track are shown in Figure 4. Some decorrelation on longer baselines – likely the result of residual baseline errors in combination with atmospheric effects – results in artificial structure in the visibility function of J1008+063. A gaussian fit to this visibility data yields a source size of arcsec, which describes the effective seeing size for the track, and thus the minimum source size which is meaningfully probed by these observations. The visibility function for AzTEC1 shows some marginal evidence of being resolved on scales significantly larger than this lower limit: a Gaussian fit to this visibility data yields a total flux of mJy – consistent with the COM, EXT, and COM+EXT fits – with a size of arcsec. Fixing the total flux to the value derived from the COM+EXT data marginally improves this size measurement to arcsec. While the statistical uncertainty in the position measurement for AzTEC1 also improves to arcsec in both and , because we calibrate using J1008+063 to remove baseline errors it is exactly at the phase center and therefore does not provide an estimate of the systematic positional uncertainty. Therefore, we quote the position and flux derived from the COM+EXT tracks in Table 2.


4. Discussion
The robust result of these observations is that the far–IR emission in both GN20 and AzTEC1 is small considering the very high luminosity of these systems, but is clearly extended on kpc scales. This is suggestive of mergers as the physical mechanism driving the bolometric luminosity of these systems (Mihos & Hernquist, 1994; Hopkins et al., 2006). However in general, and in particular for the case of AzTEC1, this does not require that the far–IR luminosity is contributed only by the starburst. Indeed, a significant fraction of the far–IR could arise from a dusty torus associated with an active nucleus, which is generated on significantly smaller scales (e.g., Urry & Padovani, 1995). Ideally one would like significantly improved resolution continuum imaging and resolved gas kinematics via molecular spectroscopy to constrain the structure of these sources and dynamical state of the star–forming gas in detail – measurements which are beyond the capabilities of current facilities (e.g., SMA, CARMA, PdBI) but in the near term future will likely be accomplished with relative ease by ALMA. Nevertheless, if we assume that GN20 and AzTEC1 are starburst dominated – as the typical SMG is thought to be (Alexander et al., 2005, 2008) – and make a series of admittedly crude but arguably reasonable assumptions about their morphology and kinematics, we find a preliminary indication that they may be radiating close to or at the Eddington limit of their starburst.
It has been suggested that feedback from ongoing star formation sets a physical limit on the minimum size of a star forming region (Elmegreen, 1999; Murray et al., 2005; Thompson et al., 2005). Owing to the significant opacity of dust to the ultraviolet light produced by young stars, radiation pressure from high luminosity star formation regions can produce strong momentum–driven winds (e.g., Netzer & Elitzur, 1993; Elitzur & Ivezić, 2001). These winds are confined by the gravitational potential, which for an isothermal sphere scales as – where is the gas fraction, is the stellar velocity dispersion, and is the diameter of the starburst region. In the optically thin limit – which is appropriate for optically thick clouds with a small volume filling factor embedded in the diffuse interstellar medium – and assuming a Salpeter (1955) initial mass function (IMF222Using a Kroupa (2001) or Chabrier (2003) IMF will tend to lower SFRmax by (Kennicutt, 1998; Bell, 2003; Bell et al., 2005).), this leads to a maximum star formation rate (SFR) of:
| (1) |
where is the characteristic physical scale of the starburst – measured via either the Gaussian FWHM or disk diameter – in kpc, is the line–of–sight gas velocity dispersion in units of 400 km , and is the dust opacity in units of 100 cm2 g-1 (Murray et al., 2005) . As an upper limit on SFRmax, we adopt , but note that many dust models allow for orders of magnitude higher opacity, particularly for the ultraviolet radiation produced by young massive stars during a starburst (e.g., Li & Draine, 2001).


Our high resolution observations of AzTEC1 and GN20, which provide a measurement of both the far–IR luminosity and physical scale of the starburst region in two of the most luminous systems known, offer an ideal test–bed for this hypothesis. Both targets are B–band dropouts (see Figure 2 and § 3), which indicates that they likely lie within a relatively narrow redshift range (see e.g., Steidel et al., 1999; Giavalisco et al., 2004b). While these colors are possibly consistent with a very dusty source, the lack of a bright MIPS 24 counterpart – arising from redshifted m PAH emission – and their observed radio–to–submillimeter flux density ratios – assuming a far–IR SED similar to Arp 220 – are consistent with this higher redshift interpretation (Younger et al., 2007). Furthermore template fitting to both the optical and far–IR SEDs of AzTEC1 independently yield a consistent result of (Yun et al., in preparation). For this range, the angular diameter distance is roughly constant with redshift, so observed angular sizes correspond to physical scales of kpc. We can also roughly estimate their total far–IR luminosity by assuming an Arp 220 template333The inferred luminosity is known to be uncertain by a factor of due to variations in the dust temperature and emissivity (e.g., Blain et al., 2003). For example, if we assume a Mrk 231 template with significant AGN contribution to the far–IR, the inferred far–IR luminosity and SFR will be lower (e.g., Stevens et al., 2005; Huang et al., 2007)., which for gives (see also Neri et al., 2003) and – assuming a Salpeter (1955) initial mass function (IMF) – a star formation rate of , owing to the strong negative –correction in the submillimeter at high–redshift (Blain & Longair, 1993; Blain et al., 2002).
CO spectroscopy offers the best route to a measurement of the dynamical state of the star forming gas, including . Unfortunately, optical redshifts of the requisite precision are not available for these sources. Similar observations of other SMGs found typical velocity dispersions of for somewhat lower luminosity systems (median mJy, or ; Neri et al., 2003; Greve et al., 2005; Tacconi et al., 2006, 2008). This is consistent with the observed connection between SMGs and present day 3–4 early–type galaxies, in combination with the starburst mass fractions in the remnants of gas–rich mergers expected from simulations and observed in local systems (Hopkins et al., 2008). In what follows, we use these observational constraints and adopt with the awareness that this parameter is somewhat uncertain for the more extreme systems we are studying.
GN20 has a very high far–IR luminosity, with and yr-1 on characteristic a physical scale of and kpc for a Gaussian and elliptical disk model respectively. Adopting , the corresponding Eddington limits for each source model are and yr-1. This very luminous SMG is close to or at the Eddington limit for a starburst on those scales. It is also interesting to note that this size scale is somewhat extended compared to a simple – for a disk geometry – or – for a spherical geometry – scaling of the starburst size of local ULIRGs (e.g., Downes & Solomon, 1998; Iono et al., 2007, see also Iono et al. 2008, in preparation).
AzTEC1 has a far–IR luminosity444This differs from the luminosity implied by Fig. 3 of Younger et al. (2007) because it is derived from the far–IR directly, not from the near–infrared. of and yr-1 on a characteristic physical scales of and kpc for a Gaussian and elliptical disk model respectively. Adopting , this is significantly larger than the Eddington limit for a starburst on this scale, with and yr-1. Increasing the dust opacity only aggravates the situation. However, some SMGs have been observed with , which could explain the discrepancy. However, under the assumption that the far–IR luminosity is dominated by a starburst component, even at high velocity dispersion AzTEC1 is close to its Eddington limit.
| Name | |||
|---|---|---|---|
| [mJy] | [mJy] | [arcsec] | |
| GN20d | |||
| AzTEC1e |
If the volume filling factor of dense molecular gas is close to unity, and therefore the star forming gas is optically thick, then – again assuming a Salpeter (1955) IMF – the Eddington limit (Murray et al., 2005) on the star formation rate is
| (2) |
where is the gas mass fraction in units of 0.5. This is an order of magnitude higher than the SFR of GN20 and AzTEC1. However, in the optically thick limit, the dust temperature and brightness temperature – defined as , where is the surface brightness and is the Planck function – are equivalent. The implied angular diameter of both GN20 and AzTEC1 for a given brightness temperature at cosmological redshift () is shown in Figure 5. For GN20, characteristic angular scale inferred from a Gaussian and disk model yield and K respectively, which at suggests or . For AzTEC1, these models yield and K, which at gives and K. These are all somewhat lower than would be expected from the temperature–luminosity relation at low (Dunne et al., 2000; Klaas et al., 2001; Yang & Phillips, 2007), intermediate (Yang et al., 2007), and high redshift (Blain et al., 2003; Chapman et al., 2005; Kovács et al., 2006). However, the brightness temperature represents a lower limit, as the inferred dust temperature will increase as the opacity decreases – i.e., – or if the volume filling factor of optically thick clouds is less than unity. There is evidence that in the cores of local ULIRGs for (Solomon et al., 1997), and that the volume filling factor of dense molecular gas is (Downes et al., 1993). By analogy, it is plausible that GN20 and AzTEC1 are intermediate between the optically thick and optically thin regimes. Future observations at shorter wavelengths – e.g., at 350 with SHARC–II (Dowell et al., 2003) – could constrain independently, and thus help determine the appropriate limit.
Furthermore, our coverage does not exclude a multi–component structure for either GN20 or AzTEC1, in particular one with two compact point sources. The results of a fit to the calibrated visibilities for this model are summarized in Table 3. These angular offsets correspond to a physical separation of 4 and 2 kpc for GN20 and AzTEC1 respectively, which are consistent with dual nuclear starbursts in a late stage merger (e.g. Mihos & Hernquist, 1994; Hopkins et al., 2006). Should higher resolution data from either the SMA or ALMA confirm this interpretation, it is possible that each of these components is at or close to its Eddington limit with .
5. Conclusion
We present high resolution interferometric submillimeter imaging of two of the brightest – and therefore likely most luminous (Blain & Longair, 1993) – high redshift starburst galaxies known – GN20 and AzTEC1. The visibility functions for these sources indicate characteristic angular sizes of and arcsec respectively. Both are B–band dropout optical sources, which indicates a redshift of , and thus these angular size measurement correspond to physical scales of and kpc. Assuming a simple morphology and a dynamical state typical of high–redshift SMGs, we find preliminary evidence that GN20 and AzTEC1 are both close to the limiting luminosity derived via Eddington arguments. If these two sources are indicative of a large population of hyperluminous starbursts at high redshift, this may have important consequences for models of star formation and feedback in extreme environments.
References
- Alexander et al. (2005) Alexander, D. M. et al. 2005, ApJ, 632, 736
- Alexander et al. (2008) —. 2008, AJ, in press [astro-ph/0803.0634], 803
- Altenhoff et al. (1994) Altenhoff, W. J., Johnston, K. J., Stumpff, P., & Webster, W. J. 1994, A&A, 287, 641
- Barger et al. (1998) Barger, A. J. et al. 1998, Nature, 394, 248
- Barrera-Pineda et al. (2005) Barrera-Pineda, P. S., Lovell, A. J., Schloerb, F. P., & Carrasco, L. 2005, in Revista Mexicana de Astronomia y Astrofisica Conference Series, Vol. 24, Revista Mexicana de Astronomia y Astrofisica Conference Series, ed. A. M. Hidalgo-Gámez, J. J. González, J. M. Rodríguez Espinosa, & S. Torres-Peimbert, 188–191
- Beasley et al. (2002) Beasley, A. J., Gordon, D., Peck, A. B., Petrov, L., MacMillan, D. S., Fomalont, E. B., & Ma, C. 2002, ApJS, 141, 13
- Bell (2003) Bell, E. F. 2003, ApJ, 586, 794
- Bell et al. (2005) Bell, E. F. et al. 2005, ApJ, 625, 23
- Bertoldi et al. (2007) Bertoldi, F. et al. 2007, ApJS, 172, 132
- Biggs & Ivison (2006) Biggs, A. D. & Ivison, R. J. 2006, MNRAS, 371, 963
- Biggs & Ivison (2008) —. 2008, MNRAS, in press [astro-ph/0712.3047]
- Blain et al. (2003) Blain, A. W., Barnard, V. E., & Chapman, S. C. 2003, MNRAS, 338, 733
- Blain et al. (2004) Blain, A. W., Chapman, S. C., Smail, I., & Ivison, R. 2004, ApJ, 611, 725
- Blain & Longair (1993) Blain, A. W. & Longair, M. S. 1993, MNRAS, 264, 509
- Blain et al. (1999) Blain, A. W., Smail, I., Ivison, R. J., & Kneib, J.-P. 1999, MNRAS, 302, 632
- Blain et al. (2002) Blain, A. W., Smail, I., Ivison, R. J., Kneib, J.-P., & Frayer, D. T. 2002, Phys. Rep., 369, 111
- Browne et al. (1998) Browne, I. W. A., Wilkinson, P. N., Patnaik, A. R., & Wrobel, J. M. 1998, MNRAS, 293, 257
- Carilli & Yun (1999) Carilli, C. L. & Yun, M. S. 1999, ApJ, 513, L13
- Chabrier (2003) Chabrier, G. 2003, PASP, 115, 763
- Chapman et al. (2005) Chapman, S. C., Blain, A. W., Smail, I., & Ivison, R. J. 2005, ApJ, 622, 772
- Chapman et al. (2004) Chapman, S. C., Smail, I., Windhorst, R., Muxlow, T., & Ivison, R. J. 2004, ApJ, 611, 732
- Chapman et al. (2003) Chapman, S. C., Windhorst, R., Odewahn, S., Yan, H., & Conselice, C. 2003, ApJ, 599, 92
- Condon (1992) Condon, J. J. 1992, ARA&A, 30, 575
- Coppin et al. (2006) Coppin, K. et al. 2006, MNRAS, 372, 1621
- Dannerbauer et al. (2008) Dannerbauer, H., Walter, F., & Morrison, G. 2008, ApJ, 673, L127
- Dickinson et al. (2003) Dickinson, M., Giavalisco, M., & The Goods Team. 2003, in The Mass of Galaxies at Low and High Redshift, ed. R. Bender & A. Renzini, 324
- Dowell et al. (2003) Dowell, C. D. et al. 2003, in Presented at the Society of Photo-Optical Instrumentation Engineers (SPIE) Conference, Vol. 4855, Millimeter and Submillimeter Detectors for Astronomy. Edited by Phillips, Thomas G.; Zmuidzinas, Jonas. Proceedings of the SPIE, Volume 4855, pp. 73-87 (2003)., ed. T. G. Phillips & J. Zmuidzinas, 73–87
- Downes & Solomon (1998) Downes, D. & Solomon, P. M. 1998, ApJ, 507, 615
- Downes et al. (1993) Downes, D., Solomon, P. M., & Radford, S. J. E. 1993, ApJ, 414, L13
- Dunne et al. (2000) Dunne, L. et al. 2000, MNRAS, 315, 115
- Elitzur & Ivezić (2001) Elitzur, M. & Ivezić, Ž. 2001, MNRAS, 327, 403
- Elmegreen (1999) Elmegreen, B. G. 1999, ApJ, 517, 103
- Frayer et al. (1998) Frayer, D. T. et al. 1998, ApJ, 506, L7
- Frayer et al. (1999) —. 1999, ApJ, 514, L13
- Giavalisco et al. (2004a) Giavalisco, M. et al. 2004a, ApJ, 600, L93
- Giavalisco et al. (2004b) —. 2004b, ApJ, 600, L103
- Greve et al. (2004) Greve, T. R. et al. 2004, MNRAS, 354, 779
- Greve et al. (2005) —. 2005, MNRAS, 359, 1165
- Hippelein et al. (2003) Hippelein, H. et al. 2003, A&A, 407, 137
- Ho et al. (2004) Ho, P. T. P., Moran, J. M., & Lo, K. Y. 2004, ApJ, 616, L1
- Holland et al. (1999) Holland, W. S. et al. 1999, MNRAS, 303, 659
- Hopkins et al. (2008) Hopkins, P. F., Hernquist, L., Cox, T. J., Dutta, S. N., & Rothberg, B. 2008, ApJ, submitted [astro-ph/0802.0508]
- Hopkins et al. (2006) Hopkins, P. F. et al. 2006, ApJS, 163, 1
- Huang et al. (2007) Huang, J. . et al. 2007, ApJ, 660, L69
- Hughes et al. (1998) Hughes, D. H. et al. 1998, Nature, 394, 241
- Iono et al. (2006) Iono, D. et al. 2006, ApJ, 640, L1
- Iono et al. (2007) —. 2007, ApJ, 659, 283
- Ivison et al. (2002) Ivison, R. J. et al. 2002, MNRAS, 337, 1
- Ivison et al. (2007) —. 2007, MNRAS, 380, 199
- Kennicutt (1998) Kennicutt, Jr., R. C. 1998, ARA&A, 36, 189
- Klaas et al. (2001) Klaas, U. et al. 2001, A&A, 379, 823
- Koekemoer et al. (2007) Koekemoer, A. M. et al. 2007, ApJS, 172, 196
- Kovács et al. (2006) Kovács, A. et al. 2006, ApJ, 650, 592
- Kroupa (2001) Kroupa, P. 2001, MNRAS, 322, 231
- Le Floc’h et al. (2005) Le Floc’h, E. et al. 2005, ApJ, 632, 169
- Li & Draine (2001) Li, A. & Draine, B. T. 2001, ApJ, 554, 778
- Ma et al. (1998) Ma, C. et al. 1998, AJ, 116, 516
- Mihos & Hernquist (1994) Mihos, J. C. & Hernquist, L. 1994, ApJ, 431, L9
- Murphy (2006) Murphy, E. J. a. 2006, ApJ, 638, 157
- Murray et al. (2005) Murray, N., Quataert, E., & Thompson, T. A. 2005, ApJ, 618, 569
- Neri et al. (2003) Neri, R. et al. 2003, ApJ, 597, L113
- Netzer & Elitzur (1993) Netzer, N. & Elitzur, M. 1993, ApJ, 410, 701
- Patnaik et al. (1992) Patnaik, A. R., Browne, I. W. A., Wilkinson, P. N., & Wrobel, J. M. 1992, MNRAS, 254, 655
- Pope et al. (2006) Pope, A. et al. 2006, MNRAS, 370, 1185
- Redman et al. (1998) Redman, R. O., Feldman, P. A., & Matthews, H. E. 1998, AJ, 116, 1478
- Salpeter (1955) Salpeter, E. E. 1955, ApJ, 121, 161
- Sanders & Mirabel (1996) Sanders, D. B. & Mirabel, I. F. 1996, ARA&A, 34, 749
- Sanders et al. (2007) Sanders, D. B. et al. 2007, ApJS, 172, 86
- Schinnerer et al. (2007) Schinnerer, E. et al. 2007, ApJS, 172, 46
- Scott et al. (2008) Scott, K. S. et al. 2008, MNRAS, 385, 2225
- Scott et al. (2002) Scott, S. E. et al. 2002, MNRAS, 331, 817
- Scoville et al. (2007) Scoville, N. et al. 2007, ApJS, 172, 1
- Smail et al. (1997) Smail, I., Ivison, R. J., & Blain, A. W. 1997, ApJ, 490, L5
- Solomon et al. (1997) Solomon, P. M., Downes, D., Radford, S. J. E., & Barrett, J. W. 1997, ApJ, 478, 144
- Steidel et al. (1999) Steidel, C. C., Adelberger, K. L., Giavalisco, M., Dickinson, M., & Pettini, M. 1999, ApJ, 519, 1
- Stevens et al. (2005) Stevens, J. A. et al. 2005, MNRAS, 360, 610
- Tabatabaei et al. (2007) Tabatabaei, F. S. et al. 2007, A&A, 466, 509
- Tacconi et al. (2006) Tacconi, L. J. et al. 2006, ApJ, 640, 228
- Tacconi et al. (2008) —. 2008, ApJ, 680, 246
- Taniguchi et al. (2007) Taniguchi, Y. et al. 2007, ApJS, 172, 9
- Thompson et al. (2005) Thompson, T. A., Quataert, E., & Murray, N. 2005, ApJ, 630, 167
- Urry & Padovani (1995) Urry, C. M. & Padovani, P. 1995, PASP, 107, 803
- Wang et al. (2007) Wang, W.-H. et al. 2007, ApJ, 670, L89
- Wilson et al. (2008) Wilson, G. W. et al. 2008, MNRAS, 386, 807
- Yang et al. (2007) Yang, M., Greve, T. R., Dowell, C. D., & Borys, C. 2007, ApJ, 660, 1198
- Yang & Phillips (2007) Yang, M. & Phillips, T. 2007, ApJ, 662, 284
- Younger et al. (2007) Younger, J. D. et al. 2007, ApJ, 671, 1531
- Younger et al. (2008) —. 2008, MNRAS, 387, 707
- Yun & Carilli (2002) Yun, M. S. & Carilli, C. L. 2002, ApJ, 568, 88