Photometric characterization of a well defined sample of isolated galaxies in the context of the AMIGA project
Abstract
We perform a detailed photometric analysis (bulge-disk-bar decomposition and Concentration-Asymmetry-Clumpiness - CAS parametrization) for a well defined sample of isolated galaxies, extracted from the Catalog of Isolated Galaxies (Karachentseva, 1973) and reevaluated morphologically in the context of the AMIGA project (Analysis of the interstellar Medium of Isolated GAlaxies). We focus on Sb-Sc morphological types, as they are the most representative population among the isolated spiral galaxies. Our analysis yields a large number of important galactic parameters and various correlation plots are used to seek relationships that might shed light on the processes involved in determining those parameters. Assuming that the bulge Sérsic index and/or Bulge/Total luminosity ratios are reasonable diagnostics for pseudo- versus classical bulges, we conclude that the majority of late-type isolated disk galaxies likely host pseudobulges rather than classical bulges. Our parametrization of galactic bulges and disks suggests that the properties of the pseudobulges are strongly connected to those of the disks. This may indicate that pseudobulges are formed through internal processes within the disks (i.e. secular evolution) and that bars may play an important role in their formation. Although the sample under investigation covers a narrow morphological range, a clear separation between Sb and Sbc-Sc types is observed in various measures, e.g. the former are redder, brighter, have larger disks and larger bars, more luminous bulges, are more concentrated, more symmetric and clumpier than the latter. A comparison with samples of spiral galaxies (within the same morphological range) selected without isolation criteria reveals that the isolated galaxies tend to host larger bars, are more symmetric, less concentrated and less clumpy.
keywords:
galaxies: fundamental parameters; galaxies: photometry; galaxies: structure; galaxies: evolution; galaxies: general; galaxies: bulges1 Introduction
The properties of galaxies and their evolution are thought to be strongly related to their environment. The empirical quantification of environmental influence (“nurture”) on morphology, structure, nuclear activity, star formation properties, etc. requires a robust definition of a sample of galaxies that are minimally perturbed by other galaxies. Such a sample could serve as a “pure nature” baseline. In this sense, perhaps the best compilation of isolated galaxies available at this time is the Catalog of Isolated Galaxies (CIG; Karachentseva, 1973). Both the size (n=1050 galaxies) and the restrictive isolation criteria in the catalog contribute to its statistical value. The definition of isolation requires that, for a galaxy of diameter D, there is no companion/neighbor with a diameter d in the range D/4 to 4D within a distance of 20d. The isolation criteria used to construct the CIG suggest that a typical galaxy of 25 kpc diameter has not been visited by a similar mass perturber in the past 3Gyr (assuming a typical field velocity of 150 km s-1; Verdes-Montenegro et al., 2005). Thus, the evolution of such isolated galaxies is mostly driven by internal processes and to a much lesser degree by environment, at least for the last 3Gyr of their existence.
A recent morphological reevaluation of the CIG galaxies in the context of the AMIGA project (Analysis of the interstellar Medium of Isolated GAlaxies) revealed that the bulk ( 63%) show morphological types in the range Sb-Sc (Sulentic et al., 2006). In this study we present the results of a photometric characterization for a representative subsample of n 100 CIG galaxies classified as Sb-Sc in this latter reference. We perform multicomponent decomposition (bulge/disk/bar) using the BUDDA code111http://www.mpa-garching.mpg.de/ dimitri/budda.html (de Souza et al., 2004). Additionally, we evaluate CAS parameters Concentration(C)-Asymmetry(A)-Clumpinesss(S) (e.g. Conselice et al., 2000; Bershady et al., 2000; Conselice, 2003; Taylor-Mager et al., 2007). Assembling a set of parameters combining a model-dependent description of the main components of galaxies (BUDDA) with global structural measures (CAS) could provide valuable hints into the formation and evolution of galaxies.
This is the first attempt to date to present a detailed examination of this kind (bulge-disk-bar decomposition combined with CAS parameters) for a well defined sample of isolated galaxies. This study is an integral part of the AMIGA project, which is a dedicated multiwavelength study of the revised CIG catalog. The goal of AMIGA is to quantify the fundamental properties of a statistically meaningful sample of isolated galaxies which can then be used as a baseline for comparison and for estimation of the effects of environment in other less isolated samples of galaxies. The CIG catalog has recently been reevaluated in terms of galaxy positions (Leon & Verdes-Montenegro, 2003), isolation (Verley et al., 2007a, b) and morphology (Sulentic et al., 2006). A series of studies were produced in the context of the AMIGA project: 1) an optical characterization of the refined sample (Verdes-Montenegro et al., 2005), 2) an analysis of mid- and far-infrared properties (Lisenfeld et al., 2007), 3) a study of the neutral CO and HI gas (Espada et al., 2005; Espada, 2006), 4) radio continuum emission (Leon et al., 2008) and 5) nuclear activity (Sabater et al., 2008). Another recent study used a subsample of isolated AMIGA galaxies to investigate the role of bars in star formation processes (e.g. Verley et al., 2007c). Our present study offers a detailed photometric analysis of a representative sample of the core AMIGA population of Sb-Sc morphological types. We should note that all data produced within the AMIGA project are periodically updated and made publicly available at http://www.iaa.es/AMIGA.html.
Theoretical models and numerical simulations exploring the formation and evolution of galaxies rely on empirical results that could separate and quantify the relative roles of internal secular processes (that develop on time scales much longer than the galaxy formation/collapse process itself) and slow or fast external perturbations (environment) in defining the structural properties of galaxies. In this sense, our present study has a twofold importance: a) it explores a representative and well defined sample of the most isolated galaxies in the local Universe and b) provides an extensive photometric structural analysis of these galaxies. Our main goal is to identify potential scaling relations and correlations: i) between parameters describing the same structural component (bulge, disk or bar), ii) between components, iii) between components and global properties of the galaxy (morphological type, color, luminosity, concentration, asymmetry, clumpiness, etc.). With such correlations available one could explore for example the nature of bulges in isolated galaxies and how they are formed, the role of bars (if any) in the formation/evolution of bulges, whether the isolated spiral galaxies are different relative to spirals in richer environments in terms of global properties and/or in terms of properties of their components (bulge, bar, disks).
This paper is organized as follows: § 2 presents the selection and basic properties of the sample, § 3 offers a concise view on data reduction, § 4 and § 5 present the results of BUDDA decomposition analysis and CAS parametrization, respectively. § 6 combines various measures obtained from the BUDDA code with CAS parameters. § 7 is dedicated to discussion and conclusions. Throughout the paper we use Ho = 75 km s-1 Mpc-1.
2 The Sample
2.1 Sample Selection
Galaxies of morphological types Sb-Sc were found to be the most abundant (dominant) population in the AMIGA reanalysis of the CIG (Sulentic et al., 2006), Sb-Sc galaxies represent 2/3 (n637) of the 1018 galaxies with recession velocity VR 1000 km s-1. This motivated us to focus on the Sb-Sc morphological range since earlier and later types are so rare that they cannot be considered representative of an isolated sample. The sample adopted here was drawn from that Sb-Sc population (Sulentic et al., 2006) after applying the following constraints: (i) 1500 VR 10000 km s-1, (ii) blue corrected magnitudes (Verdes-Montenegro et al., 2005) mBcorr 15, (iii) inclination 70∘ and (iv) available images in SDSS (Data Release 6: DR6, Adelman-McCarthy et al. 2008). We ended up with a representative sample of n = 101 Sb-Sc galaxies all having SDSS (Sloan Digital Sky Survey) i-band magnitudes brighter than 15.0. The lower limit to the VR range avoids inclusion of local supercluster galaxies where the degree of isolation is most uncertain. The upper limit ensures a large enough SDSS overlap sample and at the same time adequate resolution to permit evaluation of basic structural parameters for all of the galaxies. We are preparing a complementary Fourier analysis of spiral structure in the same sample considered here. The need for a sufficiently accurate deprojection of galaxies in the context of the Fourier analysis requires the third constraint on inclination for the sample selection. The results of the Fourier analysis will be reported in a later paper.
SDSS images are obtained with a dedicated 2.5 m telescope (Gunn et al., 2006). The imaging process is carried out under photometric conditions (Hogg et al., 2001) in five filters (ugriz) (Fukugita et al., 1996; Smith et al., 2002) employing a wide-field CCD camera (Gunn et al., 1998). Data are processed by completely automated pipelines that detect and measure photometric properties of objects and astrometrically calibrate the data (Lupton et al., 2001; Pier et al., 2003).
Table 1 presents the sample of CIG galaxies that we analyze here in terms of coordinates (Leon & Verdes-Montenegro, 2003), recession velocity (Verdes-Montenegro et al., 2005), morphological type from Sulentic et al. (2006) and inclination, which was estimated using the formula , where and are the semimajor and semiminor axes of the disk, respectively. Morphological reevaluation of all CIG galaxies (Sulentic et al., 2006) was based on the second Palomar Observatory Sky Survey POSSII with some confirmation using SDSS-DR3. DR6 provides a much larger number of CIG galaxies with SDSS images. Therefore we decided to do a SDSS based morphological classification of our target sample of 101 galaxies in the framework presented in “The de Vaucouleurs Atlas of Galaxies” (Buta et al., 2007). The last column of Table 1 shows our revised and more complete (visual) classification. Four galaxies (CIG: 250, 291, 308 and 392) have been excluded from our sample because they are not in the range Sb-Sc according to our revised classification (see the last four lines of Table 1). Hereafter we consider the N=97 confirmed Sb-Sbc-Sc galaxies.
2.2 Basic Properties of the Sample
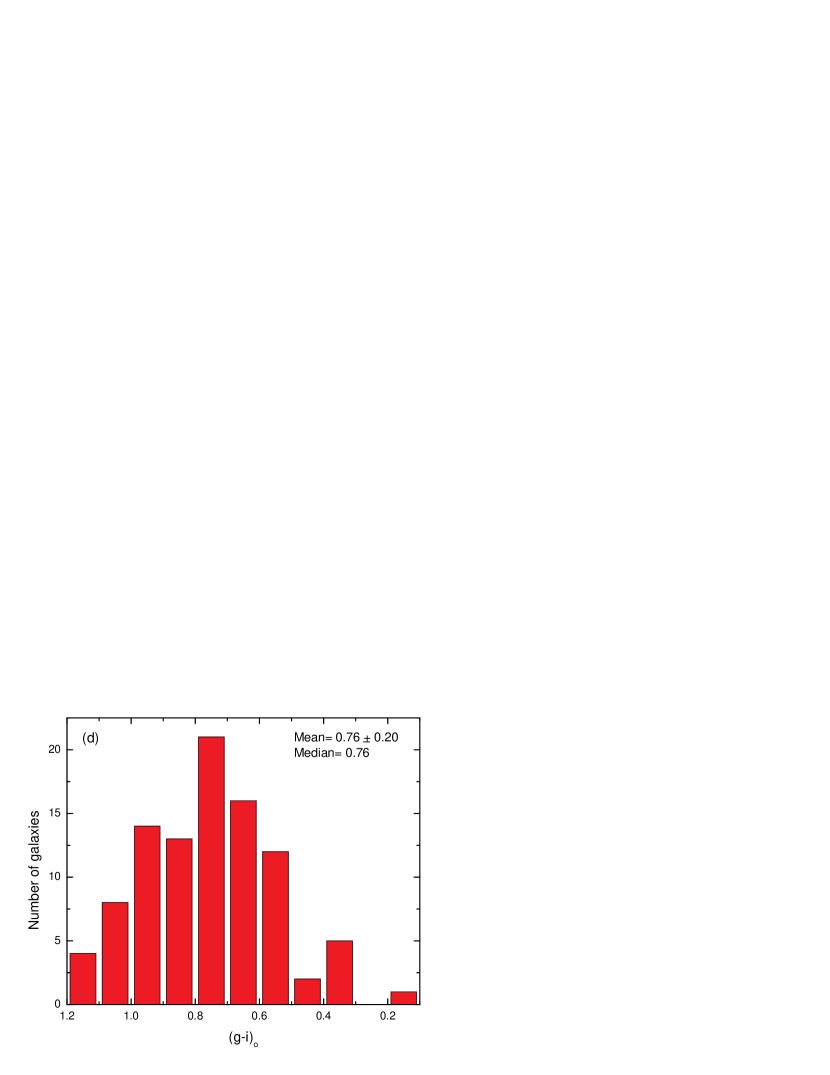
Figures 1a-d present some basic properties of our sample (the measures shown in panels a, c and d are based upon photometric estimates reported within the SDSS photo-pipeline): (a) distribution of galactic size, as indicated by a, i.e. the semimajor axis of the isophote where the disk surface brightness profile drops to 25th mag arcsec-2; (b) distribution of inclination; (c) distribution of i-band absolute magnitudes Mi and (d) distribution of (g-i)o color. The size a is calculated from the SDSS photometric parameter “isoA”. The computation of (g-i)o is based on g- and i-band “model” SDSS apparent magnitudes. The Mi is obtained from the SDSS i-band “cmodel” magnitude (for more information on various types of galaxy magnitudes reported within SDSS we direct the reader to: http://www.sdss.org/dr6/algorithms/photometry.html). We applied appropriate corrections to SDSS magnitudes and colors, i.e. Galactic and internal extinction, K-correction using YES222http://cadwww.hia.nrc.ca/yes (York Extinction Solver; McCall 2004) and a (1+z)4 factor due to redshift dimming. The color excess values E(B-V) required as input for YES come from NED333This research has made use of the NASA/IPAC Extragalactic Database (NED) which is operated by the Jet Propulsion Laboratory, California Institute of Technology, under contract with the National Aeronautics and Space Administration.(NASA Extragalactic Database) and are based on Schlegel et al. (1998).
Each panel of Figure 1 indicates the mean ( standard deviation) and the median for the distribution. The galaxies in our sample show semimajor axes covering a wide range between 4 and 28 kpc with the majority concentrated between 8-20 kpc (panel a). We visually examined galaxies in the first and last two bins of panel a (4-8 and 20-28kpc). At the large end we see galaxies with grand design spiral structure - luminosity class I (van den Bergh, 1960a, b; Sandage & Tammann, 1981). At the small end we find a majority with flocculent structure characteristic of luminosity classes IV-V. One exception involves CIG522 which shows surprisingly grand design structure given its small size. Inclinations in our sample span a range from 0∘ to 70∘ with the bulk of the sample between 20∘ and 60∘ (panel b). Our sample covers a range in i- band absolute magnitude from -19 to -23 (panel c), with an average absolute magnitude typical for an L∗-galaxy (e.g. Verdes-Montenegro et al., 2005). The faintest galaxies in our sample are similar in luminosity to the Large Magellanic Cloud (LMC). Galaxies in our sample show a wide spread in (g-i)o colors (0.1-1.2) with the bulk between 0.5 and 1 (panel d). Table 2 presents basic photometric measures based on SDSS photo-pipeline: (g-i)o colors, absolute global i-band magnitudes Mi and the a25 galactic semimajor axes both in i- and g-band. We checked our sample for biases driven by inclination effects and we found that SDSS photometric measures and BUDDA derived parameters seem to be insensitive to inclination. Because our sample covers a wide range in redshift, it is affected by Malmquist bias. Lowest redshift favors the lowest luminosity galaxies and highest redshift the most luminous objects.
We also marked on all the plots in the present paper (not shown in the paper) the galaxies classified in Sulentic et al. (2006) as I/A (interacting). The interaction code was either “y” (KIG 446, 712) or “?” (KIG 11, 33, 282, 328, 339, 366, 386, 466, 508, 640, 645, 743, 912, 943). A “y” indicates a morphologically distorted system and/or almost certain interacting system while “?” indicates evidence for interaction/asymmetry with/without certain detection of a companion. We find no trends for the galaxies flagged as I/A.
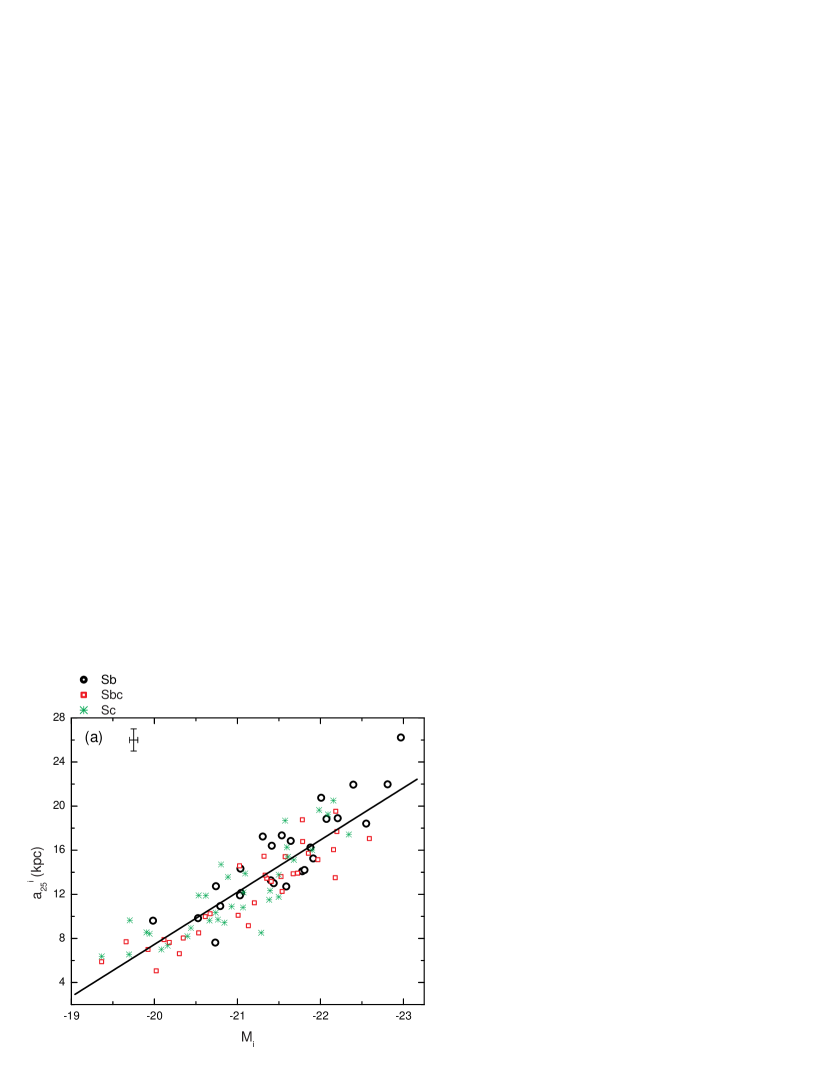
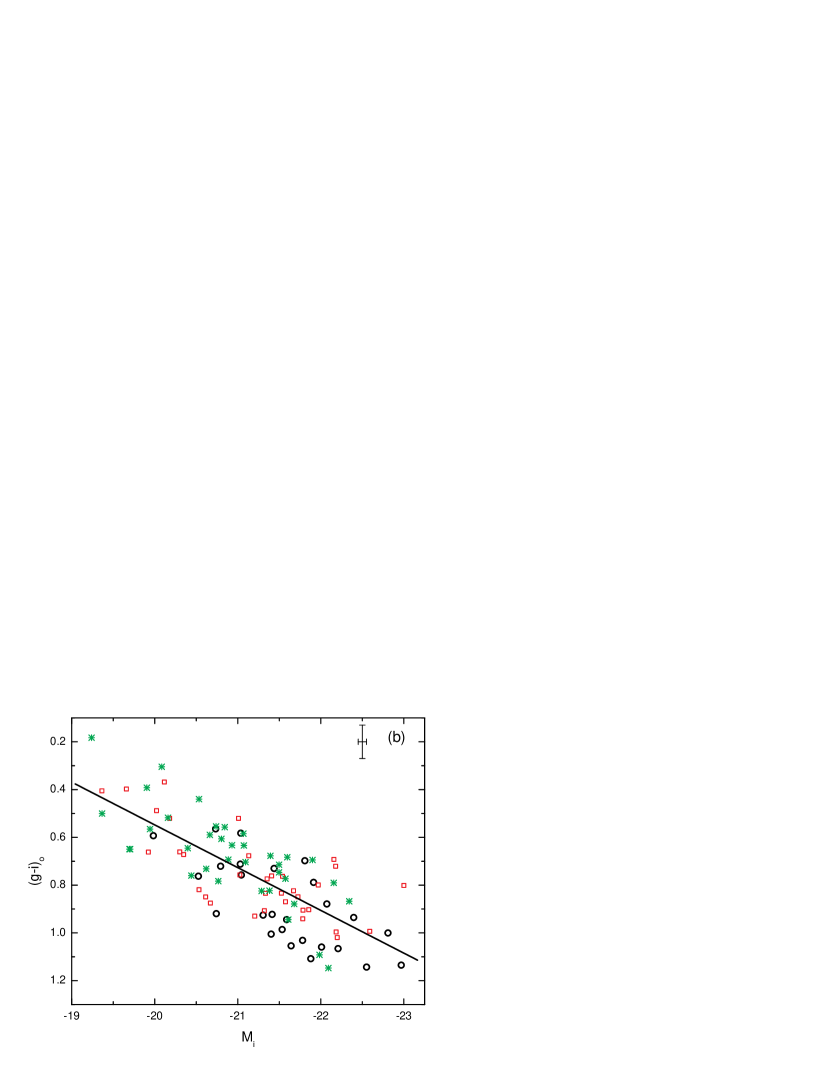
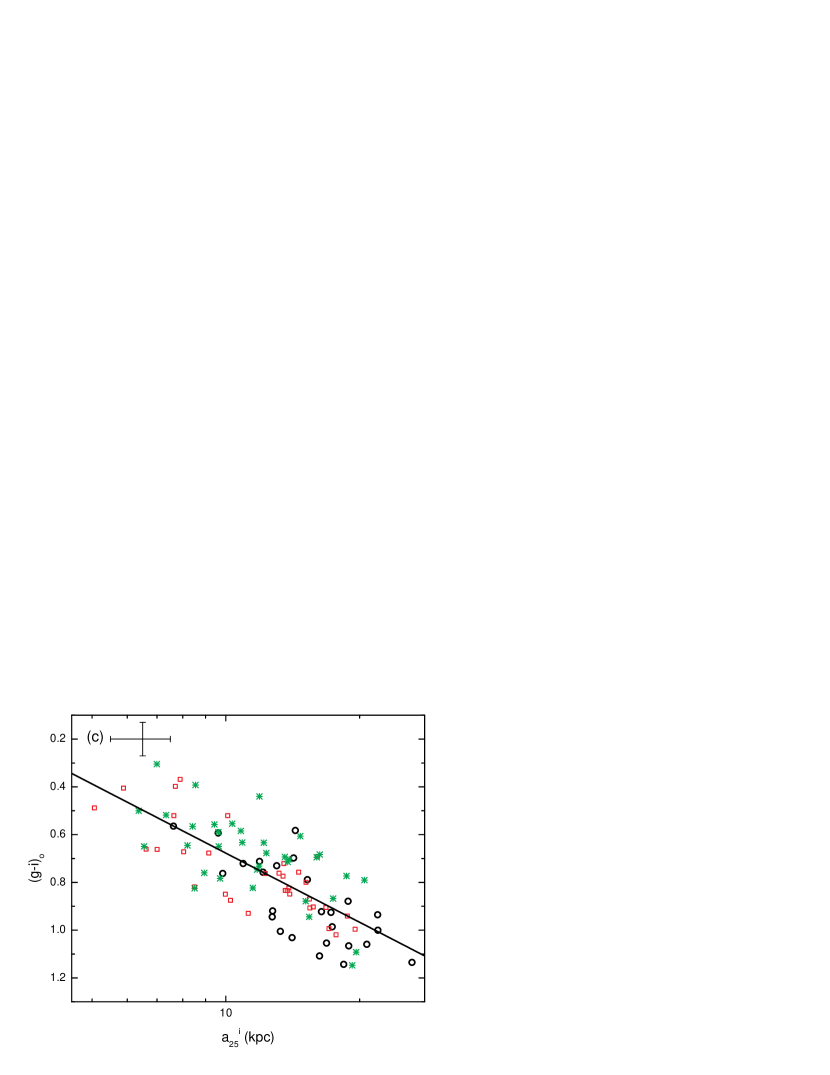
Table 3 presents average values (mean and median) for various interesting photometric measures, some of which having been employed in Figure 2. Figure 2a shows the correlation between disk size a and total i-band absolute magnitude Mi. The three morphological types (Sb-Sbc-Sc) are shown with different symbols. The solid line represents the best fit linear regression444All correlation coefficients we report in this paper refer to an ordinary least square linear regression of Y on X or OLS(Y—X), e.g. Isobe et al. (1990). The error bars of individual data points are not taken into account for linear regression fits. (correlation coefficient R=0.89). Galaxies classified Sb and Sc favor opposite ends of the correlation with means (15.5kpc; -21.5) and (12.2kpc; -20.9) respectively. A similar correlation is seen when g-band absolute magnitudes are used. Figure 2b is a color-magnitude diagram and indicates that the more luminous galaxies are also redder (e.g. Tully et al., 1982; Wyse, 1982; Gil de Paz et al., 2007), with linear regression correlation coefficient R=0.76. Figure 2c shows the relation between the galaxy color (g-i)o and disk size a (linear regression correlation coefficient R=0.75). We see that galaxies with larger disks tend to be redder than those with smaller disks. Correlations 2b and 2c appear to be largely driven by the location of Sb galaxies which tend to be larger, redder and more luminous than the other subclasses. Visual classification of Hubble subtypes, while rather subjective, appears to retain some utility for isolating galaxies according to first order physical properties. All of the trends involving size, luminosity and color are consistent with previous studies (e.g. Roberts & Haynes, 1994; Shimasaku et al., 2001). Table 3 suggests that i-band a25 disk measures are systematically larger than corresponding g-band measures. This effect is likely caused by the lower s/n of the g-band images because the i-band filter is more sensitive555http://www.sdss.org/dr6/instruments/imager/index.html.
The purpose of Figures 2a-c is twofold: to reveal correlations between basic properties and to identify outliers. The former correlations are expected to be better defined in a sample with minimal effects of nurture while, by the same reasoning, outliers are likely to indicate problematic data or remaining galaxies affected by interactions (that were not previously suspected as showing signs of interaction). The initial correlations based only on SDSS data revealed a small number of extreme outliers. We corrected all the measurements of the outlier galaxies (e.g. KIG: 397, 406, 502, 716, 928). It became clear that the automated photometric SDSS pipeline cannot deal properly with galaxies that are strongly contaminated by nearby bright stars. One galaxy (KIG 924) didn’t have any photometric measurements and two more galaxies (KIG 491, 712) didn’t have any isoA measurements in the SDSS pipeline. For a few other galaxies SDSS provided measures that fell away from the correlations well described by the rest of our sample. The SDSS magnitudes of the galaxies that fell on the correlations agree within 0.1-0.2 magnitudes with our new measurements. Two galaxies (KIG 502 and KIG 716) show an a too large for their absolute magnitudes. These two galaxies show peripheral structures that raise the possibility they were affected by an interaction or accretion event. We conclude that the natural sizes of the galaxies KIG 502 and KIG 716 are much smaller than suggested by a. They are excluded from Figures 1a, 2a and 2c. One galaxy (KIG 322) was excluded from the sample because the contamination of the nearby bright star makes it impossible to obtain reliable photometric measurements.
We derive the following best fit regressions for the panels of Figure 2: (a) ; (b) ; (c) .
2.3 The Choice of SDSS i-Band Images
The BUDDA-based decomposition and evaluation of CAS parameters reported in later sections are performed on SDSS i-band images. The choice of i-band was motivated by several considerations: 1) the internal extinction in i-band is significantly less than in a bluer filter, e.g. is 60% of that in g-band and 80% of that in r-band (based on the sample of galaxies discussed here using YES extinction solver), 2) the presence of star forming regions within spiral arms would be associated with H emission, which is almost exclusively contained within the r-filter for the range of VR we consider here and 3) the BUDDA code models the galaxy stellar background, including bars (best revealed by a redder filter) and does not fit the spiral structure (best traced by a bluer filter). The typical surface brightness zero-point for the i-band images we used is 26 mag arcsec-2.
3 Data Reduction
We used the i-band frames that are flat-field, bias, cosmic-ray, and pixel-defect corrected within the SDSS photometric pipeline (Stoughton et al., 2002). In a few cases more than one frame was needed in order to fully reconstruct the image of a galaxy. Frames were combined using IRAF666Image Reduction and Analysis Facility (IRAF) is distributed by the National Optical Astronomy Observatories, which are operated by the Association of Universities for Research in Astronomy, Inc., under cooperative agreement with the National Science Foundation - http://iraf.noao.edu/ task IMCOMBINE. We cleaned images removing contaminating stars using the IRAF task IMEDIT. The sky was fitted with a two-dimensional 2nd order polynomial and subtracted from the image using IRAF tasks IMSURFIT. Photometric calibration777http://www.sdss.org/dr6/algorithms/fluxcal.html was accomplished with aa, kk and airmass coefficients (zeropoint, extinction coefficient and airmass) from the SDSS TsField files. We computed the zeropoint for the surface brightness using , considering the exposure time exptime 53.907456 seconds and the pixel size 0396.
After performing these preliminary steps, we followed two different (but complementary) approaches toward describing quantitatively the galaxies structure and morphology:
1) BULGE/DISK/BAR/AGN Decomposition: We used BUDDA (de Souza et al., 2004) code version 2.1 to perform bulge/disk/bar/AGN decomposition. The program can fit simultaneously multiple components: a Sérsic bulge, two exponential disks, a Sérsic bar and a Moffat central source (Active Galactic Nucleus -AGN).
The Sérsic surface brightness profile (Sérsic, 1968) is described by:
where re is the effective radius (half-light radius), is the effective surface brightness (surface brightness at re), n is the Sérsic index - a parameter describing the shape of the profile and . A Sérsic model is most suitable to describe the shape of luminosity profiles in bulges of galaxies (Andredakis et al., 1995). A pure deVaucouleurs profile (de Vaucouleurs, 1948) is characterized by a Sérsic index of 4 and a pure exponential profile is described by a Sérsic index of 1. The Sérsic index nbulge ranges from about 1 for late type spiral galaxies (exponential profile, e.g. Andredakis & Sanders 1994; de Jong 1996) to about 6 for elliptical galaxies.
The exponential surface brightness profile of the disk (Freeman, 1970) is given by:
where is the central surface brightness of the disk and hR is the radial scalelength of the disk.
For a full description of the analytical functions used to fit each component see section §§ 3.1 of Gadotti (2008). IRAF task ELLIPSE was used to get an initial guess for position angle (PA) and ellipticity () for the bulge, disk and bar.
2) CAS Parametrization:
The concentration index appears to be an integral part of any morphological classification of galaxies (e.g. Bershady et al., 2000). The asymmetry and clumpiness indices are more sensitive to environmental (i.e. external) influences and are reasonable interaction diagnostics. Customarily, the three parameters are described quantitatively as follows:
Concentration , where r80% and r20% are the radii that include 80% and 20% of the total light respectively (c.f. Conselice, 2003).
Asymmetry , where I0 and I180 represent the pixel light intensity in the initial and the 180∘ rotated image. The letter “B” in this context refers to background and has a similar meaning. The summation is done over all pixels. The IRAF task IMCNTR identifies the center of the galaxy (maximum intensity). The image is rotated 180∘ about that center using the IRAF task ROTATE via linear interpolation. The standard procedure for computation of the asymmetry index involves also a minimization of A. (see section 3.3 in Conselice et al. 2000). This method is effective for irregular and edge-on galaxies where the centroid is most uncertain. We note that Sb-Sc galaxies in our sample have a range of inclinations that allow less ambiguous determination of their centers, i.e. the brightest central grid point, whose coordinates are real numbers. In our cases the uncertainty in identifying the center of the galaxy using IMCNTR task is less than 1% of a pixel. Therefore, we did not minimize the asymmetry index. Nonetheless, we imposed the condition that the center of the galaxy (initial estimate) does not shift upon rotation. We used IRAF task IMSHIFT to correct for any displacements that occurred.
Clumpiness ], where I0 and B0 have the same meaning as in definition of A. The subscript “” refers to the image that is smoothed with a boxcar of size , where is the inverted Petrosian radius. We note that all central pixels (within 1/20 of the defined total radius of the galaxy) are set to nil value. Our S-definition is adapted from Taylor-Mager et al. (2007). We should also add that CAS are calculated within the total radius of the galaxy, defined as 1.5 . , where in practice is the (mean) pixel-intensity at radius from the galactic center and is the average intensity within (see also Takamiya, 1999).
4 Galaxy Decomposition Using BUDDA
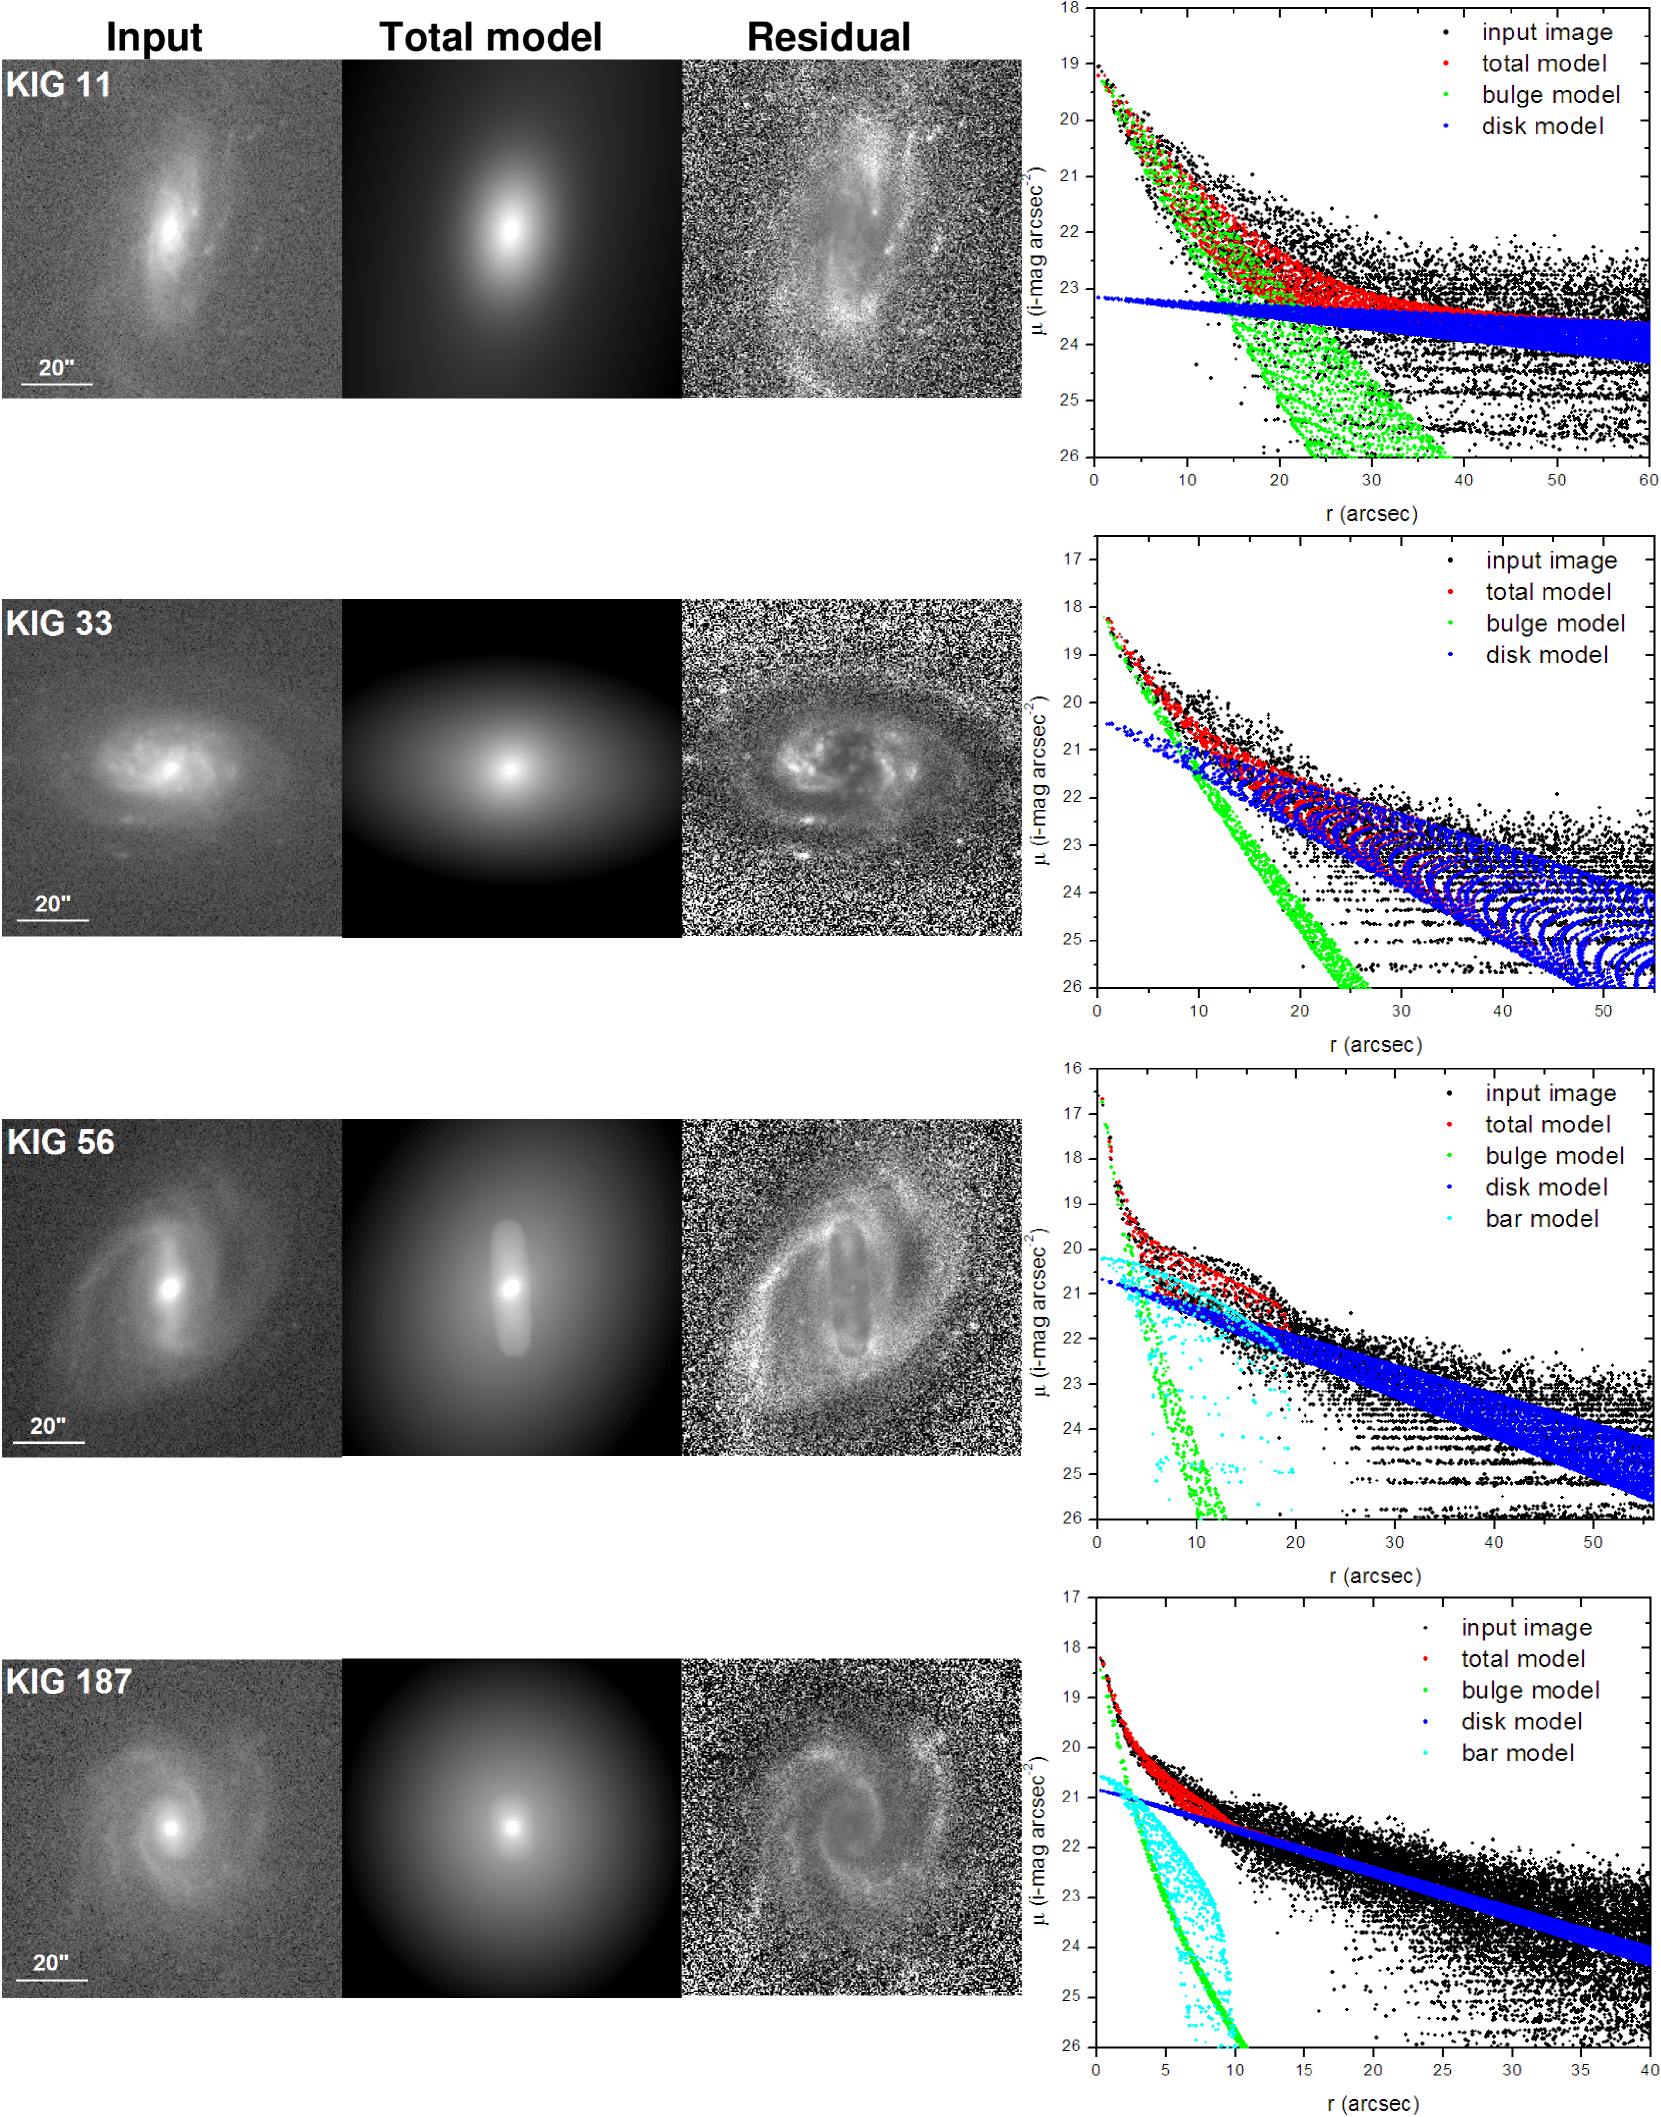
Figure 3 shows examples of the BUDDA-based decomposition for the first four galaxies listed in Table 1 (ordered by CIG/KIG name). The left panel displays, from left to right, the initial image, the fitted model and the enhanced residual image (initial image normalized by the model). The residual image shows high spatial frequency structure associated with the spiral arms and emission regions in each galaxy. The BUDDA code does not fit such high spatial frequency structure. The right panel of Figure 3 shows the surface brightness profile of the galaxy (black), fitted components (green=bulge, blue=disk and bar=turquoise) and total model (red; sum of all components). Data products for the entire sample are available at www.iaa.es/AMIGA.html. Table 4 provides a full set of parameters that describe the bulge-disk-bar components of the galaxies obtained using BUDDA888The surface brightness profiles shown in Figure 3 and the numbers reported in columns (7) and (10) of Table 4 do not include Galactic extinction, (1+z)4 redshift dimming or K- corrections. However, everywhere else hereafter the averages (mean/median) are calculated after such corrections were applied. Moreover, all plots involving surface brightness and include the corrected values.. We checked if our BUDDA parameters are affected by any biases and it turns out that the parameters derived by the code are insensitive to galaxy inclination and recession velocity. We conclude that the BUDDA code decomposition provides reasonable parametrization for all 94 galaxies. Two galaxies show clear shell structure (KIG 600 and KIG 754) suggesting that despite all of our efforts a few nurtured galaxies remain in the sample. The code was unable to model such complex structures, clearly overestimating the contribution of a bulge component (KIG 600) or not being able to isolate a bulge component at all (KIG 754). The sample consists of 25, 34 and 35 galaxies classified as Sb, Sbc and Sc, respectively according to our reclassification using the SDSS images. We included an AGN component for two galaxies (KIG: 671 and 719) because they are classified as Seyfert 1 in NED. All statistical analysis will be based upon results for the 94 galaxies suitable for BUDDA decomposition.
4.1 Properties of Bulges
Spiral galaxies show a wide range of bulge sizes and Bulge/Disk luminosity ratios. It has been suggested that “bulge building” via nurture processes (external acquisitions/accretion of companions) may be responsible for many or all large bulge systems (Carlberg, 1999). Alternatively, other studies propose that dissipative processes in disks (internal secular evolution) are responsible for building up bulges in most spirals (e.g. Hunt et al., 2004).
As expected, the fraction of CIG spirals with large bulges has decreased as classifications have evolved from the original low resolution POSS to higher resolution POSS2 images and finally SDSS. If small bulge spirals represent some kind of primordial unnurtured spiral population then AMIGA/CIG represents the best sample to study the population statistically. It is especially interesting to quantify their properties in order to see how much of the known morphological and structural diversity is likely due to pure nature rather than nurture.
In the past 15-20 years, the concept of exponential bulges has been systematically investigated and nowadays it is accepted that there exist two general types of bulges: classical and pseudobulges. A number of criteria (Kormendy & Kennicutt, 2004) have been proposed to identify pseudobulges based upon: 1) morphological analysis of high resolution Hubble images (they show flattened geometry, associated with nuclear spirals, rings or bars; e.g. Carollo 1999; Fisher & Drory 2008), 2) kinematics (they are described by low velocity dispersion, which makes them outliers relative to the Faber-Jackson relation; Faber & Jackson 1976), 3) photometric analysis of the surface brightness profile (they show nearly exponential profiles typical of disks) and 4) color (age) of bulge stellar population (they may be dominated by Population I material, without obvious signs of mergers). In what follows, we evaluate the nature of bulges in our isolated sample by exploiting the photometric decomposition of the light profiles and we adopt a few simple criteria involving nbulge and Bulge/Total luminosity ratio to distinguish between pseudo- from classical bulges.
It has been proposed that all galaxies with a bulge contribution (relative to the total galaxy luminosity) of 10% or less are pseudobulges, i.e. disk-like structures formed by secular evolution (e.g. Kormendy & Kennicutt, 2004; Laurikainen et al., 2007). About 68% of our sample shows Bulge/Total ratios B/T 0.1. Based on BUDDA parameters 45% of the Sb galaxies and 75-80% of the Sbc-Sc galaxies show B/T 0.1. A more extreme view (i.e. less restrictive) involves the proposal that all bulges characterized by nbulge 2.5 and B/T 0.45 are pseudobulges (e.g. Kormendy & Kennicutt, 2004; Drory & Fisher, 2007). These considerations raise the possibility that 94% of our sample contain pseudobulges. Applying similar criteria to the sample of n=95 Sb-Sc galaxies from Laurikainen et al. (2004a) (based on Ohio State University Bright Spiral Galaxy Survey; OSUBSGS - Eskridge et al. 2002) we found a similar fraction 92% pseudobulges. The latter sample was not selected using an isolation criterion, so a higher degree of nurtured galaxies might be expected. In this context we note that a smaller fraction (59% of the OSU sample) show B/T0.1.
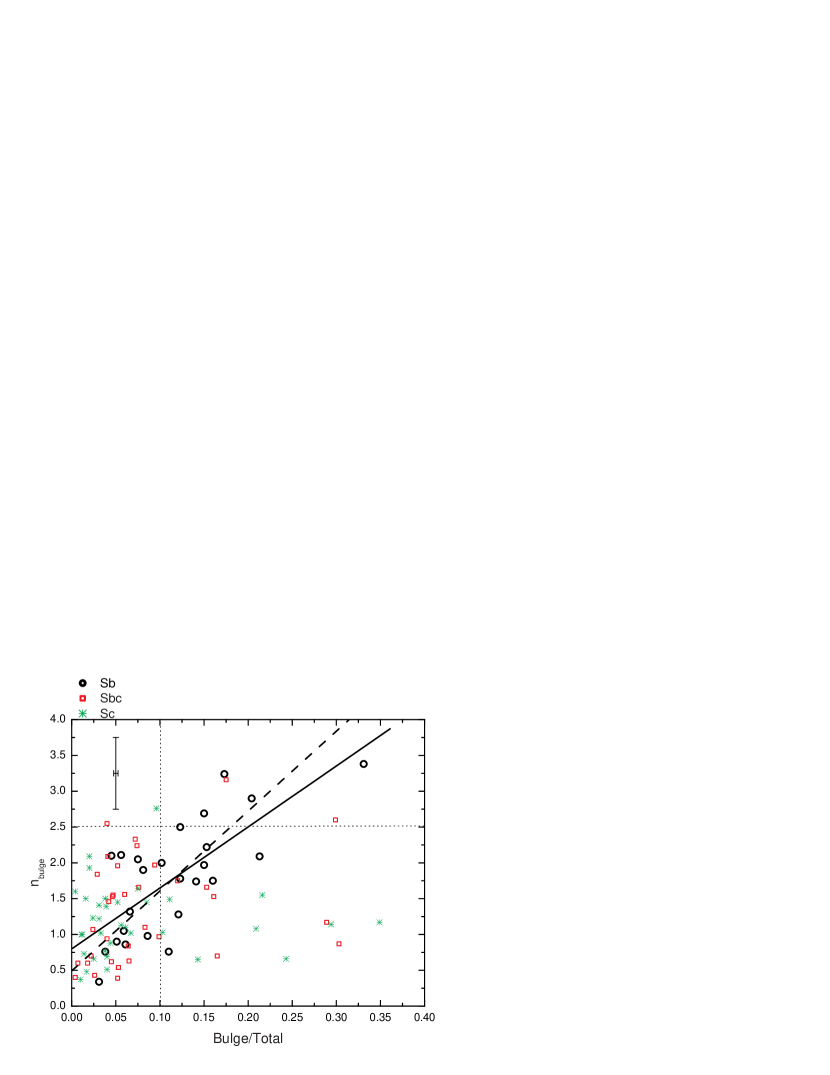
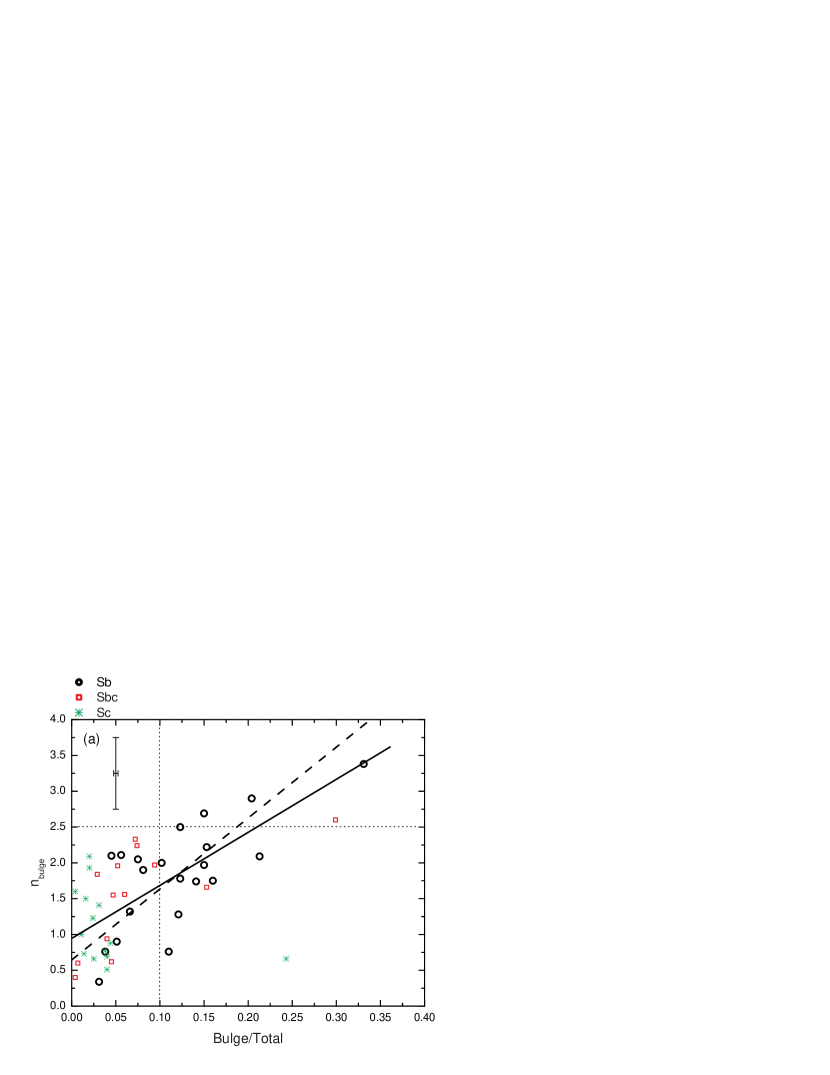
We note that the largest Bulge/Total ratio in our sample is B/T 0.35 and the largest nbulge value we find is close to 3.5. The typical uncertainty in nbulge is 0.5 (confirming the result of Gadotti 2008). Figure 4 shows the distribution of BUDDA-derived Sérsic bulge indices nbulge vs. the B/T ratio. The pseudo-/classical bulge proposed boundaries mentioned above are indicated by dotted lines. Figure 4 shows the strong concentration of much of our sample within the extreme pseudobulge domain. Although Bulge/Total is a rather robust empirical measure (Gadotti, 2008), it is a very challenging task to quantify its uncertainties, which are not provided by the BUDDA code. We attempted to calculate the uncertainty of Bulge/Total varying the input parameters (giving BUDDA a range of reasonable starting values). We estimate (2-3) uncertainties generally smaller than 15%.
In Figure 4 the three morphological types Sb, Sbc and Sc are indicated with distinct symbols (see figure’s legend). There are six galaxies (4 Sb and 2 Sbc) with nbulge 2.5 and Bulge/Total 0.1 that could be interpreted as classical bulges because they lie outside the extreme suggested pseudo-/classical bulge boundaries. Thirty galaxies lie outside of the more restrictive pseudobulge domain with Sb again showing the largest fraction. This would still leave 2/3 of our sample (and most Sbc-Sc) as pseudobulge systems. The subset of Sb galaxies show an apparent trend or linear correlation in Figure 4. Best fit regression line (solid) and bisector (dashed) are indicated for the Sb population. In either case, the correlation coefficient is R0.7. For the Sbc and Sc subsets we find no evidence for a correlation (correlation coefficients R 0.3-0.4 for Sbc types and 0.01-0.07 for Sc types). Clearly the scatter increases with lateness of type. As a check for hidden luminosity trends in Figure 4 we compared the location of the five least and most luminous galaxies (not shown here). Those points scatter everywhere on the plots suggesting no systematic effects on the distribution of measures.
Table 5 presents the average values (mean/median) of the structural parameters of bulges, disks and bars for the entire sample. The table is organized as follows: Column 1 - Morphological Type, Column 2 - Bulge/Total luminosity ratio, Column 3 - Sérsic index of the bulge nbulge, Column 4 - bulge effective radius re, Column 5 - effective surface brightness of the bulge , Column 6 - disk scalelength hR, Column 7 - central surface brightness of the disk . Table 5 shows a decreasing trend for mean and median Bulge/Total and Sérsic index nbulge measures from earlier to later types, with a larger gradient between Sb and Sbc than between Sbc and Sc. The Sérsic index nbulge appears to be more sensitive to differences in Hubble type. We also point out that the bulge effective radius re shows no trend among Hubble subtypes (Tables 5). Mean/median effective surface brightness increases from Sc to Sb by about 1.3 magnitudes/arcsec2.
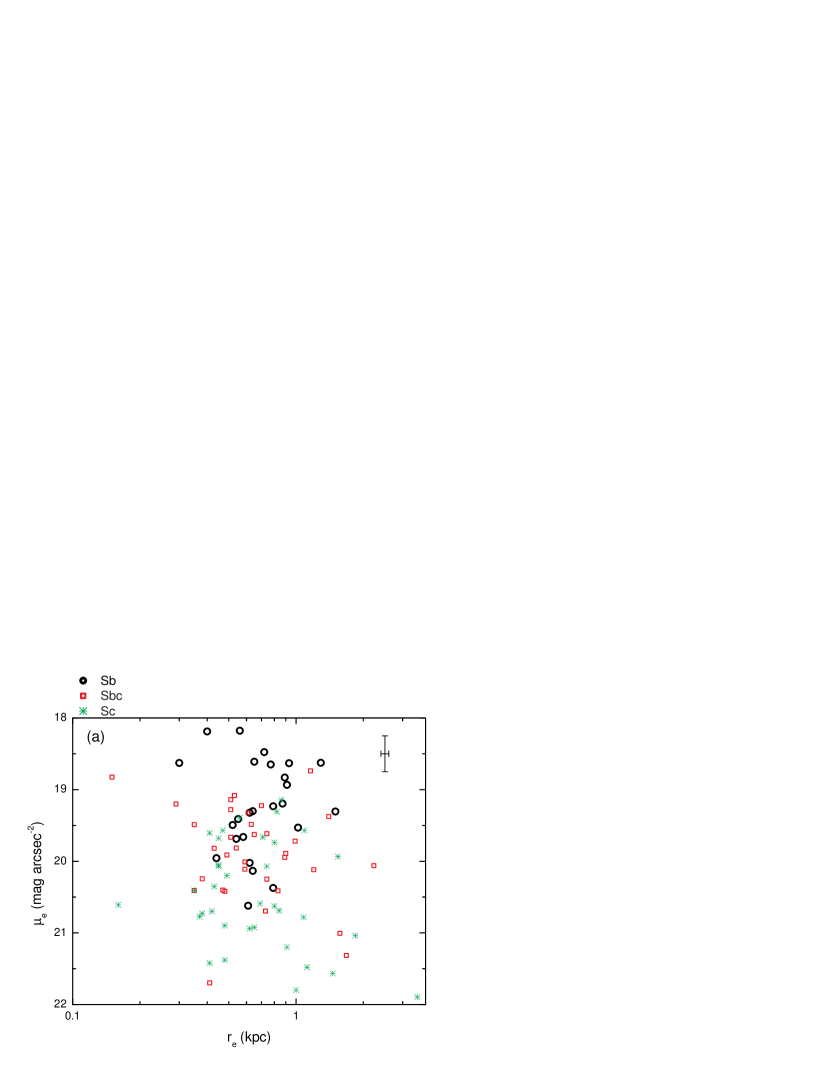
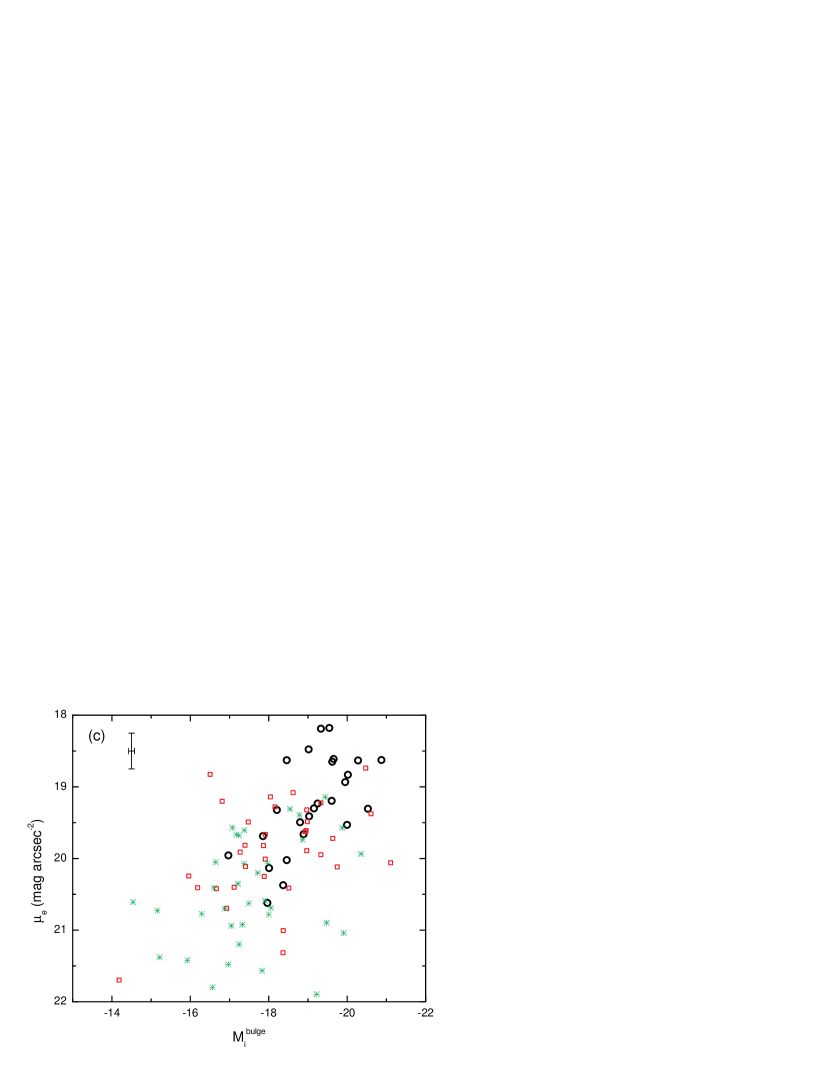
Figure 5a shows a 2D projection within the fundamental plane defined by (surface brightness at re) and re (Hamabe-Kormedy relation; Hamabe & Kormendy, 1987) for bulges in our sample - (log re, ) plane. The bulge effective surface brightness is corrected for Galactic extinction, (1+z)4 and K-corrected. There is no clear trend, as previously reported for late-type spiral bulges (Capaccioli et al., 1992; Carollo, 1999). We again see a separation between the earliest and latest types in our sample where Sb galaxies show the highest and Sc the lowest effective surface brightness (see also Table 5). The two outliers with lowest effective radii may be Sd galaxies. The segregation of morphological types is driven along the ordinate by lines of constant luminosity in the (log re, ) plane. Isolated Sb galaxies tend to be more luminous and have larger bulges compared to isolated Sc galaxies (see Tables 3 and 5). Galaxies with luminosities differing as much as 4 magnitudes share the same range in re. Bulges in our Sb - Sc sample do not grow larger than re2.5 kpc regardless of their luminosity. These results are consistent with those reported by Capaccioli et al. (1992) (see their Figure 4).
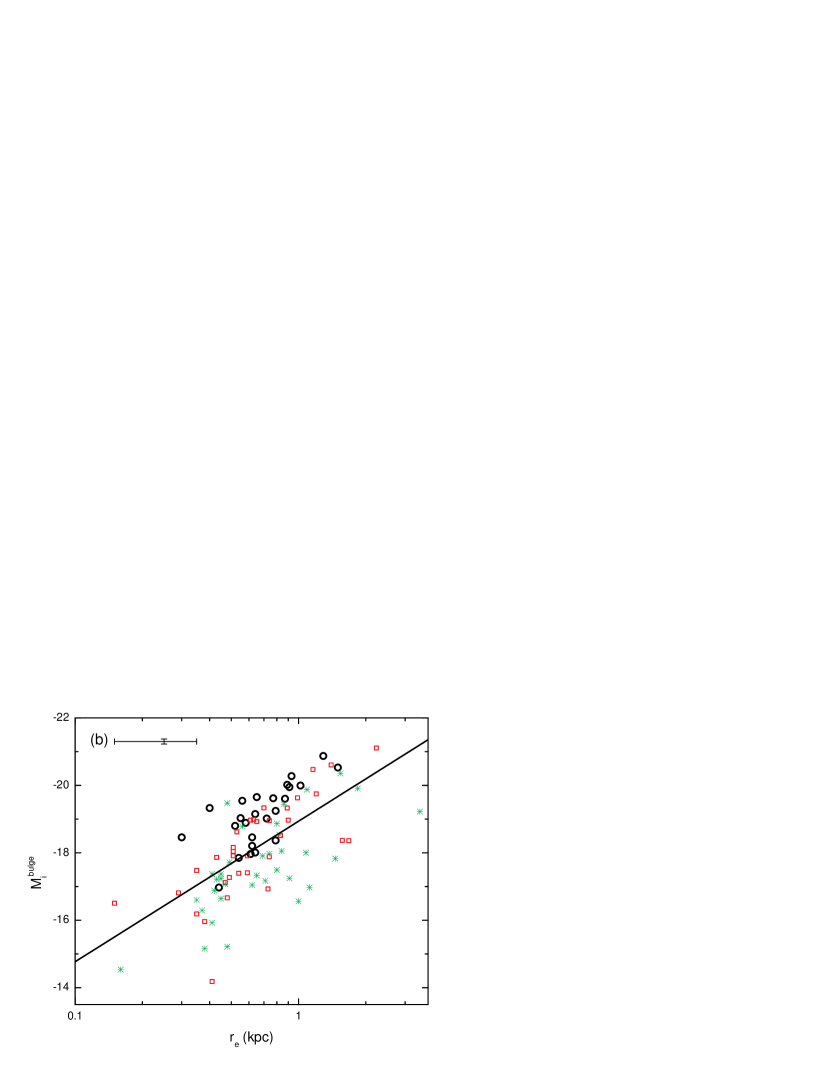
Figure 5b shows the distribution of the bulge effective radius as a function of bulge absolute magnitude in i-band, which can be regarded as a surrogate (log re, ) plane. The M is obtained from the SDSS cmodel i-band magnitude of the galaxy (§ 2) taking into account the Bulge/Total luminosity ratio from the BUDDA code. The more luminous bulges show larger effective radii, although the correlation between the two parameters shows large scatter, with a linear regression correlation coefficient R=0.65 (solid line). Actually we see three parallel sequences of galaxies that we classify as Sb, Sbc and Sc, respectively. The re ranges are similar but Sc galaxies are displaced between Mi= 1-2 magnitudes lower than Sb galaxies. Bulge effective radius is relatively insensitive to Hubble subtypes while bulge luminosity is useful in this context. This interpretation allows one to identify visually misclassified objects (or galaxies for which BUDDA derived bulge parameters are unreliable).
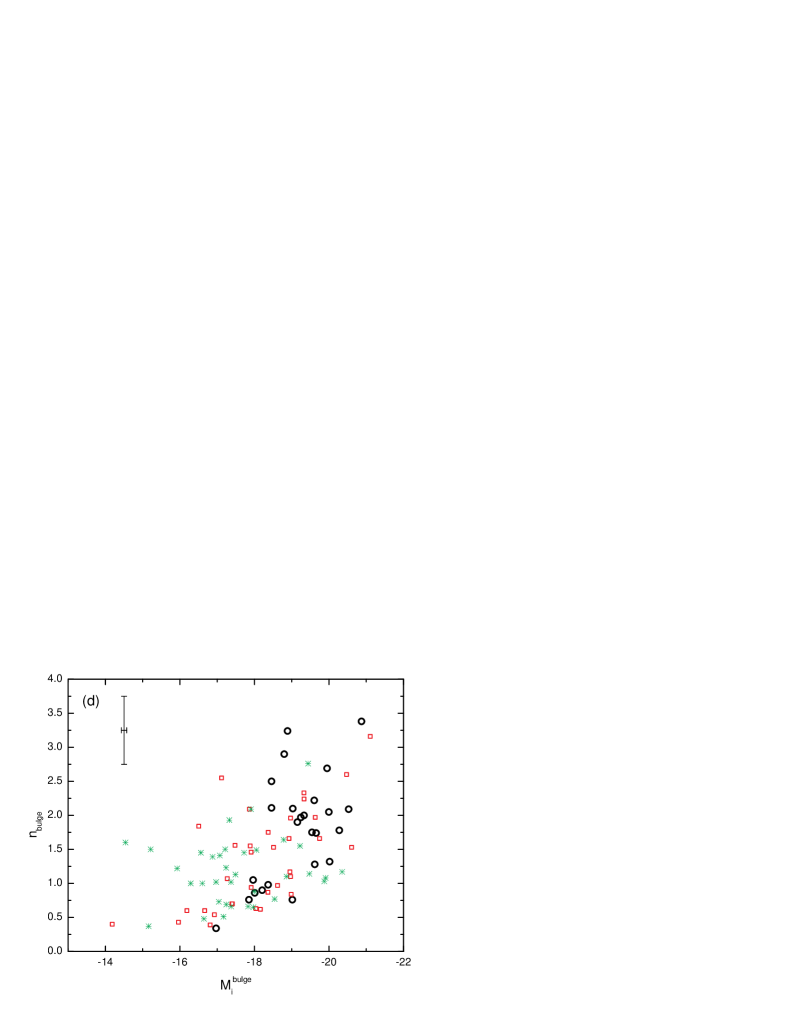
Figure 5c plots versus M. It suggests that brighter bulges are also characterized by higher effective surface brightness, yet again the scatter is quite large. Figure 5d displays the distribution of the bulge Sérsic indices as a function of M. Fainter bulges tend to have lower values for nbulge.
4.2 Properties of Bars
Visual inspection of SDSS i-band images suggests that 57% of our sample (55 out of 96) could be classified as SB or SAB, showing bars or ovals. This fraction is consistent with that reported in other studies (in near-IR or r-band) with no restriction on morphological type (Knapen, 1999; Eskridge et al., 2000; Menndez-Delmestre et al., 2007; Marinova & Jogee, 2007; Verley et al., 2007c; Barazza et al., 2008). The BUDDA code identified a bar component in 51% of the sample (48 out of 94). There is a slight discrepancy between our visual estimate and BUDDA results (55 versus 48 barred galaxies, respectively). Six out of seven galaxies for which BUDDA did not identify a bar component were visually classified as SAB, i.e. transitional or intermediate between barred SB and non-barred SA. The most intriguing case is KIG 689, which visually could be classified as SB, yet the code cannot separate bulge-bar components.
We find that 34 galaxies have a Bar/Total luminosity ratio smaller than 10%. The fraction of barred galaxies decreases from 84% (for Sb type) to 40-50% for each of the later types Sbc and Sc. The BUDDA code provides a parameter called “maximum radius of the bar”, which we tabulate as lbar and use as an estimate for the length of the bar (Gadotti, 2008). Figure 6 shows the distribution of lbar (semimajor axis of the bar). Barred galaxies show a wide range lbar= 1-12 kpc with a large concentration in the range 2-6 kpc.
Tables 6ab present average values (mean/median) for the most important structural parameters for bulge, bar and disk components as estimated by BUDDA. We present numbers for barred (6a) and non-barred (6b) galaxies separately and by morphological subtype. Tables 6ab are organized as follows: Column 1 - Morphological Type, Column 2 - Bulge/Total luminosity ratio, Column 3 - nbulge, Column 4 - bulge effective radius, Column 5 - effective surface brightness of the bulge, Column 6 - disk scalelength, Column 7 - central surface brightness of the disk, Column 8 - semimajor axis of the bar.
4.3 Properties of Disks
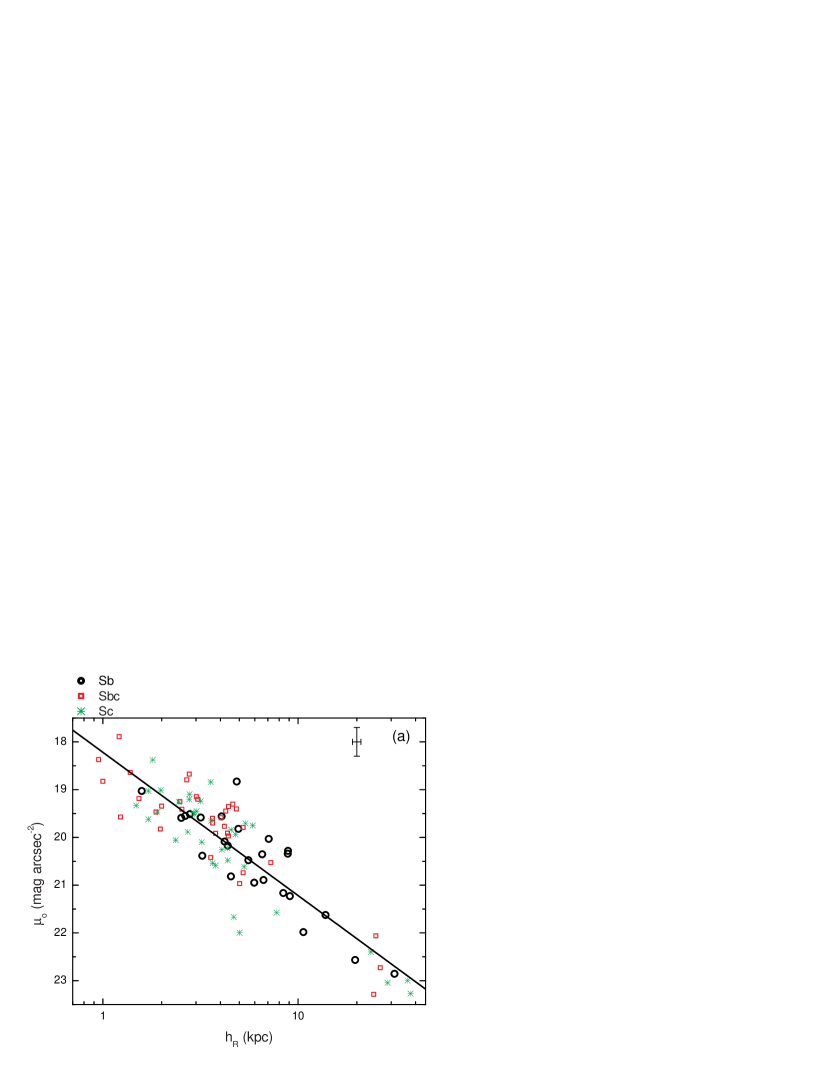
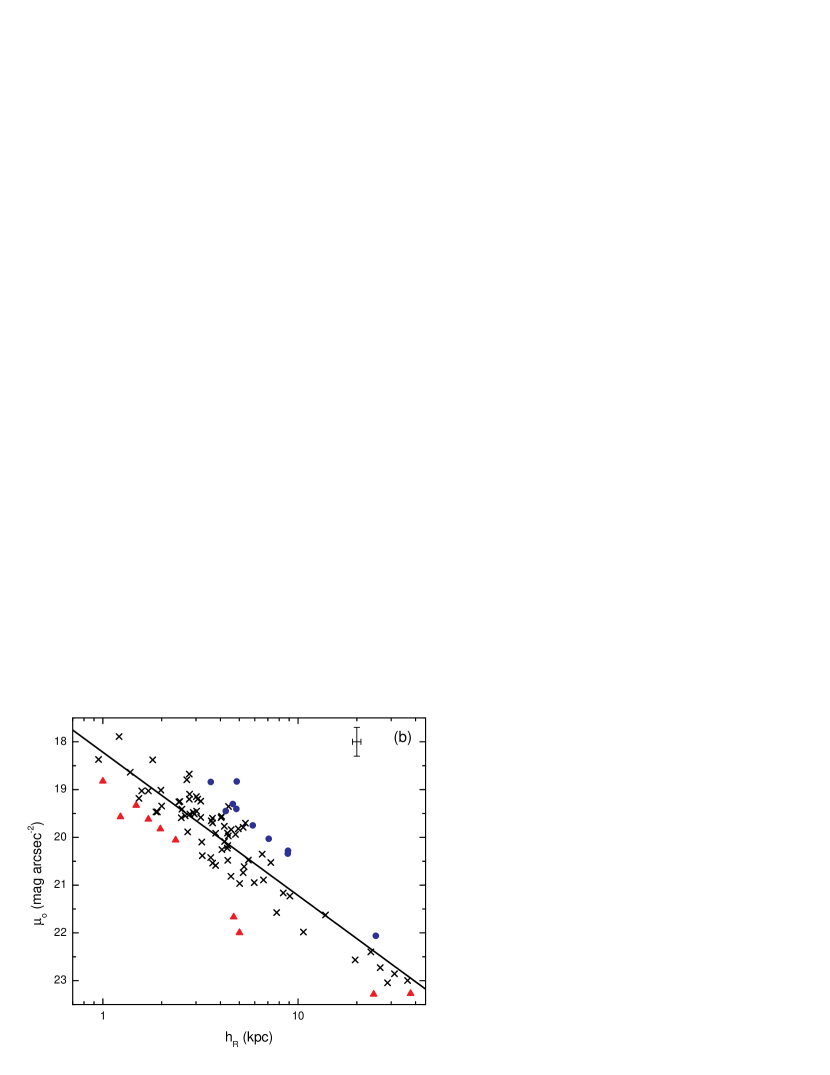
Figure 7 illustrates the relation between the two parameters describing the disk exponential profile: and hR. The surface brightness was corrected for Galactic extinction. We also applied a (1+z)4 and a K-correction. In Figure 7a the three morphological types are indicated with different symbols Sb-Sbc-Sc. In Figure 7b the ten most luminous and the ten least luminous galaxy disks in the sample are shown with solid circles and solid triangles, respectively. The ten most luminous disks have absolute magnitudes in the range -22.8 to -22 and the ten least luminous have absolute magnitudes in the range -19.9 to -19. The disk central surface brightness and disk scalelength hR are strongly correlated, with linear regression correlation coefficient R=0.88 (see also Grosbøl, 1985; Kent, 1985; Khosroshahi et al., 2000; Graham & de Blok, 2001; Mndez-Abreu et al., 2008). The slope of the linear regression fit is 3.00.2, well below a constant luminosity disk, which could be described by a slope of 5 (based on the approximation ). This scaling relation seems to hold for all spiral types and it is observed for low surface brightness galaxies as well (Beijersbergen et al., 1999). Other studies reported a slope in the range 1.5-3.0 (see Graham 2001a and references therein). The (, log hR) plane is part of what some label as “the fundamental plane” of spiral galaxy disks (e.g. Graham, 2002; Shen et al., 2002) described by vmax, , hR, where vmax is the maximum rotation velocity. For a constant velocity, virial theorem expressed as predicts a slope of 2.5, assuming a constant M/L (mass-to-light luminosity ratio). We find no morphological separation Sb-Sbc-Sc in the (, log hR) plane in our sample (Figure 7a). A separation is seen when one compares more extreme morphological types (S0/Sa-Sb versus Scd-Sm/Irr; Graham & de Blok 2001). In Figure 7b the ten most luminous disks seem to define the upper envelope and the ten least luminous the lower envelope of the - log hR correlation. If we divide our sample in luminosity bins we would see parallel lines of constant luminosity in Figure 7b.
Most galaxies ( 90%) have hR 10 kpc. We observe that the Sb barred galaxies have a disk scalelength larger by a factor of two compared to the nonbarred Sb galaxies. For Sbc and Sc galaxies the presence/absence of bars does not appear to affect hR (Tables 6 a-b). We also note that the barred galaxies exhibit a significant change in the disk scalelength between Sb and Sbc-Sc (Table 6a), the earlier types Sb showing the largest values. In the case of non-barred galaxies the trend is rather reversed (Table 6b).
In § 2 we found that the size of the disk decreases from Sb to Sc morphological type (Table 3). When a is normalized to the disk scalelength hR we get a rather different picture (Table 7). Sbc types are characterized by the largest values (also noted in Erwin 2005; see their Figure 7).
4.4 Bar-Bulge-Disk Scaling Relations
4.4.1 Bar-Bulge Interplay
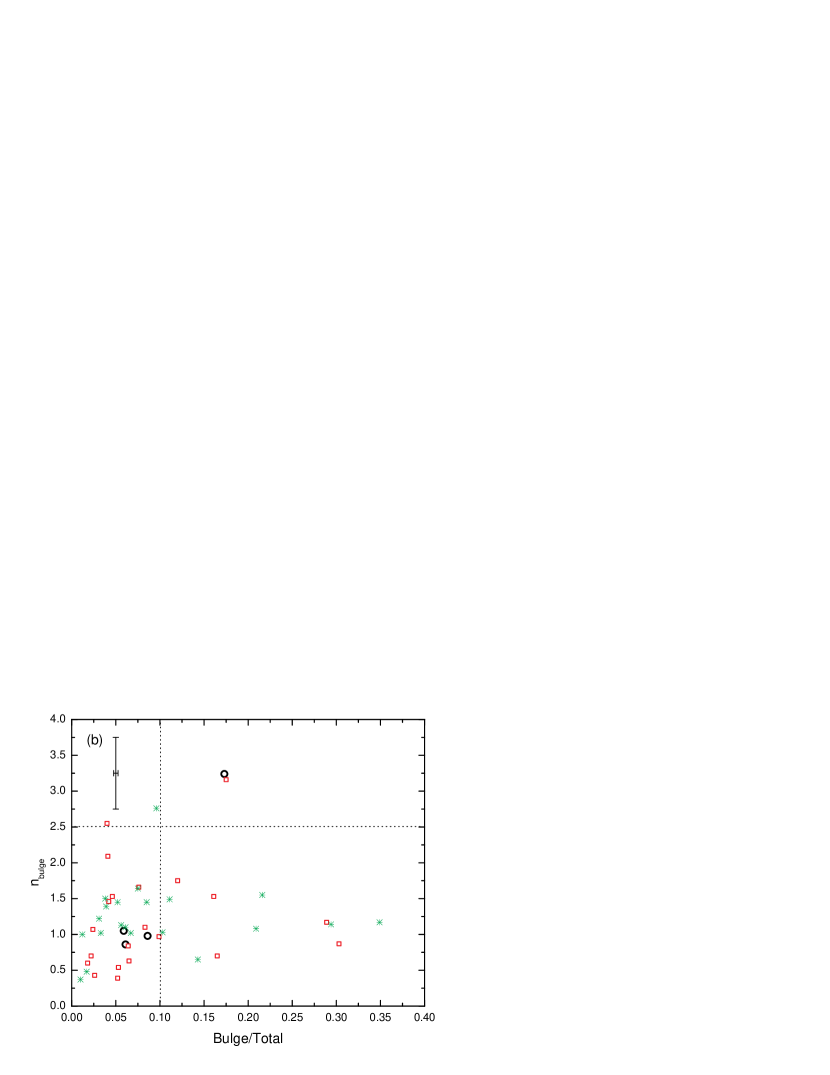
Figure 8a shows nbulge versus Bulge/Total luminosity ratio for the barred galaxies in the sample. Most barred galaxies with Bulge/Total 0.1 are morphological type Sb (81%); 67% of all barred Sb-Sc fall in the high probability pseudobulge space (Bulge/Total 0.1). Sb galaxies show a correlation even when we restrict the plot only to barred galaxies. The correlation coefficients are R0.7 for both the regression line and the bisector fit, shown with a solid and a dashed line, respectively. Figure 8b shows nbulge versus Bulge/Total luminosity ratio for the non-barred galaxies in the sample; 70% of all non-barred Sb-Sc fall in the high probability pseudobulge space (Bulge/Total 0.1). Non-barred galaxies appear to concentrate at lower values of nbulge compared to the barred galaxies. One can notice a scarce occupation for nbulge 1.7 for non-barred galaxies.
While for the barred galaxies we see a tendency to get lower values for both Bulge/Total and the Sérsic index nbulge from Sb to Sc, the non-barred galaxies show rather unchanged numbers (Tables 6ab). We also point out that the bulge effective radius re doesn’t appear sensitive to the presence/absence of bars (Tables 6ab). While barred galaxies show lower effective surface brightness from Sb through Sc, non-barred galaxies do not appear to change in bulge effective surface brightness with morphological type (Tables 6 ab).
4.4.2 Bar-Disk Interplay
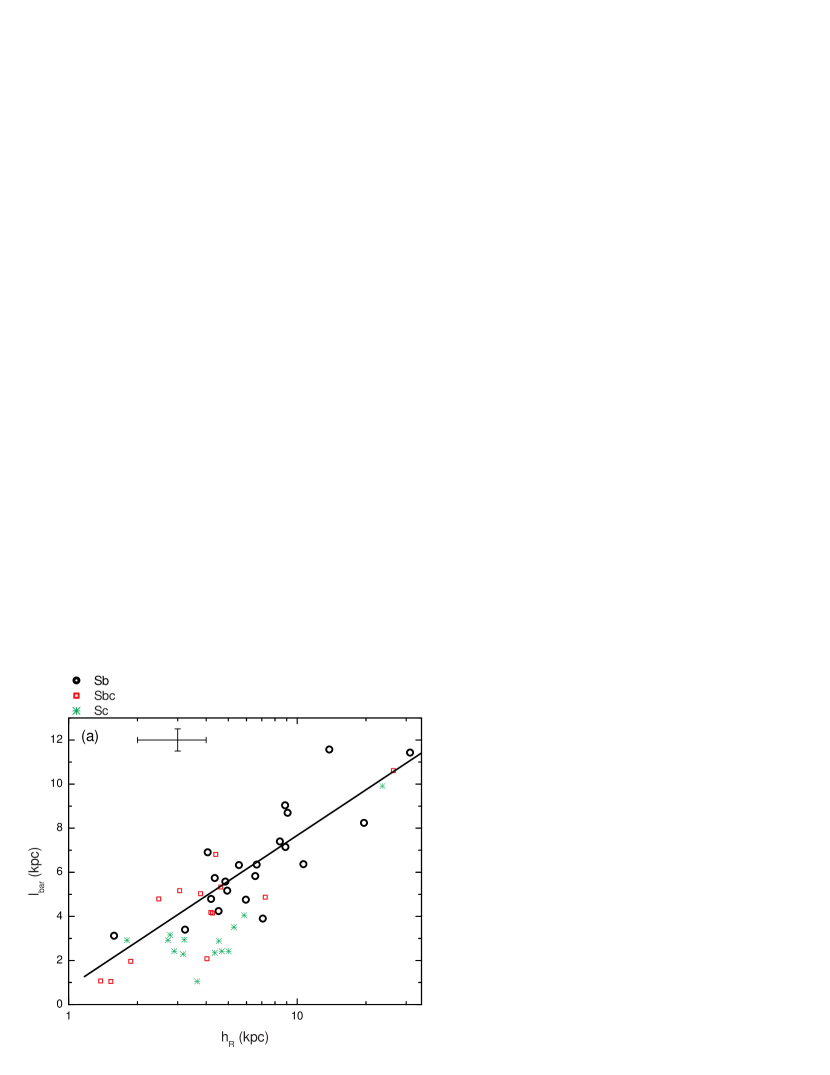
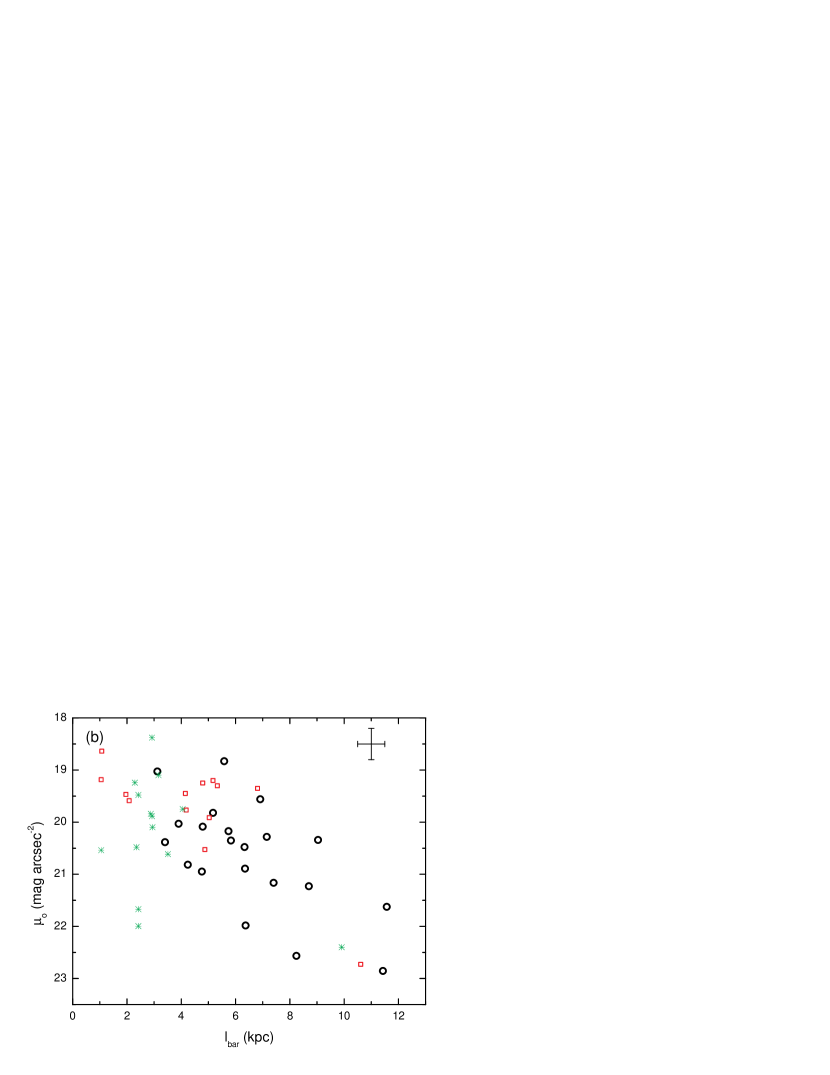
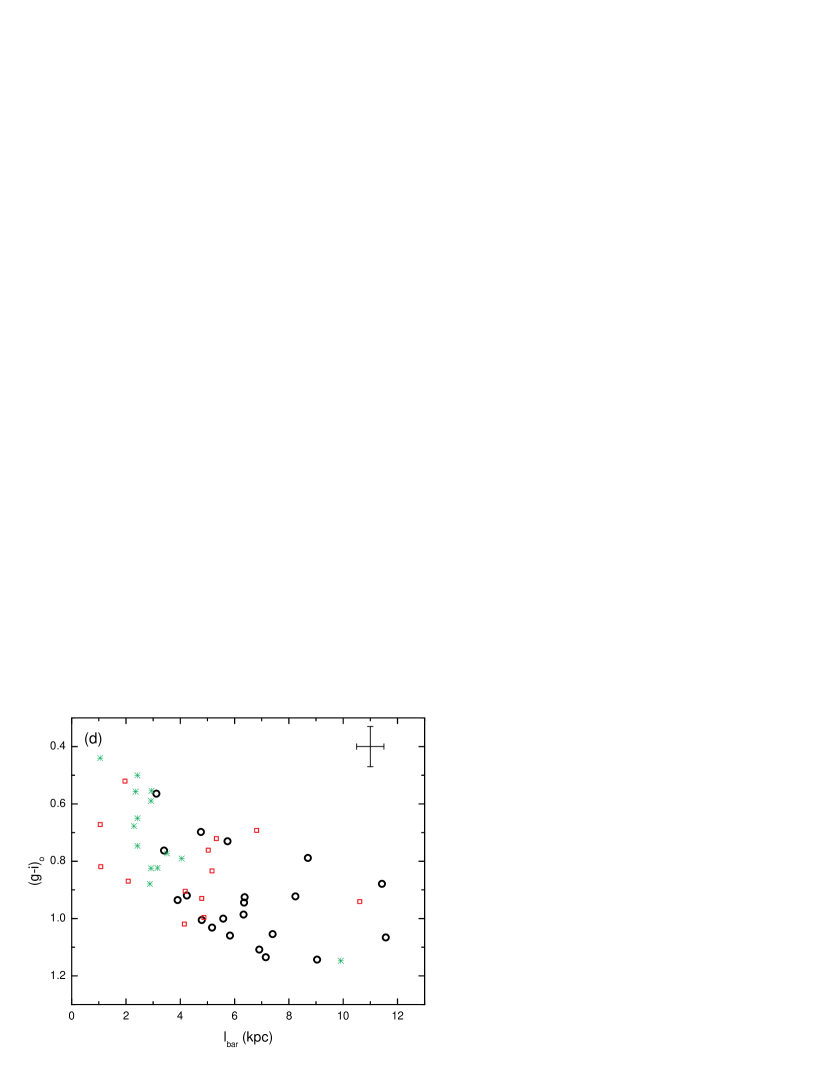
Figure 9a shows a robust correlation between the size of the bar lbar and the disk scalelength hR, regression line correlation coefficient R=0.84. Larger bars are hosted by larger disks. Figure 9b suggests that larger bars are found in disks with lower central surface brightness . Figure 9c indicates that the bar size is correlated with the absolute magnitude of the galaxy, linear regression correlation coefficient R=0.69, the more luminous galaxies harboring the largest bars (Kormendy, 1979).
Figure 9d displays a relation between the galaxy color (g-i)o and the size of the bar lbar. We observe that larger bars are hosted by redder galaxies.
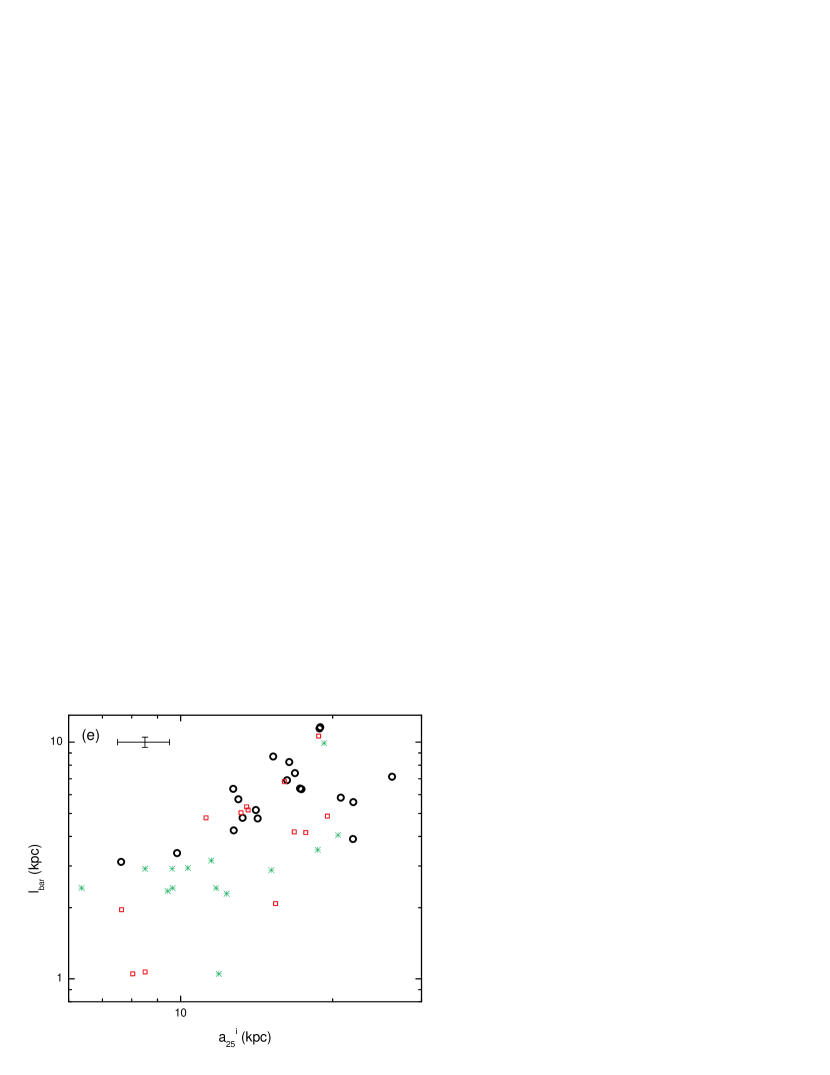
In panel a we presented a tight linear correlation between lbar and the disk scalelength hR. At this time we would like to see if a similar correlation holds between bar length lbar and the size of the disk a (Figure 9e). Although a larger scatter is evident, the trend is consistent with the previously reported result (Figure 9a), namely larger bars are hosted in larger disks.
As we reported in §§ 4.2 the size of the bar lbar appears dependent upon the morphological type, Sb hosting the largest bars and Sc the smallest ones. Even when is normalized to a the trend is still preserved. However, if lbar is normalized by hR we notice a similarity between Sb and Sbc galaxies and a rather large drop for Sc types (Table 7).
In all trends seen in Figures 9a-e one can notice a morphological separation Sb-Sbc-Sc. At one end Sb galaxies tend to have the largest bars, the largest disks, the lowest central surface brightness, being the most luminous and the reddest. At the other end lie the Sc galaxies.
4.4.3 Bulge-Disk Interplay
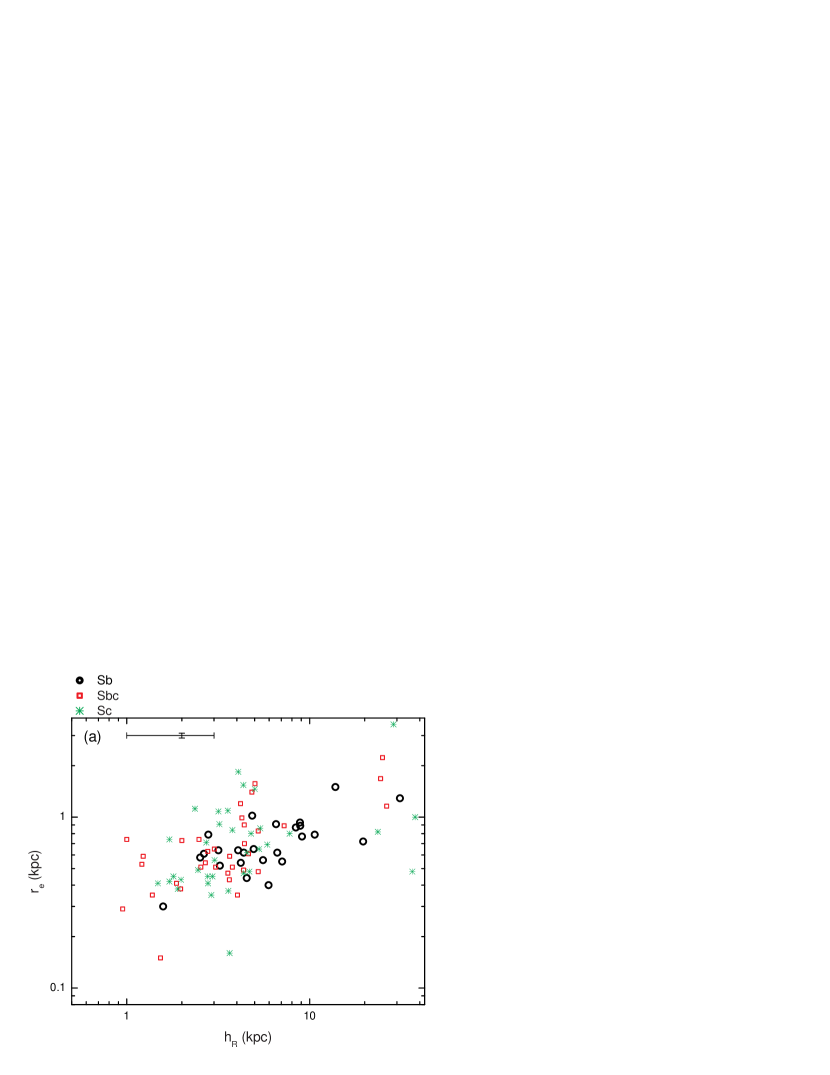
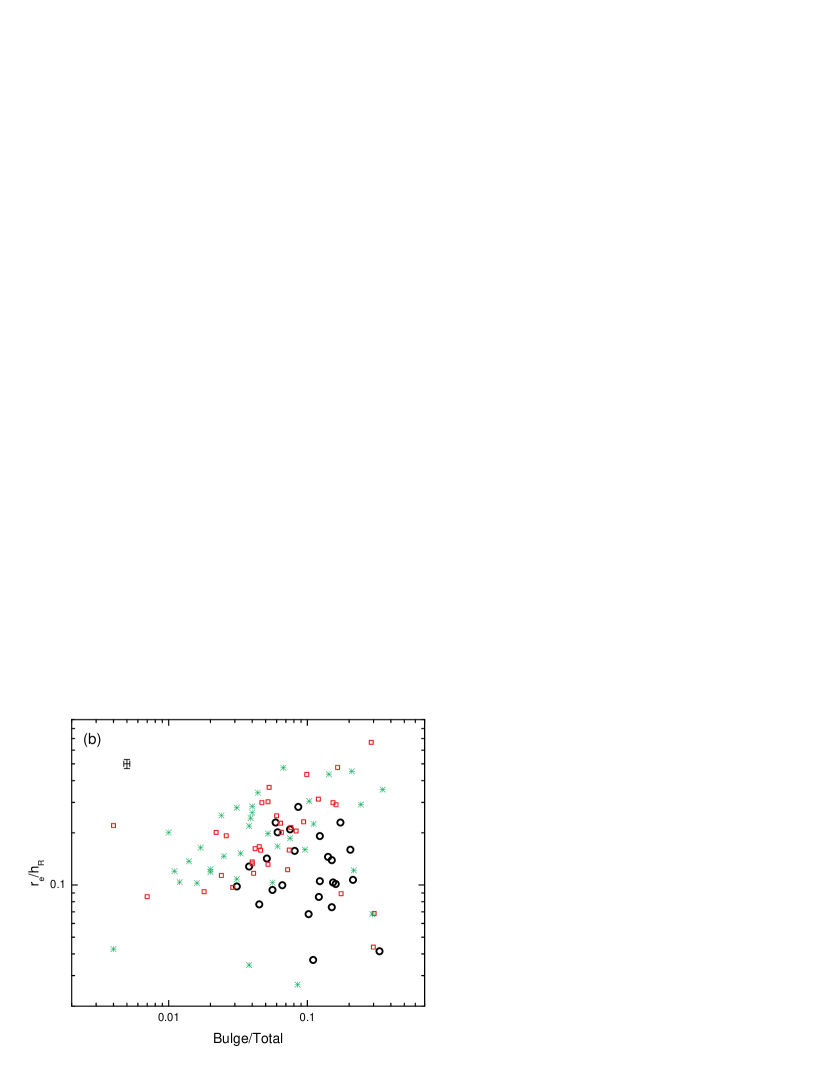
Figure 10a plots the bulge effective radius re versus the disk scalelength hR (linear regression correlation coefficient R=0.55). Larger bulges are associated with larger disks. Figure 10b shows the bulge effective radius normalized to the disk scalelength as a function of Bulge/Total ratio. This later panel should be considered in conjunction with Tables 8ab. Table 8a presents the average values (mean/median) of for each morphological type (considering also barred vs. non-barred galaxies) and Table 8b displays those averages for galaxies with Bulge/Total 0.1 and Bulge/Total 0.1, respectively. We found a similar proportion (half-half) of barred/non-barred among galaxies with Bulge/Total 0.1. The same relative distribution of barred/non-barred we find for galaxies with Bulge/Total 0.1. We observe that non-barred galaxies have on average larger than barred galaxies for all morphological types (Table 8a). This seems to be the case even when we divide the sample about Bulge/Total=0.1 (Table 8b).
Three main conclusions emerge from Figure 10b: a) for galaxies with Bulge/Total 0.1 the points appear evenly distributed about , b) the dispersion of values increases as Bulge/Total gets larger and c) Sb galaxies seem to detach themselves from a clear correlation described by Sbc and Sc galaxies (see also Laurikainen et al. 2007).
In Figure 10c we test whether Bulge/Disk luminosity ratio scales with the bulge effective radius re normalized to the size of the disk a. The scatter is rather large, with an increasing dispersion for larger Bulge/Disk values. Nonetheless, a global trend is evident, with getting larger as Bulge/Disk gets larger. We see again, just like in panel b, a separation of Sb galaxies from the rest of the sample, Sbc-Sc showing a correlation between the two parameters.
5 CAS parametrization - Data Analysis
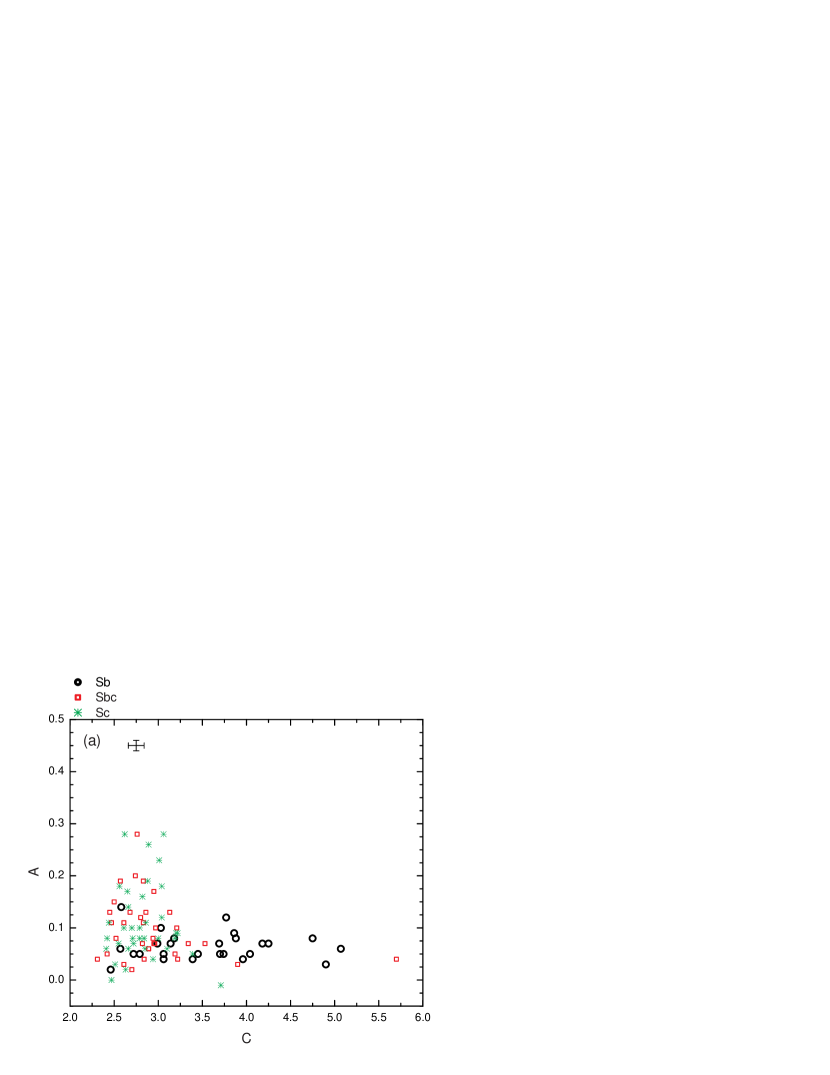
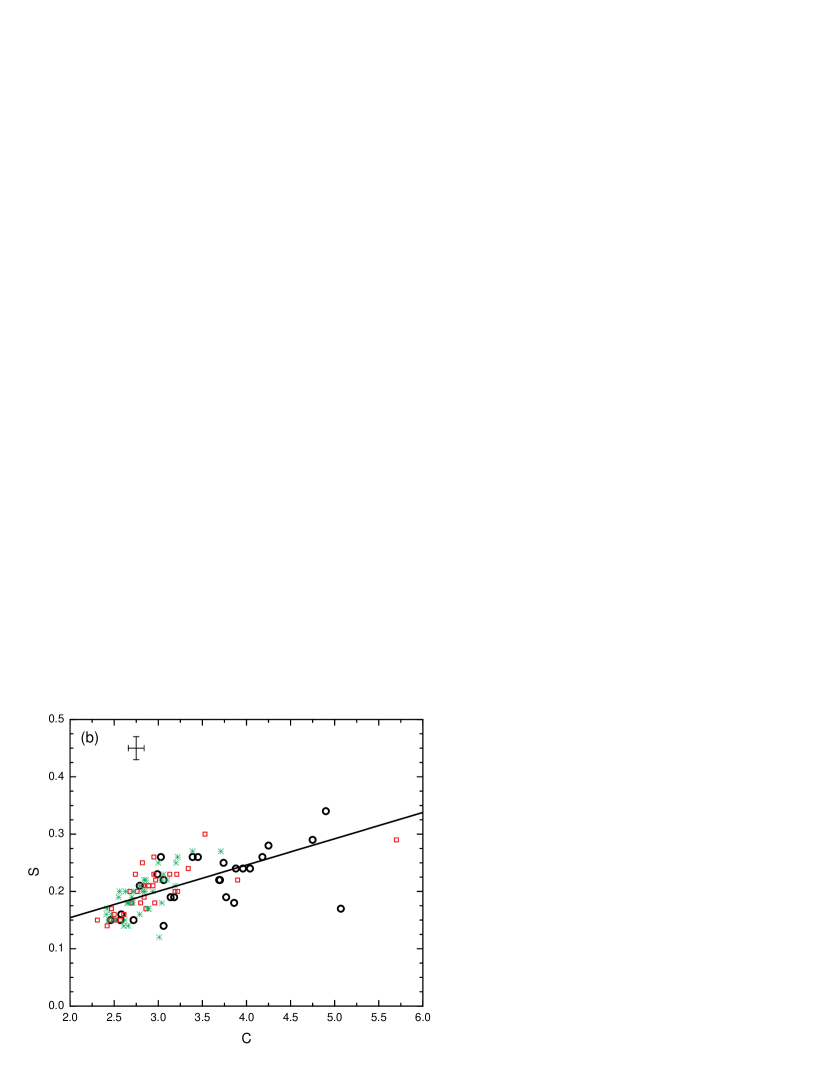
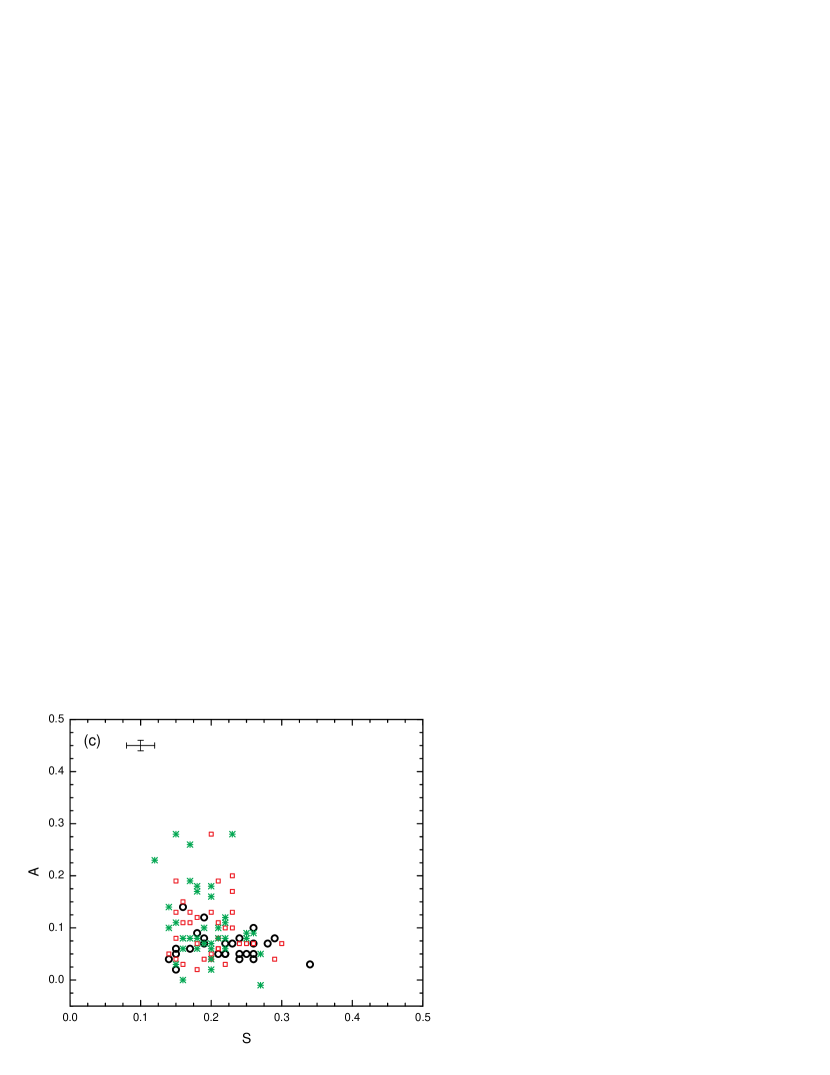
CAS parameters are a useful diagnostic indicating possible interacting processes. Our sample is particularly useful in defining the natural levels of these parameters. We have considered for this part of the analysis our sample of n=96 galaxies (including KIG 600 and KIG 754 for which we could not perform reliable BUDDA decomposition - see § 4). The results are summarized in Table 9. Table 10 presents CAS averages (mean/median) measures. Concentration parameter C shows a clear decrement with morphological type from Sb to Sc. We also note that Sb galaxies appear more symmetric than Sbc-Sc types.
The three panels of Figure 11 show the CS-CA-SA parameter planes for our isolated galaxies. The most significant correlation appears between the Clumpiness index S and the Concentration index C (linear regression correlation coefficient R=0.66). The more concentrated galaxies appear clumpier as well. We note that Sb galaxies show a behavior rather different relative to Sbc-Sc types. The former show a wide range of concentration indices (C) and are clustered in the region of very low values of asymmetry index (A), while the latter show a smaller extent in C, yet a much wider range of asymmetry.
6 Combining BUDDA-based and CAS measures
It is useful to look for trends between physical parameters that describe the larger scale (low frequency) components of galaxies (i.e. BUDDA-based measures) and morphological parameters (i.e. CAS) that are sensitive to the higher frequency structures.
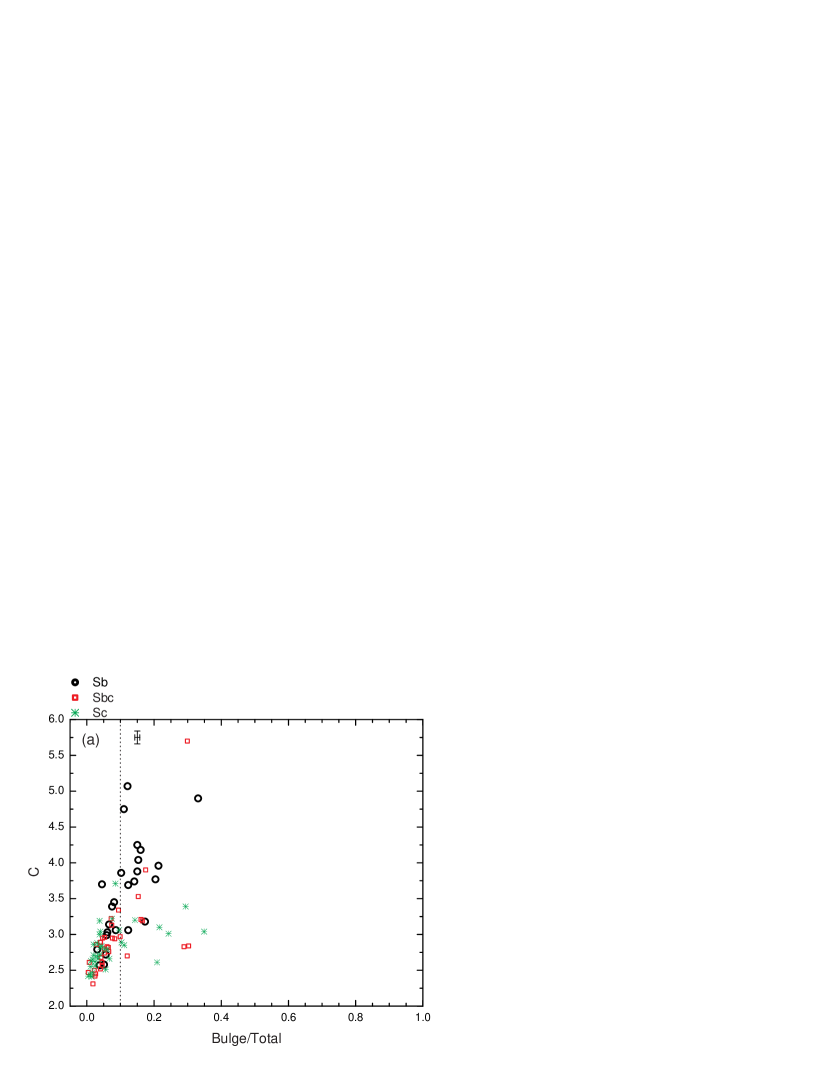
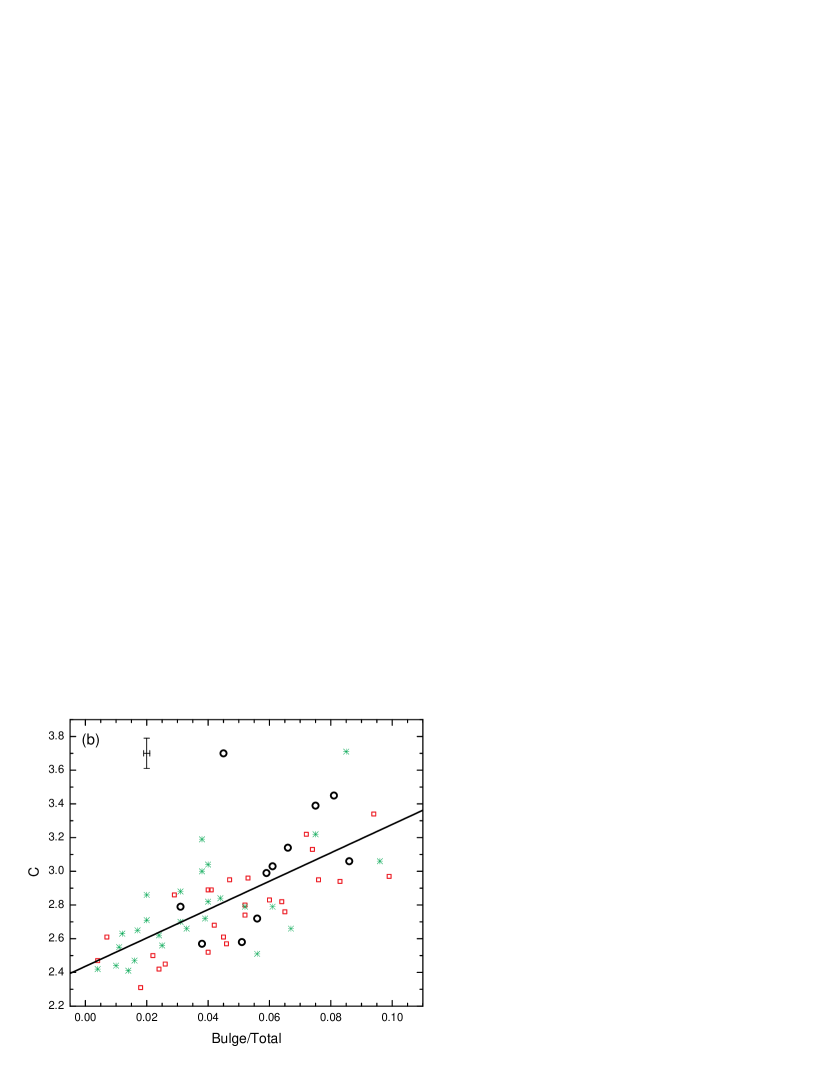
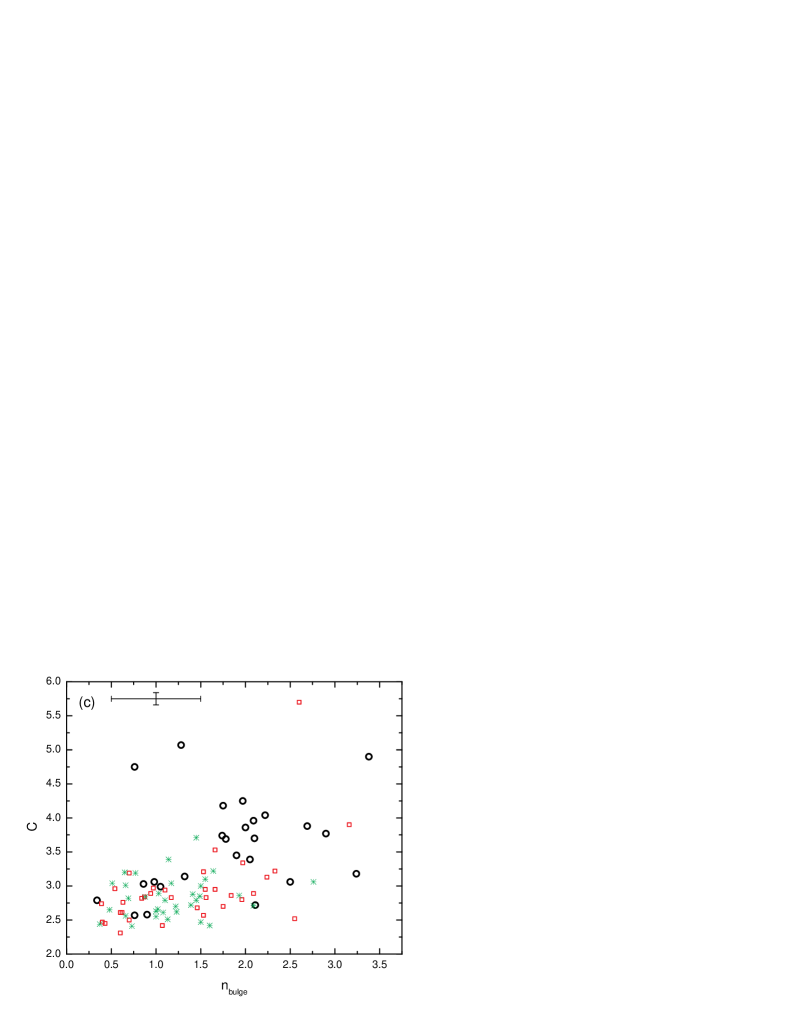
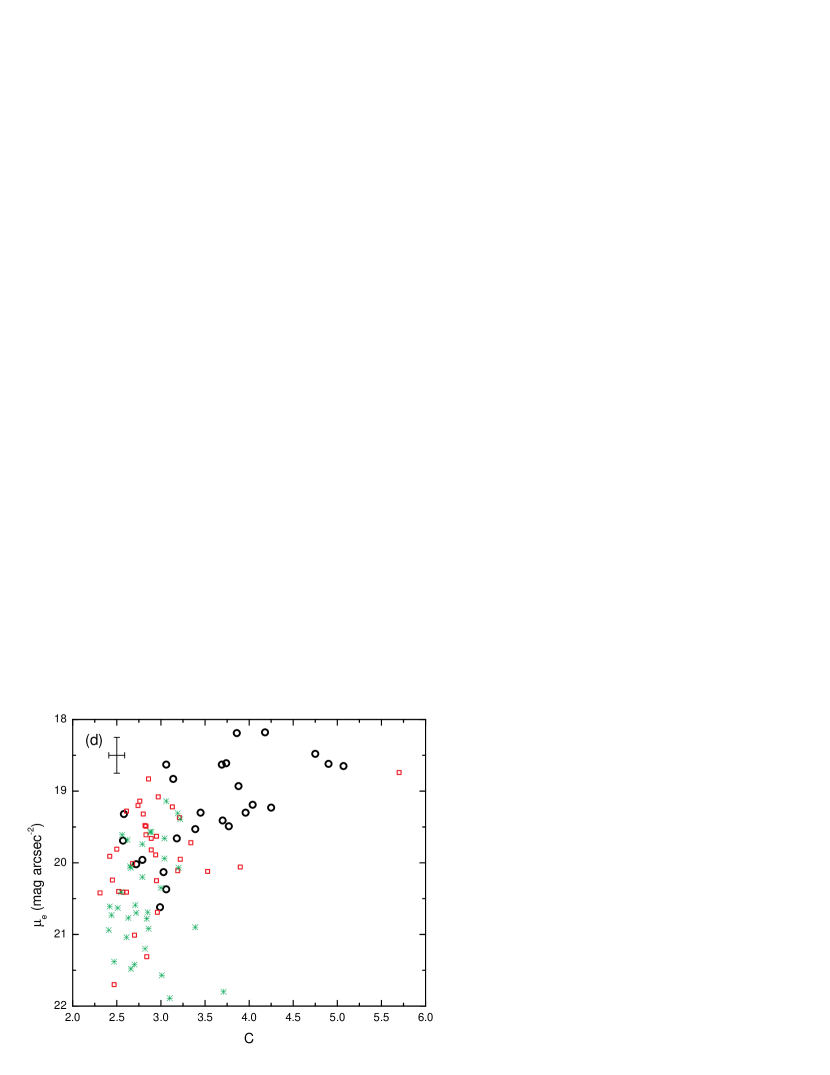
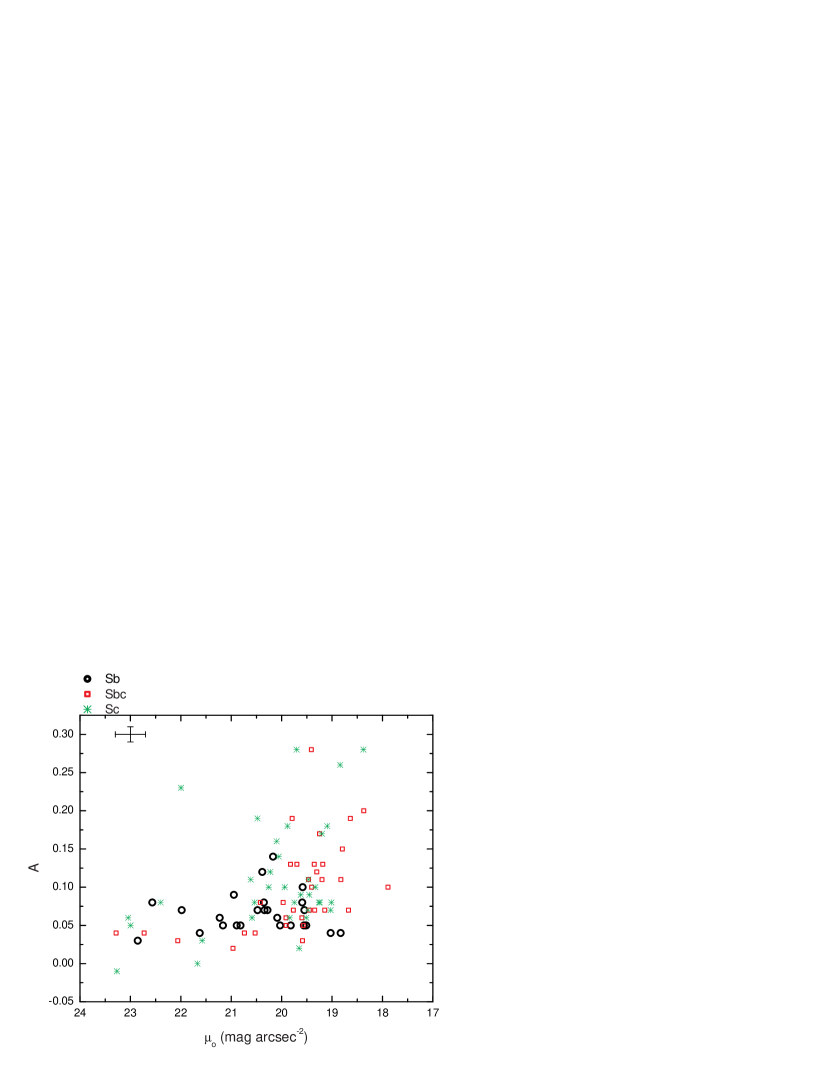
Figure 12 (a-d) presents relationships between the Concentration index C and parameters that describe the bulge. As reported in previous sections all measures (C, nbulge, Bulge/Total, ) appear dependent upon the morphological type. Therefore, in general terms, the trends shown in the panels of Figure 12 are somehow predictable. Yet, it is important to emphasize a few aspects: 1) for Bulge/Total 0.1, galaxies show a clear linear correlation between Bulge/Total and C (linear regression correlation coefficient R=0.68), but for Bulge/Total 0.1 there is a large scatter in that plot (panels a-b); 2) Concentration index C scales with the bulge Sérsic index nbulge with an increasing dispersion as nbulge gets larger (panel c); 3) larger concentration indices C are found only in galaxies characterized by brighter bulge effective surface brightness (panel d) (see also Graham, 2001b). We also find that more asymmetric galaxies (larger A) are restricted to brighter central surface brightness disks () (Figure 13). Barred and non-barred galaxies show very similar behavior in the A- plane (not shown in the paper). The meaning of the curved trends illustrated in Figures 12d and 13 are not completely clear at this time. Extending the morphological range in both directions outside the Sb-Sc morphological range may be relevant in this regard.
7 Discussion and Conclusions
We have presented a detailed structural analysis for a well defined sample of 100 late-type isolated galaxies. If a bona fide isolated (pure “nature”) population of galaxies exists then our previous work (Sulentic et al., 2006) suggests that it is dominated by systems with spiral morphology ( 84%) with the bulk in the range Sb-Sc (63%). We assume that the galaxies we investigate here are best described as “minimal nurture and maximal nature” systems because they are as isolated as individual galaxies can be. This hypothesis does not imply that these isolated galaxies have undergone no merger activity since their epoch of formation but rather that major mergers are probably absent from their past 3Gyr history. We do note that the AMIGA sample includes 14% early-type galaxies and those are systems of such low luminosity as to suspect little or no major merger activity over their entire history (Sulentic et al., 2006).
One might reasonably expect the tightest correlations between various intrinsic properties from a sample of isolated galaxies, where it is assumed that nurture (i.e. interactions) would increase the scatter (e.g. UBV-colors; Larson & Tinsley 1978). The strength of this study is manifold: the large size of the sample, the uniformity of the SDSS data, the robustness of the BUDDA code and the stringent isolation criteria underlying the definition of the parent AMIGA sample. In this study we have retained subjective morphological classifications and investigate morphological type dependence of various properties even though the typical range is narrow. This narrowness coupled with our “nurture-free” assumption raises the possibility that Hubble type T=41 may represent the seed population for all spiral galaxies.
7.1 Pseudobulges in Isolated Galaxies
We present evidence favoring the hypothesis that most or all late-type isolated galaxies host pseudobulges (§§ 4.1) rather than classical bulges:
A. A large majority of our isolated systems host relatively “unevolved” bulge structures (as hypothesized by Hunt et al. 2004); most Sérsic indices (nbulge) are smaller than 2.0-2.5 (see Table 5 and Figure 4) with the largest concentration around nbulge 1.3-1.4. Such bulges are probably not as relaxed as larger bulges in earlier spiral types. They are likely dominated by rotation unlike higher Sérsic index bulges (for a detailed discussion on this subject see section 4.6 in Kormendy & Kennicutt 2004, section 4.2 in Laurikainen et al. 2007 and references therein).
B. We observe a large range of effective surface brightness for a rather narrow range of re (these two last parameters defining in part the fundamental plane) - see Figure 5a. The locus occupied by the bulges of our Sb-Sc galaxies in this plane is similar to that of disky bulges of galaxies at the end of dissipative collapse (Capaccioli et al., 1992). The lack of correlation between and re supports the case of “pseudobulges” for isolated spiral galaxies in our sample. As pointed out in MacArthur et al. (2003), these results support an “iceberg” scenario, i.e. late-type spiral bulges are “more deeply embedded in their host galaxy disk than earlier type bulges”. This idea is further complemented by the fact that the size of the bulge (re) scales with the scalelength of the disk (Figure 10a) (see also e.g. Khosroshahi et al., 2000; MacArthur et al., 2003; Mndez-Abreu et al., 2008; Fisher & Drory, 2008).
We observe a larger dispersion in re/hR for larger Bulge/Total luminosity ratios (Figure 10b). However, in Figures 10b-c one can clearly see that Sbc-Sc galaxies do show a clear increasing trend for re/hR and re/a with Bulge/Total and Bulge/Disk luminosity ratio, respectively. In contrast, Sb galaxies appear detached from the Sbc-Sc population. Assuming that the bulge Sérsic index and/or Bulge/Total luminosity ratios are reasonable discriminators of pseudo- versus classical bulges (§§ 4.1), then amongst our sample Sb galaxies have the greatest chance of hosting classical bulges. Thus, in Figures 10b-c we may have yet another indication that the pseudobulges and the galactic disks are clearly connected, while the classical bulges do not show similar scaling relations.
Some studies (e.g. Thomas & Davies 2006) argue that “secular evolution through the disk and the phenomenon of pseudobulge formation are most likely restricted to spirals of types Sc and later”. Our results (but see also Laurikainen et al. 2007) find a large fraction of pseudobulges among spiral types earlier than Sc (see §§ 4.1). This may be telling us that the formation of pseudobulges does not appear exclusively restricted to Sc types or later. Our results suggest that if one considers only morphological types later than Sc, one may identify an almost pure pseudobulge population of galaxies. A fundamental question mentioned earlier is whether the isolated Sb-Sc spiral galaxies constitute the seed population of unnurtured spirals? If so then isolated galaxies might be expected to host a pure pseudobulge population. In this context Sb types in our sample have the greatest chance of bulge building via nurture and may involve a mixed classical and psuedobulge population. In Figure 4 it is interesting that a linear correlation emerges only for galaxies of Sb type which bridges the classical and pseudobulges domains. Alternatively, the trend may be telling us that all/most Sb galaxies contain a real (classical) bulge. This would suggest that some large bulges are natural or that all Sb spirals in the sample are a product of nurture. The latter interpretation is disfavored by the extreme isolation of our sample.
7.2 The Role of Bars in the Formation of Pseudobulges
The results of the present study could set constraints for various galaxy formation and evolution models. Two important galaxy formation scenarios have been proposed and advocated: 1) spheroidal component (bulge) forms prior to the disk component in a monolithic collapse or via early mergers (so called “inside out” formation, e.g. Eggen et al. 1962; Baugh et al. 1996; Kauffmann 1996; van den Bosch 1998; Cole et al. 2000; Merlin & Chiosi 2006) and 2) bulges form after the disk component as a result of secular dynamics/evolution driven by a disk instability (e.g. Courteau et al., 1996; Zhang, 2004) possibly triggered by external satellite accretion (e.g Aguerri et al., 2001; Eliche-Moral et al., 2006). The former mechanism may be dominant for elliptical galaxies and in early spiral galaxies with large bulges (as they all appear to share similar properties and scaling relations within the fundamental plane; e.g. Kormendy 1985; Djorgovski & Davis 1987; Faber et al. 1987). The latter mechanism may be more plausible for late type spiral systems (e.g. Carollo, 1999; Hunt et al., 2004; Debattista et al., 2004), as they largely harbor pseudobulges.
Some authors proposed that bulges of late type spiral galaxies are formed primarily through secular evolution of bars (e.g. Kormendy, 1979, 1993; Norman et al., 1996; Hasan et al., 1998; Fathi & Peletier, 2003; Kormendy & Kennicutt, 2004; Athanassoula, 2005; Jogee et al., 2005; Debattista et al., 2006). Others have suggested that bars can help the process of “pseudobulge” formation (making it faster and more efficient), but is not a necessary requirement for that process (e.g. Laurikainen et al., 2007, and references therein). Bars can transport gas inward (e.g. Sakamoto et al., 1999; Sheth et al., 2005) potentially contributing to the formation of a bulge. On the other hand it has been proposed that even without a bar the stellar disk component could be redistributed due to a secular torque action (e.g. Zhang & Buta, 2007).
We find a larger fraction of barred galaxies among Sb types relative to Sbc-Sc types (§§ 4.2). Sb galaxies also appear to host the largest bars (Table 6a) within the morphological sequence Sb-Sbc-Sc. If bars are assumed as necessary precursors of all pseudobulges, then the smaller bars in later type galaxies “dissolve” more efficiently in the process of bulge formation. It is interesting to mention that for Sb and Sbc types in our sample of isolated galaxies we find systematically larger values of the index nbulge for barred galaxies compared to the non-barred galaxies (Tables 6a-b). The difference almost vanishes for Sc barred and non-barred. Laurikainen et al. (2007) report a rather opposite result for Sb type (see their Figure 3). If nbulge is one of the empirical discriminators between classical and pseudobulges then any connection with the presence/absence of bars merits further attention. In this context it is relevant to review our Figures 8a-b. We note the “disappearance” of objects with nbulge above 1.7 for non-barred galaxies (Figure 8b in contrast to Figure 8a). We tested whether this may be caused by the resolution limitation in SDSS images, thus the BUDDA code’s inability to identify the presence of a bar. First, we analyzed the distribution of nbulge values of non-barred galaxies with VR lower and higher than the median VR of the full non-barred sample ( 5700 km s-1), respectively. We found no significant difference. Secondly, for our galaxies, the typical seeing FWHM is better than 1″, with very few cases at 1.5″. Considering the most extreme case, for a galaxy showing VR 10,000 km s-1 a 1.5″seeing would translate into a spatial resolution of 1.0 kpc, which is well within the capability of the BUDDA code to provide reliable structural measures (Gadotti, 2008). The scarcity of non-barred galaxies with nbulge above 1.7 is consistent with the scenario that bars could transform by dissolution into pseudobulges. The presence of bars may influence the degree of relaxation of bulges in the sense that nbulge decreases from Sb through Sc only for barred galaxies, but not for non-barred spirals (§§ 4.2).
The formation and lifetime of bars may be sensitive to environment (e.g. Gerin et al., 1990). It has been suggested that bars in early type spiral galaxies are formed by tidal interactions with other galaxies and those in late types have intrinsic origin (Noguchi, 1996). The connection bars-environment may be different for early and late type spirals (Noguchi, 1996, 2000), being proposed a “bimodality” of bars in this sense. Moreover, numerical simulations have shown that for Sb-Sc galaxies bars are transient features and dissolve progressively in 1-2 Gyr (Bournaud et al., 2005). As we pointed out earlier, the AMIGA/CIG isolated galaxies have been basically nurture-free for at least a comparable time. We find that 50-60% of our present sample are barred galaxies. The conclusion here could be that the bars we observe in these late type isolated spiral galaxies have been likely renewed or reformed through internal processes and not by external accretion or interactions (e.g. Block et al., 2002; Berentzen et al., 2004). It is also interesting to mention we find that the largest bars lie in disks with the lowest central surface brightness (Figure 9b). This is consistent with the idea that bars build up from the material in the central parts of disks and they are products of secular dynamical evolution within the disk.
We find that our isolated galaxies tend to host large bars999However, one must be aware that there is no standard definition for the length of a bar in a galaxy (Erwin, 2005) and scaling parameters for galaxy components may be sensitive to the filter that is used for photometry.. Our Figure 6 shows that most bar radii are clustered in the range 2-6 kpc. Erwin 2005 (based on Martin 1995) reports typical bar sizes in the range 1-3 kpc (B-band) for morphological types Sb-Sc having absolute magnitudes similar to our sample. A more recent study (Marinova & Jogee, 2007) presents a characterization of bars in optical (B-band) and near-IR (H-band) for the OSUBSGS sample of galaxies. In order to compare the bar sizes with their estimates, we restrict their sample to Sb-Sc morphological range, based on the RC3 catalog (de Vaucouleurs et al., 1991). The OSUBSGS-based sample has a similar distribution of absolute magnitudes as our sample. In terms of lbar, our sample of barred galaxies (n=48) is characterized by a mean 5.0 kpc and a median 4.8 kpc. For The OSUBSGS sample of n=49 barred galaxies, the mean and median values (H-band) of lbar 3.8 kpc and 3.4 kpc, respectively. The conclusion is that the size of bars may be related to the environment, isolation favoring larger bars.
Moreover, this conclusion seems to be consistent with reports that the disk scalelength hR of spiral galaxies in rich environments is typically smaller than that of field (i.e. isolated) galaxies (e.g. Aguerri et al., 2004). We find that the bar size scales with the disk scalelength hR (our Figure 9; see also Laine et al. 2002). In extreme environments (e.g. compact groups) spiral galaxies tend to lose their disk components by dissolution into a stellar halo. The size of the disks in what we assumed were initially late type spiral galaxies in Seyfert’s Sextet for example (estimated by the last concentric isophote) is less than 10 kpc diameter, comparable to the smallest disks in our present sample (Durbala et al., 2008). Comparing our estimates with the similar quantities reported in Erwin (2005) we observe the same declining trend from Sb through Sc; for our sample we do obtain systematically larger ratios relative to that study, although we note that Erwin (2005) measures are based on B-band data from Martin (1995).
7.3 CAS Structural Measures in Isolated Galaxies
The minimal environmental influence on AMIGA/CIG galaxies investigated here is revealed also by an analysis of the structural properties in terms of CAS parameters (§ 5). Due to the narrow morphological range represented in our sample of isolated galaxies, any attempt at comparison with other studies must be cautiously explored. Nonetheless, the size of the sample examined in the present study allows a meaningful comparison of the 96 galaxies as a whole (i.e. the full set of Sb-Sc galaxies) with galaxies of same morphological types selected without isolation constraints. Table 11 offers such a comparison with the subsample of Sb-Sc galaxies (n=49) examined in Conselice (2003), extracted from the Frei et al. (1996) sample, assumed representative for the population of nearby normal galaxies. The general conclusion is that the isolated galaxies are less concentrated, less asymmetric and less clumpy than other galaxies of same morphological type selected without isolation criteria. Thus, we may have clear indications of environmental influence on the structure of galaxies. This may be telling us that the formation of large central concentrations and large clumps within disks are disfavored in the absence of comparable sized neighbors.
7.4 Describing the Morphological Classification
Although our study involves a narrow range of morphological types all plots that involve exclusively bulge measures show clear morphological separation (e.g. Figure 5). When we combine disk measures (e.g. Figure 7a), the morphological segregation is less clear or absent suggesting some commonality among disk properties over the Sb-Sc range. Thus, it appears that the morphological separation may be associated with a change in the luminosity profile of bulges as indicated by their Sérsic indices. Hunt et al. (2004) proposed that spiral galaxies may begin with low bulge Sérsic index. As they age they change into structurally more evolved systems (toward nbulge = 4 or higher) also characterized by higher surface brightness (see Figures 5a, 12d) and an increased absolute magnitude (see Figures 5b-d). However, Carollo (1999) argue that pseudobulges cannot evolve into denser r1/4 (i.e., nbulge=4) bulges just by repeated cycles of bar formation/disruption.
At the same time one should keep in mind that the bulge Sérsic index is associated with rather large uncertainties (§§ 4.1), which complicates its use for a quantitative morphological classification (Gadotti, 2008). It appears that the concentration index C, the Bulge/Total (or Bulge/Disk) luminosity ratio and the bulge Sérsic index are relevant parameters when one describes the morphological sequence of spiral galaxies from earlier to later types. Nonetheless, Figure 12 suggests that the morphological diversity of spiral galaxies is deeply connected to the structure of their bulges. The concentration index C is not a good tracer of Bulge/Total ratio for Bulge/Total 0.1. This is true because the bulge light is no longer concentrated within the radius that includes 20% of the total light (section § 3; see also Graham 2001b). It is not obvious why the bulge surface brightness shows a plateau in its trend versus C (Figure 12d). However, one may speculate that the fact that some of the Sb galaxies curve away from the main trend (described largely by Sbc and Sc types) toward larger C values could be due to a different type of bulges they host.
7.5 Final Remarks
This present study could be complemented by an extension of a similar type of analysis to the whole set of isolated spiral galaxies, which would include the whole sequence of Hubble morphological types. This would provide a more general and a more clear picture on the morphological type dependence of various structural properties and scaling relations presented and discussed here. Measures of bulge colors and kinematics would both provide strong tests of our hypothesis that most isolated spirals involve pseudobulges. Another complementary approach is a Fourier analysis of our images, which would provide a quantitative description of the spiral structure, intimately connected to galactic morphology as well. This is part of an ongoing project we are working on at this time and the results will be presented in a future paper.
Acknowledgments
We thank Dr. Dimitri Alexei Gadotti for answering many questions about the BUDDA code. His prompt and clear replies are sincerely appreciated. LVM is partially supported by DGI Grant AYA 2005-07516-C02-01 and Junta de Andalucía (Spain).
This study has made use of SDSS Data Release 6. Funding for the SDSS and SDSS-II has been provided by the Alfred P. Sloan Foundation, the Participating Institutions, the National Science Foundation, the U.S. Department of Energy, the National Aeronautics and Space Administration, the Japanese Monbukagakusho, the Max Planck Society, and the Higher Education Funding Council for England. The SDSS Web Site is http://www.sdss.org/. The SDSS is managed by the Astrophysical Research Consortium for the Participating Institutions. The Participating Institutions are the American Museum of Natural History, Astrophysical Institute Potsdam, University of Basel, University of Cambridge, Case Western Reserve University, University of Chicago, Drexel University, Fermilab, the Institute for Advanced Study, the Japan Participation Group, Johns Hopkins University, the Joint Institute for Nuclear Astrophysics, the Kavli Institute for Particle Astrophysics and Cosmology, the Korean Scientist Group, the Chinese Academy of Sciences (LAMOST), Los Alamos National Laboratory, the Max-Planck-Institute for Astronomy (MPIA), the Max-Planck-Institute for Astrophysics (MPA), New Mexico State University, Ohio State University, University of Pittsburgh, University of Portsmouth, Princeton University, the United States Naval Observatory, and the University of Washington.
References
- Adelman-McCarthy et al. (2008) Adelman-McCarthy, J.K. et al. 2008, ApJS, 175, 297
- Aguerri et al. (2001) Aguerri, J. A. L., Balcells, M., Peletier, R. F. 2001, A&A, 367, 428
- Aguerri et al. (2004) Aguerri, J. A. L., Iglesias-Paramo, J., Vilchez, J. M., Muñoz-Tuñón, C. 2004, AJ, 127, 1344
- Andredakis & Sanders (1994) Andredakis, Y. C. & Sanders, R. H. 1994, MNRAS, 267, 283
- Andredakis et al. (1995) Andredakis, Y. C., Peletier, R. F., Balcells, M. 1995, MNRAS, 275, 874
- Athanassoula (2005) Athanassoula, E. 2005, MNRAS, 358, 1477
- Balcells et al. (2007) Balcells, M., Graham, A. W., Peletier, R. 2007, ApJ, 665, 1104
- Barazza et al. (2008) Barazza, F. D., Jogee, S., Marinova, I. 2008, ApJ, 675, 1194
- Baugh et al. (1996) Baugh, C. M., Cole, S., Frenk, C. S. 1996, MNRAS, 283, 1361
- Beijersbergen et al. (1999) Beijersbergen, M., de Blok, W. J. G., van der Hulst, J. M. 1999, A&A, 351, 903
- Berentzen et al. (2004) Berentzen, I., Athanassoula, E., Heller, C. H., Fricke, K. J. 2004, MNRAS, 347, 220
- Bershady et al. (2000) Bershady, M. A., Jangren, A., Conselice, C. J. 2000, AJ, 119, 2645
- Block et al. (2002) Block, D. L., Bournaud, F., Combes, F., Puerari, I., Buta, R. 2002, A&A, 394, 35
- Bournaud et al. (2005) Bournaud, F., Combes, F., Semelin, B. 2005, MNRAS, 364, L18
- Buta et al. (2004) Buta, R., Laurikainen, E., Salo,H. 2004, AJ, 127, 279
- Buta et al. (2007) Buta, R. J., Corwin Jr, H. G., Odewahn, S. C. 2007, “The de Vaucouleurs Atlas of Galaxies”,Cambridge University Press, ISBN-13 978-0-521-82048-6.
- Capaccioli et al. (1992) Capaccioli, M., Caon, N., D’Onofrio, M. 1992, MNRAS, 259, 323
- Carlberg (1999) Carlberg, R. G. 1999, in “The formation of galactic bulges”, edited by C.M. Carollo, H.C. Ferguson, R.F.G. Wyse, Cambridge University Press, 1999
- Carollo (1999) Carollo, C. M. 1999, ApJ, 523, 566
- Cole et al. (2000) Cole, S., Lacey, C. G., Baugh, C. M., Frenk, C. S. 2000, MNRAS, 319, 168
- Combes & Elmegreen (1993) Combes, F. & Elmegreen, B. G. 1993, A&A, 271, 391
- Conselice et al. (2000) Conselice, C. J., Bershady, M. A., Jangren, A. 2000, ApJ, 529, 886
- Conselice (2003) Conselice, C. J. 2003, ApJS, 147, 1
- Courteau et al. (1996) Courteau, S., de Jong, R. S., Broeils, A. H. 1996, ApJ, 457, L73
- Debattista et al. (2004) Debattista, V. P., Carollo, C. M., Mayer, L., Moore, B. 2004, ApJ, 604, L93
- Debattista et al. (2006) Debattista, V. P., Mayer, L., Carollo, C. Marcella, Moore, B., Wadsley, J., Quinn, T. 2006, ApJ, 645, 209
- de Jong (1996) de Jong, R. S. 1996, A&AS, 118, 557
- de Souza et al. (2004) de Souza, R. E., Gadotti, D. A., dos Anjos, S. 2004, ApJS, 153, 411
- de Vaucouleurs (1948) de Vaucouleurs, G. 1948, Annales d’Astrophysique, 11, 247
- de Vaucouleurs et al. (1991) de Vaucouleurs, G., de Vaucouleurs, A., Corwin, H. G., Jr., Buta, R. J., Paturel, G., Fouque, P. 1991, Third Reference Catalog of Bright Galaxies (New York: Springer) (RC3)
- Djorgovski & Davis (1987) Djorgovski, S. & Davis, M. 1987, ApJ, 313, 59
- Drory & Fisher (2007) Drory, N. & Fisher, D. B. 2007, ApJ, 664, 640
- Durbala et al. (2008) Durbala, A. et al. 2008, AJ, 135, 130
- Eggen et al. (1962) Eggen, O. J., Lynden-Bell, D., Sandage, A. R. 1962, ApJ, 136, 748
- Eliche-Moral et al. (2006) Eliche-Moral, M. C., Balcells, M., Aguerri, J. A. L., González-García, A. C. 2006, A&A, 457, 91
- Elmegreen & Elmegreen (1985) Elmegreen, B. G. & Elmegreen, D. M. 1985,ApJ, 288, 438
- Erwin (2005) Erwin, P. 2005, MNRAS, 364, 283
- Eskridge et al. (2000) Eskridge, P. B. et al. 2000, AJ, 119, 536
- Eskridge et al. (2002) Eskridge, P. B. et al. 2002, ApJS, 143, 73
- Espada et al. (2005) Espada, D., Bosma, A., Verdes-Montenegro, L., Athanassoula, E., Leon, S., Sulentic, J., Yun, M. S. 2005, A&A, 442, 455
- Espada (2006) Espada, D. 2006, Ph.D. Thesis, Instituto de Astrofísica de Andalucía
- Faber & Jackson (1976) Faber, S. M. & Jackson, R. E. 1976, ApJ, 204, 668
- Faber et al. (1987) Faber, S. M., Dressler, A., Davies, R. L., Burstein, D., Lynden-Bell, D. 1987, IN “Nearly normal galaxies: From the Planck time to the present”; Proceedings of the Eighth Santa Cruz Summer Workshop in Astronomy and Astrophysics, Santa Cruz, CA, July 21-Aug. 1, 1986 (A88-18401 05-90), New York, Springer-Verlag, 1987, p. 175.
- Fathi & Peletier (2003) Fathi, K. & Peletier, R. F. 2003, A&A, 407, 61
- Fisher & Drory (2008) Fisher, D. B. & Drory, N. - arXiv:0805.4206
- Freeman (1970) Freeman, K. C. 1970, ApJ, 160, 811
- Frei et al. (1996) Frei, Z., Guhathakurta, P., Gunn, J. E., Tyson, J. A. 1996, AJ, 111, 174
- Fukugita et al. (1996) Fukugita, M., Ichikawa, T., Gunn, J. E., Doi, M., Shimasaku, K., Schneider, D. P. 1996, AJ, 111, 1748
- Gadotti (2008) Gadotti, D. A. 2008, MNRAS, 384, 420
- Gerin et al. (1990) Gerin, M., Combes, F., Athanassoula, E. 1990, A&A, 230, 37
- Gil de Paz et al. (2007) Gil de Paz, A. et al. 2007, ApJS, 173, 185
- Graham (2001a) Graham, A. W. 2001a, MNRAS, 326, 543
- Graham (2001b) Graham, A. W. 2001b, AJ, 121, 820
- Graham & de Blok (2001) Graham, A. W. & de Blok, W. J. G. 2001, ApJ, 556, 177
- Graham (2002) Graham, A. W. 2002, MNRAS, 334, 721
- Grosbøl (1985) Grosbøl, P. J. 1985, A&AS, 60, 261
- Gunn et al. (1998) Gunn, J. E. et al. 1998, AJ, 116, 3040
- Gunn et al. (2006) Gunn, J. E. et al. 2006, AJ, 131, 2332
- Hamabe & Kormendy (1987) Hamabe, M. & Kormendy, J. 1987 IN “ Structure and Dynamics of Elliptical Galaxies, IAU Symp No. 127, p.379, ed. de Zeeuw, T., Reidel, D.
- Hasan et al. (1998) Hasan, H., Pfenniger, D., Norman, C. A. 1998, AAS, 19310509
- Ho et al. (1997) Ho, L. C., Filippenko, A. V., Sargent, W. L. W. 1997, ApJ, 487, 591
- Hogg et al. (2001) Hogg, D. W., Finkbeiner, D. P., Schlegel, D. J., Gunn, J. E. 2001, AJ, 122, 2129
- Hunt et al. (2004) Hunt, L. K., Pierini, D., Giovanardi, C. 2004, A&A, 414, 905
- Isobe et al. (1990) Isobe, T., Feigelson, E. D., Akritas, M. G., Babu, G. J. 1990, ApJ, 364, 104
- Jogee et al. (2005) Jogee, S., Scoville, N., Kenney, J. D. P. 2005, ApJ, 630, 837
- Karachentseva (1973) Karachentseva, V. E. 1973 Astrofizicheskie Issledovaniia Izvestiya Spetsial noj Astrofizicheskoj Observatorii, 8, 3
- Kauffmann (1996) Kauffmann, G. 1996, MNRAS, 281, 487
- Kent (1985) Kent, S. M. 1985, ApJS, 59, 115
- Khosroshahi et al. (2000) Khosroshahi, H. G., Wadadekar, Y., Kembhavi, A. 2000, ApJ, 533, 162
- Knapen (1999) Knapen, J. H. 1999, ASP Conference Series: “The Evolution of Galaxies on Cosmological Timescales”, 187, 72
- Kormendy (1979) Kormendy, J. 1979, ApJ, 227, 714
- Kormendy (1985) Kormendy, J. 1985, ApJ, 295, 73
- Kormendy (1993) Kormendy, J. 1993, IAU Symp. 153: “Galactic Bulges”, 153, 209
- Kormendy & Kennicutt (2004) Kormendy, J. & Kennicutt, R. C., Jr. 2004, ARAA, 42, 603
- Laine et al. (2002) Laine, S., Shlosman, I., Knapen, J. H., Peletier, R. F. 2002, ApJ, 567, 97
- Larson & Tinsley (1978) Larson, R. B. & Tinsley, B. M. 1978, ApJ, 219, 46
- Laurikainen et al. (2004a) Laurikainen, E., Salo, H., Buta, R., Vasylyev, S. 2004a, MNRAS, 355, 1251
- Laurikainen et al. (2004b) Laurikainen, E., Salo, H., Buta, R. 2004b, ApJ, 607, 103
- Laurikainen et al. (2007) Laurikainen, E., Salo, H., Buta, R., Knapen, J. H. 2007, MNRAS, 381, 401
- Leon & Verdes-Montenegro (2003) Leon, S. & Verdes-Montenegro, L. 2003, A&A, 411, 391
- Leon et al. (2008) Leon, S. et al. - arXiv:0804.0132
- Lisenfeld et al. (2007) Lisenfeld, U. et al. 2007, A&A, 462, 507
- Lupton et al. (2001) Lupton, R. H., Gunn, J. E., Ivezic, Z., Knapp, G. R., Kent, S., & Yasuda, N. 2001, in ASP Conf. Ser. 238, Astronomical Data Analysis Software and Systems X, ed. F. R. Harnden, Jr., F. A. Primini, & H. E. Payne (San Francisco: ASP), 269
- MacArthur et al. (2003) MacArthur, L. A., Courteau, Stphane, Holtzman, J. A. 2003, ApJ, 582, 689
- Marinova & Jogee (2007) Marinova, I. & Jogee, S. 2007, ApJ, 659, 1176
- Martin (1995) Martin, P. 1995, AJ, 109, 2428
- McCall (2004) McCall, M. L. 2004, AJ, 128, 2144
- Mndez-Abreu et al. (2008) Mndez-Abreu, J., Aguerri, J. A. L., Corsini, E. M., Simonneau, E. 2008, A&A, 478, 353
- Menndez-Delmestre et al. (2007) Menndez-Delmestre, K., Sheth, K., Schinnerer, E., Jarrett, T. H., Scoville, N. Z. 2007, ApJ, 657, 790
- Merlin & Chiosi (2006) Merlin, E. & Chiosi, C. 2006, A&A, 457, 437
- Noguchi (1996) Noguchi, M. 1996, ApJ, 469, 605
- Noguchi (2000) Noguchi, M. 2000, MNRAS, 312, 194
- Norman et al. (1996) Norman, C. A., Sellwood, J. A., Hasan, H. 1996, ApJ, 462, 114
- Pier et al. (2003) Pier, J. R., Munn, J. A., Hindsley, R. B., Hennessy, G. S., Kent, S. M., Lupton, R. H., Ivezić, Ž. 2003, AJ, 125, 1559
- Roberts & Haynes (1994) Roberts, M. S. & Haynes, M. P. 1994, ARAA, 32, 115
- Sabater et al. (2008) Sabater, J., Leon, S., Verdes-Montenegro, L., Lisenfeld, U., Sulentic, J., Verley, S. - arXiv:0803.0335S
- Sakamoto et al. (1999) Sakamoto, K., Okumura, S. K., Ishizuki, S., Scoville, N. Z. 1999, ApJ, 525, 691
- Sandage & Tammann (1981) Sandage, A. & Tammann, G. A. 1981, “A Revised Shapley-Ames Catalog of Bright Galaxies”, Carnegie Institute of Washington Publ. No. 635 (first edition)
- Schlegel et al. (1998) Schlegel, D. J., Finkbeiner, D. P., Davis, M. 1998, ApJ, 500, 525
- Sérsic (1968) Sérsic, J. L. 1968, Atlas de Galaxias Australes (Cordoba: Observatorio Astronomico)
- Shen et al. (2002) Shen, S., Mo, H. J., Shu, C. 2002, MNRAS, 331, 259
- Sheth et al. (2005) Sheth, K., Vogel, S. N., Regan, M. W., Thornley, M. D., Teuben, P. J. 2005, ApJ, 632, 217
- Shimasaku et al. (2001) Shimasaku, K. et al. 2001, AJ, 122, 1238
- Smith et al. (2002) Smith, J. A. et al. 2002, AJ, 123, 2121
- Stoughton et al. (2002) Stoughton, C. et al. 2002, AJ, 123, 485
- Sulentic et al. (2006) Sulentic, J. W. et al. 2006, A&A, 449, 937
- Takamiya (1999) Takamiya, M. 1999, ApJS, 122, 109
- Taylor-Mager et al. (2007) Taylor-Mager, V. A., Conselice, C. J., Windhorst, R. A., Jansen, R. A. 2007, ApJ, 659, 162
- Thomas & Davies (2006) Thomas, D. & Davies, R. L. 2006, MNRAS, 366, 510
- Tully et al. (1982) Tully, R. B., Mould, J. R., Aaronson, M. 1982, ApJ, 257, 527
- van den Bergh (1960a) van den Bergh, S. 1960a, ApJ, 131, 215
- van den Bergh (1960b) van den Bergh, S. 1960b, ApJ, 131, 558
- van den Bosch (1998) van den Bosch, F. C. 1998, ApJ, 507, 601
- Verdes-Montenegro et al. (2005) Verdes-Montenegro, L., Sulentic, J., Lisenfeld, U., Leon, S., Espada, D., Garcia, E., Sabater, J., Verley, S. 2005, A&A, 436, 443
- Verley et al. (2007a) Verley, S. et al. 2007a, A&A, 470, 505
- Verley et al. (2007b) Verley, S. et al. 2007b, A&A, 472, 121
- Verley et al. (2007c) Verley, S., Combes, F., Verdes-Montenegro, L., Bergond, G., Leon, S. 2007c, A&A, 474, 43
- Wyse (1982) Wyse, R. F. G. 1982, MNRAS, 199, 1
- Zhang (2004) Zhang, X. 2004, in IAU Symp. 220, “Dark Matter in Galaxies”, ed. S. Ryder et al. (San Francisco: ASP), 417
- Zhang & Buta (2007) Zhang, X. & Buta, R. J. 2007, AJ, 133, 2584
| Galaxy | R.A.(J2000) | Dec.(J2000) | vr | i | Morphological Type | ||
|---|---|---|---|---|---|---|---|
| KIG name | UGC/NGC name | (hh mm ss.ss) | (+dd mm ss.s) | (km s-1) | (o) | oldi | revised |
| KIG 11 | UGC 00139 | 00 14 31.88 | -00 44 10.4 | 3963 | 66 | Sbc | SA(s)c |
| KIG 33 | UGC 00461 / NGC 0237 | 00 43 27.81 | -00 07 26.9 | 4175 | 55 | Sb | SA(s)c |
| KIG 56 | UGC 01143 / NGC 0622 | 01 36 00.13 | +00 39 48.8 | 5155 | 43 | Sb | SB(rs)b |
| KIG 187 | UGC 03825 | 07 23 33.16 | +41 26 05.6 | 8281 | 25 | Sc | SAB(s)bc |
| KIG 198 | UGC 03935 | 07 37 49.45 | +46 23 52.4 | 9628 | 32 | Sc | SAB(s)c |
| KIG 203 | 07 44 36.40 | +38 02 39.6 | 7998 | 65 | Sc | SA(s)c | |
| KIG 217 | UGC 04107 | 07 57 01.84 | +49 34 02.1 | 3504 | 25 | Sc | SA(rs)bc |
| KIG 222 | UGC 04158 / NGC 2503 | 08 00 36.75 | +22 24 00.8 | 5506 | 28 | Sb | SAB(s)b |
| KIG 232 | UGC 04256 / NGC 2532 | 08 10 15.20 | +33 57 22.5 | 5260 | 30 | Sc | SA(rs)c |
| KIG 238 | UGC 04283 | 08 14 22.05 | +39 15 05.3 | 8295 | 18 | Sb | (R1′)SB(s)b |
| KIG 241 | 08 19 15.77 | +19 18 48.0 | 5681 | 46 | Sc | SA(s)c | |
| KIG 242 | 08 19 22.31 | +23 44 50.0 | 4603 | 54 | Sb | SA(s)bc | |
| KIG 258 | 08 31 49.40 | +28 32 11.0 | 6047 | 52 | Sb | SAB(rs)b | |
| KIG 260 | UGC 04456 | 08 32 03.53 | +24 00 38.5 | 5488 | 11 | Sc | SAB(r)c |
| KIG 271 | UGC 04512 | 08 39 39.91 | +60 58 07.7 | 7911 | 58 | Sc | SAB(s)c |
| KIG 281 | UGC 04555 / NGC 2649 | 08 44 08.30 | +34 43 01.8 | 4244 | 32 | Sc | SA(rs)bc |
| KIG 282 | NGC 2651 | 08 43 55.12 | +11 46 15.5 | 8696 | 34 | Sc | SAB(s)bc |
| KIG 287 | UGC 04624 | 08 50 23.58 | +25 57 14.5 | 8297 | 58 | Sbc | SAB(rs)bc |
| KIG 292 | UGC 04708 / NGC 2712 | 08 59 30.53 | +44 54 51.5 | 1818 | 58 | Sb | SA(s)b |
| KIG 298 | UGC 04770 / NGC 2746 | 09 05 59.41 | +35 22 38.3 | 7065 | 29 | Sb | SB(rs)b |
| KIG 302 | NGC 2761 | 09 07 30.76 | +18 26 05.2 | 8728 | 55 | Sc | SA(s)c |
| KIG 314 | UGC 04838 / NGC 2776 | 09 12 14.37 | +44 57 17.8 | 2626 | 8 | Sc | SA(rs)c |
| KIG 322 | 09 21 10.80 | +45 53 17.4 | 1858 | 22 | Sc | SA(rs)c | |
| KIG 325 | UGC 04973 | 09 22 38.12 | +60 51 55.6 | 7823 | 21 | Sc | SAB(s)bc |
| KIG 328 | UGC 05002 | 09 24 22.90 | +28 17 34.9 | 6518 | 42 | Sbc | SAB(s)bc |
| KIG 330 | 09 25 30.87 | +45 31 57.2 | 4276 | 43 | Sbc | SAB(s)bc | |
| KIG 336 | UGC 05038 | 09 27 23.45 | +30 26 26.5 | 8070 | 32 | Sb | (R1′)SB(r)b |
| KIG 339 | UGC 05055 | 09 30 11.77 | +55 51 07.4 | 7540 | 32 | Sbc | (R2′)SB(s)bc |
| KIG 351 | 09 35 21.80 | +13 32 55.9 | 5920 | 42 | Sb | SB(rs)b | |
| KIG 365 | 09 42 31.53 | +07 05 57.1 | 8627 | 27 | Sc | SAB(rs)b | |
| KIG 366 | UGC 05184 | 09 43 02.20 | +37 49 22.3 | 6581 | 53 | Sb | SB(s)b |
| KIG 367 | UGC 05201 | 09 44 34.94 | +55 45 48.3 | 7627 | 51 | Sc | SA(s)c |
| KIG 368 | 09 44 47.09 | +51 41 19.5 | 9959 | 25 | Sc | SA(s)c | |
| KIG 386 | 09 57 48.95 | +51 49 16.7 | 7490 | 49 | Sc | SAB(s)c | |
| KIG 397 | UGC 05425 / NGC 3107 | 10 04 22.53 | +13 37 18.1 | 2791 | 44 | Sb | SAB(s)bc |
| KIG 399 | 10 07 50.53 | +34 18 56.5 | 6106 | 40 | Sc | SA(s)bc | |
| KIG 401 | UGC 05472 | 10 08 32.01 | -00 39 57.2 | 6436 | 55 | Sbc | SB(rs)bc |
| KIG 405 | UGC 05521 | 10 13 52.60 | +00 33 03.0 | 6232 | 28 | Sc | SAB(s)c |
| KIG 406 | 10 14 08.03 | +10 08 54.5 | 8355 | 49 | Sc | SA(s)c | |
| KIG 409 | 10 22 00.37 | +25 52 20.1 | 6371 | 40 | Sbc | SAB(s)bc | |
| KIG 410 | UGC 05606 | 10 22 24.06 | +01 11 55.1 | 6492 | 36 | Sbc | SA(s)bc |
| KIG 429 | 10 39 45.32 | +11 38 49.8 | 8991 | 42 | Sc | SAB(s)c | |
| KIG 444 | UGC 05956 | 10 50 58.37 | -02 09 00.6 | 4469 | 13 | Sb | SAB(s)c |
| KIG 446 | 10 52 25.05 | +59 41 08.9 | 8417 | 44 | Sc | SA(rs)bc | |
| KIG 460 | 11 05 00.56 | +14 53 43.8 | 6186 | 52 | Sb | SAB(s)bc | |
| KIG 466 | UGC 06194 | 11 09 00.70 | +22 55 45.4 | 2643 | 26 | Sc | (R2′)SAB(s)c |
| KIG 489 | UGC 06568 | 11 35 36.88 | +00 07 38.6 | 5910 | 56 | Sbc | SA(s)c |
| KIG 491 | UGC 06608 | 11 38 33.25 | -01 11 05.2 | 6251 | 48 | Sc | SA(rs)bc |
| KIG 494 | 11 40 39.23 | +28 51 49.3 | 6825 | 24 | Sbc | SAB(s)c | |
| KIG 499 | UGC 06769 | 11 47 43.71 | +01 49 34.1 | 8537 | 62 | Sbc | SAB(r)b |
| KIG 502 | UGC 06780 | 11 48 50.37 | -02 01 57.5 | 1729 | 70 | Sbc | SA(s)c |
| KIG 508 | UGC 06854 | 11 52 43.45 | +01 44 27.0 | 6128 | 29 | Sbc | SAB(s)c |
| KIG 512 | UGC 06903 | 11 55 36.90 | +01 14 13.5 | 1892 | 28 | Sc | SB(s)c |
| KIG 515 | 11 58 36.22 | +18 51 47.6 | 6876 | 60 | Sbc | SAB(s)c | |
| KIG 520 | UGC 07144 | 12 09 45.08 | +56 31 26.8 | 7864 | 33 | Sc | SAB(rs)bc |
| KIG 522 | 12 15 40.77 | +61 53 22.6 | 6102 | 34 | Sb | SB(rs)b | |
| KIG 525 | UGC 07416 | 12 21 39.18 | +40 50 54.9 | 6901 | 22 | Sb | SB(r)b |
| KIG 532 | 12 31 34.55 | +37 58 47.9 | 7129 | 39 | Sb | SAB(rs)c | |
| KIG 550 | UGC 07917 / NGC 4662 | 12 44 26.17 | +37 07 17.1 | 6985 | 25 | Sbc | SB(r)b |
| KIG 553 | UGC 07987 / NGC 4719 | 12 50 08.69 | +33 09 33.0 | 7091 | 28 | Sb | SB(r)b |
| KIG 560 | 12 56 53.52 | +22 22 24.7 | 6529 | 38 | Sc | (R1′)SAB(s)c | |
| KIG 571 | UGC 08184 / NGC 4964 | 13 05 24.69 | +56 19 24.7 | 2520 | 54 | Sc | SA(s)c |
| KIG 575 | UGC 08279 / NGC 5016 | 13 12 06.63 | +24 05 42.2 | 2612 | 42 | Sb | SA(rs)c |
Table 1.–continued
| Galaxy | R.A.(J2000) | Dec.(J2000) | vr | i | Morphological Type | ||
| KIG name | UGC/NGC name | (hh mm ss.ss) | (+dd mm ss.s) | (km s-1) | (o) | oldi | revised |
| KIG 580 | 13 19 01.90 | +14 47 28.0 | 6643 | 57 | Sbc | SA(s)c | |
| KIG 598 | UGC 08705 | 13 46 32.29 | +20 50 51.3 | 6938 | 58 | Sc | SAB(s)bc |
| KIG 600 | 13 49 28.89 | +13 52 36.5 | 7228 | 41 | Sc | (R2′)SA(rs)c | |
| KIG 612 | UGC 09035 | 14 07 55.41 | +29 52 22.2 | 8244 | 28 | Sbc | SB(rs)b |
| KIG 626 | UGC 09201 / NGC 5584 | 14 22 23.67 | -00 23 14.1 | 1640 | 45 | Sc | SAB(s)c |
| KIG 630 | UGC 09248 / NGC 5622 | 14 26 12.18 | +48 33 50.4 | 3861 | 58 | Sb | SA(s)b |
| KIG 633 | 14 32 27.42 | +27 25 38.3 | 4298 | 29 | Sbc | SA(s)bc | |
| KIG 639 | 14 37 49.61 | +06 44 54.1 | 8659 | 52 | Sc | SA(s)c | |
| KIG 640 | 14 38 38.22 | +54 16 40.4 | 8790 | 24 | Sbc | SA(s)bc | |
| KIG 641 | UGC 09461 | 14 39 33.01 | +62 00 10.5 | 6728 | 45 | Sb | SB(r)b |
| KIG 645 | UGC 09516 | 14 45 48.85 | +50 23 38.5 | 4027 | 35 | Sc | (R2)SA(s)c |
| KIG 652 | UGC 09564 / NGC 5768 | 14 52 08.05 | -02 31 47.9 | 1962 | 27 | Sc | SAB(s)bc |
| KIG 665 | 15 12 24.98 | +18 38 47.7 | 6408 | 54 | Sb | SA(s)b | |
| KIG 671 | UGC 09826 | 15 21 33.05 | +39 12 04.3 | 8822 | 11 | Sb | SAB(rs)b |
| KIG 689 | 15 36 36.23 | +17 20 17.5 | 4292 | 58 | Sbc | SB(s)c | |
| KIG 712 | UGC 10083 / NGC 6012 | 15 54 13.74 | +14 36 06.9 | 1854 | 55 | Sbc | (R2)SA(r)b |
| KIG 716 | UGC 10104 | 15 57 27.86 | +30 03 34.6 | 9841 | 13 | Sc | SA(rs)bc |
| KIG 719 | UGC 10120 | 15 59 09.56 | +35 01 47.2 | 9438 | 22 | Sb | (R1′)SB(r)b |
| KIG 731 | 16 17 39.45 | +10 21 45.7 | 9817 | 46 | Sb | SAB(rs)bc | |
| KIG 743 | UGC 10435 | 16 31 21.62 | +22 41 49.3 | 7297 | 43 | Sb | SB(rs)b |
| KIG 754 | UGC 10490 | 16 38 49.56 | +17 21 11.6 | 4594 | 45 | Sc | SA(rs)b |
| KIG 757 | 16 39 30.75 | +21 19 02.2 | 9338 | 48 | Sbc | SAB(s)bc | |
| KIG 795 | UGC 10774 | 17 14 08.93 | +58 49 06.3 | 8873 | 53 | Sc | SAB(rs)bc |
| KIG 805 | UGC 10829 | 17 23 47.31 | +26 29 11.6 | 4730 | 51 | Sbc | SA(rs)bc |
| KIG 807 | 17 23 09.59 | +63 54 28.4 | 8228 | 57 | Sbc | SA(s)bc | |
| KIG 839 | 17 56 03.62 | +49 01 41.7 | 9458 | 45 | Sbc | SAB(s)c | |
| KIG 892 | 20 52 22.38 | +00 04 32.3 | 9087 | 36 | Sc | SA(rs)bc | |
| KIG 907 | 21 20 21.01 | +10 19 13.6 | 5257 | 55 | Sbc | SA(s)bc | |
| KIG 912 | 21 23 22.14 | +10 07 59.9 | 5122 | 53 | Sb | SA(rs)c | |
| KIG 924 | UGC 11790 | 21 41 29.92 | +00 53 40.8 | 4540 | 39 | Sc | SA(s)bc |
| KIG 928 | 21 45 54.72 | +11 40 41.5 | 6985 | 19 | Sc | SA(s)bc | |
| KIG 931 | UGC 11816 | 21 49 07.30 | +00 26 50.5 | 4750 | 0 | Sbc | (R2)SA(s)bc |
| KIG 932 | UGC 11817 / NGC 7138 | 21 49 01.10 | +12 30 51.9 | 8406 | 59 | Sbc | SB(r)b |
| KIG 943 | 22 04 12.67 | -00 01 52.5 | 9778 | 46 | Sb | (R1′)SB(rs)b | |
| KIG 250 | UGC 04393 | 08 26 04.51 | +45 58 06.0 | 2125 | 52 | Sc | SB(s)dm |
| KIG 291 | UGC 04684 | 08 56 40.68 | +00 22 29.6 | 2521 | 23 | Sc | SAB(rs)d |
| KIG 308 | 09 09 34.93 | +18 36 56.9 | 8487 | 12 | Sc | SA(s)ab | |
| KIG 392 | 10 03 23.21 | +48 21 56.6 | 7413 | 40 | Sbc | SAB(r)ab | |
Col.(1): KIG Name. Col.(2): UGC/NGC Name. Col.(3): Right Ascension (J2000). Col.(4): Declination(J2000). Col.(5): recession velocity (km s-1). Col.(6): Inclination in degrees. Col.(7): Morphological Type – Sulentic et al. (2006). Col.(8): Morphological Type - revised classification. The last four galaxies in this table (between horizontal lines) were excluded from our sample, because according to our revised classification they are not in the range Sb-Sc.
References.– (i) Sulentic et al. (2006)
| Galaxy | (g-i)o | Mi | a (kpc) | a (kpc) |
|---|---|---|---|---|
| KIG 11 | 0.61 | -20.80 | 14.7 | 15.6 |
| KIG 33 | 0.71 | -21.50 | 13.8 | 13.1 |
| KIG 56 | 0.99 | -21.53 | 17.3 | 14.7 |
| KIG 187 | 1.00 | -22.18 | 19.5 | 17.3 |
| KIG 198 | 1.15 | -22.09 | 19.2 | 15.6 |
| KIG 203 | 0.70 | -21.09 | 13.9 | 12.0 |
| KIG 217 | 0.85 | -20.61 | 10.0 | 9.3 |
| KIG 222 | 1.01 | -21.40 | 13.3 | 11.4 |
| KIG 232 | 1.09 | -21.98 | 19.6 | 17.7 |
| KIG 238 | 0.93 | -21.30 | 17.2 | 13.0 |
| KIG 241 | 0.52 | -20.16 | 7.3 | 6.8 |
| KIG 242 | 0.41 | -19.36 | 5.9 | 5.7 |
| KIG 258 | 0.76 | -20.53 | 9.8 | 8.2 |
| KIG 260 | 0.77 | -21.57 | 18.7 | 17.7 |
| KIG 271 | 0.79 | -22.16 | 20.5 | 18.3 |
| KIG 281 | 0.91 | -21.32 | 15.5 | 14.3 |
| KIG 282 | 0.93 | -21.20 | 11.2 | 8.9 |
| KIG 287 | 0.90 | -21.79 | 16.8 | 16.0 |
| KIG 292 | 0.72 | -20.79 | 10.9 | 10.7 |
| KIG 298 | 1.14 | -22.55 | 18.4 | 17.9 |
| KIG 302 | 0.87 | -22.34 | 17.4 | 14.3 |
| KIG 314 | 0.68 | -21.60 | 16.3 | 14.5 |
| KIG 325 | 0.82 | -21.67 | 13.9 | 13.4 |
| KIG 328 | 0.83 | -21.53 | 13.6 | 12.2 |
| KIG 330 | 0.66 | -19.92 | 7.0 | 6.3 |
| KIG 336 | 1.07 | -22.21 | 18.9 | 17.4 |
| KIG 339 | 0.94 | -21.78 | 18.8 | 21.6 |
| KIG 351 | 0.92 | -20.74 | 12.7 | 11.5 |
| KIG 365 | 0.73 | -21.44 | 13.0 | 11.8 |
| KIG 366 | 1.11 | -21.88 | 16.2 | 14.4 |
| KIG 367 | 0.69 | -20.89 | 13.6 | 13.3 |
| KIG 368 | 0.69 | -21.90 | 16.0 | 15.2 |
| KIG 386 | 0.82 | -21.38 | 11.5 | 10.1 |
| KIG 397 | 0.82 | -20.53 | 8.5 | 5.9 |
| KIG 399 | 0.77 | -21.35 | 13.5 | 11.8 |
| KIG 401 | 0.87 | -21.57 | 15.4 | 14.3 |
| KIG 405 | 0.73 | -20.62 | 11.9 | 10.7 |
| KIG 406 | 0.94 | -21.61 | 15.4 | 11.6 |
| KIG 409 | 0.52 | -20.18 | 7.6 | 7.1 |
| KIG 410 | 0.52 | -21.01 | 10.1 | 9.2 |
| KIG 429 | 0.88 | -21.68 | 15.1 | 13.7 |
| KIG 444 | 0.82 | -21.29 | 8.5 | 7.7 |
| KIG 446 | 0.80 | -21.97 | 15.1 | 13.6 |
| KIG 460 | 0.37 | -20.12 | 7.9 | 8.5 |
| KIG 466 | 0.50 | -19.37 | 6.4 | 6.6 |
| KIG 489 | 0.58 | -21.07 | 10.8 | 10.4 |
| KIG 491 | 0.85 | -21.72 | 13.9 | 11.5 |
| KIG 494 | 0.55 | -20.74 | 10.3 | 10.4 |
| KIG 499 | 0.94 | -22.40 | 21.9 | 20.1 |
| KIG 502 | 0.18 | -19.24 | 11.2 | 11.0 |
| KIG 508 | 0.56 | -20.84 | 9.4 | 9.4 |
| KIG 512 | 0.65 | -19.70 | 9.6 | 9.0 |
| KIG 515 | 0.68 | -21.39 | 12.3 | 11.6 |
| KIG 520 | 1.02 | -22.20 | 17.7 | 16.7 |
| KIG 522 | 0.56 | -20.73 | 7.6 | 6.1 |
| KIG 525 | 1.06 | -22.01 | 20.8 | 18.0 |
| KIG 532 | 0.59 | -20.66 | 9.6 | 9.3 |
| KIG 550 | 1.13 | -22.97 | 26.2 | 23.6 |
| KIG 553 | 0.88 | -22.07 | 18.8 | 17.0 |
| KIG 560 | 0.30 | -20.08 | 7.0 | 6.6 |
| KIG 571 | 0.65 | -19.70 | 6.5 | 5.7 |
| KIG 575 | 0.78 | -20.77 | 9.7 | 9.0 |
Table 2.–continued
| Galaxy | (g-i)o | Mi | a (kpc) | a (kpc) |
|---|---|---|---|---|
| KIG 580 | 0.63 | -20.93 | 10.9 | 9.5 |
| KIG 598 | 0.72 | -22.18 | 13.5 | 12.7 |
| KIG 600 | 0.57 | -19.94 | 8.4 | 8.3 |
| KIG 612 | 1.05 | -21.64 | 16.8 | 15.2 |
| KIG 626 | 0.38 | -20.53 | 11.9 | 11.3 |
| KIG 630 | 0.76 | -21.04 | 12.1 | 11.7 |
| KIG 633 | 0.49 | -20.02 | 5.1 | 4.5 |
| KIG 639 | 0.63 | -21.07 | 12.2 | 11.0 |
| KIG 640 | 0.68 | -21.13 | 9.2 | 7.1 |
| KIG 641 | 1.03 | -21.78 | 14.1 | 12.4 |
| KIG 645 | 0.76 | -20.44 | 8.9 | 8.5 |
| KIG 652 | 0.67 | -20.35 | 8.0 | 7.5 |
| KIG 665 | 0.71 | -21.03 | 11.9 | 11.0 |
| KIG 671 | 0.92 | -21.41 | 16.4 | 14.6 |
| KIG 689 | 0.39 | -19.90 | 8.5 | 7.1 |
| KIG 712 | 0.58 | -21.04 | 14.3 | 11.7 |
| KIG 716 | 0.74 | -23.00 | 44.1 | 31.7 |
| KIG 719 | 0.79 | -21.91 | 15.3 | 14.9 |
| KIG 731 | 0.76 | -21.41 | 13.2 | 12.4 |
| KIG 743 | 0.94 | -21.59 | 12.7 | 11.8 |
| KIG 754 | 0.59 | -19.98 | 9.6 | 8.5 |
| KIG 757 | 0.69 | -22.16 | 16.1 | 15.4 |
| KIG 795 | 0.90 | -21.85 | 15.7 | 15.1 |
| KIG 805 | 0.83 | -21.33 | 13.7 | 13.2 |
| KIG 807 | 0.76 | -21.54 | 12.3 | 10.5 |
| KIG 839 | 0.75 | -21.50 | 11.8 | 10.8 |
| KIG 892 | 0.99 | -22.59 | 17.1 | 14.7 |
| KIG 907 | 0.40 | -19.66 | 7.7 | 7.3 |
| KIG 912 | 0.65 | -20.40 | 8.2 | 8.0 |
| KIG 924 | 0.76 | -21.03 | 14.6 | 13.0 |
| KIG 928 | 0.66 | -20.30 | 6.6 | 5.5 |
| KIG 931 | 0.88 | -20.67 | 10.2 | 8.8 |
| KIG 932 | 1.00 | -22.81 | 22.0 | 19.4 |
| KIG 943 | 0.70 | -21.81 | 14.2 | 12.3 |
Col.(1): Galaxy Name. Col.(2): (g-i) color corrected for Galactic, internal extinction as well as K-corrected. Col.(3): Absolute magnitude in i-band. Col.(4): Semimajor axis of =25 mag arcsec-2 isophote. Col.(5): Semimajor axis of =25 mag arcsec-2 isophote.
| Type | Mi | (g-i)o | a (kpc) | a (kpc) |
|---|---|---|---|---|
| meanSE median | meanSE median | meanSE median | meanSE median | |
| Sb | -21.520.14 -21.49 | 0.890.03 0.92 | 15.50.9 14.8 | 13.80.8 12.7 |
| Sbc | -21.250.15 -21.38 | 0.760.03 0.80 | 12.30.7 13.5 | 11.20.7 11.8 |
| Sc | -20.920.13 -20.91 | 0.670.03 0.68 | 12.20.7 11.8 | 11.10.6 10.7 |
| Sb-Sc | -21.200.08 -21.33 | 0.760.02 0.76 | 13.10.4 13.2 | 11.90.4 11.7 |
Note: SE is standard deviation of the mean.
Col.(1): Morphological Type. Col.(2): Absolute Magnitude in i-band. Col.(3): (g-i) color corrected for Galactic, internal extinction as well as K-corrected. Col.(4): Semimajor axis of =25 mag arcsec-2 isophote. Col.(5): Semimajor axis of =25 mag arcsec-2 isophote.
| (1) | (2) | (3) | (4) | (5) | (6) | (7) | (8) | (9) | (10) | (11) | (12) |
| Galaxy | re | nbulge | hR | lbar | nbar | ||||||
| (″) | () | (″) | () | (″) | |||||||
| KIG 11 | 0.294 | 0.706 | 0.416 | 9.66 | 21.05 | 1.14 | 142.12 | 23.15 | |||
| KIG 33 | 0.349 | 0.651 | 0.536 | 5.71 | 20.04 | 1.17 | 16.08 | 20.33 | |||
| KIG 56 | 0.160 | 0.714 | 0.126 | 0.224 | 1.69 | 18.32 | 1.75 | 16.68 | 20.62 | 19.01 | 0.60 |
| KIG 187 | 0.072 | 0.865 | 0.063 | 0.083 | 1.66 | 20.22 | 2.33 | 13.54 | 20.80 | 9.11 | 0.68 |
| KIG 198 | 0.038 | 0.671 | 0.292 | 0.056 | 1.31 | 19.75 | 0.77 | 37.94 | 22.84 | 15.92 | 0.65 |
| KIG 203 | 0.012 | 0.988 | 0.013 | 0.72 | 21.00 | 1.00 | 6.94 | 19.88 | |||
| KIG 217 | 0.040 | 0.960 | 0.042 | 2.09 | 20.54 | 2.55 | 15.77 | 20.36 | |||
| KIG 222 | 0.038 | 0.927 | 0.035 | 0.041 | 1.51 | 19.91 | 0.76 | 11.81 | 20.31 | 13.46 | 0.57 |
| KIG 232 | 0.096 | 0.904 | 0.106 | 2.53 | 19.33 | 2.76 | 15.81 | 19.89 | |||
| KIG 238 | 0.150 | 0.688 | 0.163 | 0.217 | 1.48 | 19.44 | 1.97 | 19.87 | 22.19 | 11.88 | 0.59 |
| KIG 241 | 0.010 | 0.990 | 0.010 | 1.04 | 20.92 | 0.37 | 5.18 | 19.66 | |||
| KIG 242 | 0.165 | 0.835 | 0.197 | 1.97 | 20.26 | 0.70 | 4.13 | 19.72 | |||
| KIG 258 | 0.204 | 0.766 | 0.030 | 0.267 | 1.32 | 19.66 | 2.90 | 8.26 | 20.55 | 8.71 | 1.05 |
| KIG 260 | 0.020 | 0.949 | 0.031 | 0.021 | 1.84 | 21.08 | 1.93 | 14.92 | 20.77 | 9.90 | 0.60 |
| KIG 271 | 0.020 | 0.964 | 0.016 | 0.020 | 1.36 | 20.85 | 2.09 | 11.45 | 20.01 | 7.92 | 0.62 |
| KIG 281 | 0.024 | 0.976 | 0.024 | 1.80 | 20.04 | 1.07 | 15.86 | 20.04 | |||
| KIG 282 | 0.047 | 0.907 | 0.046 | 0.051 | 1.32 | 20.48 | 1.55 | 4.42 | 19.48 | 8.51 | 0.76 |
| KIG 287 | 0.153 | 0.804 | 0.044 | 0.190 | 2.33 | 20.34 | 1.66 | 7.80 | 19.99 | 7.79 | 0.78 |
| KIG 292 | 0.173 | 0.827 | 0.209 | 4.91 | 19.73 | 3.24 | 21.41 | 19.66 | |||
| KIG 298 | 0.123 | 0.805 | 0.071 | 0.153 | 2.04 | 18.81 | 1.78 | 19.38 | 20.52 | 19.80 | 0.70 |
| KIG 302 | 0.103 | 0.897 | 0.115 | 1.93 | 19.78 | 1.03 | 6.33 | 19.05 | |||
| KIG 314 | 0.075 | 0.925 | 0.081 | 3.31 | 19.46 | 1.64 | 17.79 | 19.52 | |||
| KIG 325 | 0.083 | 0.917 | 0.091 | 1.78 | 20.07 | 1.10 | 8.69 | 20.15 | |||
| KIG 328 | 0.045 | 0.950 | 0.005 | 0.047 | 1.21 | 19.42 | 0.62 | 7.27 | 19.34 | 12.28 | 0.53 |
| KIG 330 | 0.026 | 0.974 | 0.026 | 1.37 | 20.35 | 0.43 | 7.12 | 19.93 | |||
| KIG 336 | 0.213 | 0.662 | 0.125 | 0.322 | 2.87 | 19.47 | 2.09 | 26.79 | 21.79 | 22.18 | 0.50 |
| KIG 339 | 0.299 | 0.564 | 0.137 | 0.531 | 2.37 | 18.92 | 2.60 | 54.07 | 22.91 | 21.78 | 0.48 |
| KIG 351 | 0.031 | 0.867 | 0.102 | 0.036 | 1.16 | 20.11 | 0.34 | 11.83 | 20.97 | 11.09 | 0.53 |
| KIG 365 | 0.051 | 0.898 | 0.051 | 0.057 | 1.11 | 19.52 | 0.90 | 7.81 | 20.37 | 10.30 | 0.76 |
| KIG 366 | 0.081 | 0.779 | 0.140 | 0.104 | 1.50 | 19.44 | 1.90 | 9.53 | 19.70 | 16.24 | 0.82 |
| KIG 367 | 0.216 | 0.784 | 0.276 | 7.08 | 22.04 | 1.55 | 58.30 | 23.19 | |||
| KIG 368 | 0.061 | 0.939 | 0.065 | 1.24 | 19.91 | 1.10 | 7.42 | 20.11 | |||
| KIG 386 | 0.025 | 0.962 | 0.014 | 0.026 | 0.84 | 19.75 | 0.66 | 5.73 | 19.24 | 6.53 | 0.47 |
| KIG 397 | 0.060 | 0.930 | 0.010 | 0.064 | 1.92 | 19.61 | 1.56 | 7.65 | 18.76 | 5.94 | 0.60 |
| KIG 399 | 0.042 | 0.958 | 0.044 | 1.50 | 20.14 | 1.46 | 9.25 | 19.83 | |||
| KIG 401 | 0.007 | 0.969 | 0.024 | 0.008 | 0.83 | 20.59 | 0.60 | 9.69 | 19.77 | 4.99 | 0.70 |
| KIG 405 | 0.056 | 0.944 | 0.059 | 1.99 | 20.79 | 1.13 | 19.29 | 21.74 | |||
| KIG 406 | 0.209 | 0.791 | 0.263 | 3.41 | 21.25 | 1.08 | 7.53 | 20.47 | |||
| KIG 409 | 0.004 | 0.962 | 0.034 | 0.004 | 1.00 | 21.85 | 0.40 | 4.54 | 19.62 | 4.75 | 0.62 |
| KIG 410 | 0.065 | 0.935 | 0.070 | 1.22 | 19.36 | 0.63 | 6.06 | 19.63 | |||
| KIG 429 | 0.014 | 0.982 | 0.004 | 0.014 | 1.07 | 21.14 | 0.73 | 7.81 | 20.04 | 4.95 | 0.58 |
| KIG 444 | 0.024 | 0.961 | 0.015 | 0.025 | 1.57 | 19.82 | 1.23 | 6.23 | 18.52 | 10.10 | 0.65 |
| KIG 446 | 0.064 | 0.936 | 0.069 | 1.16 | 19.64 | 0.84 | 5.10 | 18.83 | |||
| KIG 460 | 0.053 | 0.947 | 0.056 | 1.83 | 20.83 | 0.54 | 5.00 | 19.48 | |||
| KIG 466 | 0.243 | 0.726 | 0.032 | 0.334 | 8.54 | 21.64 | 0.66 | 29.30 | 22.07 | 14.14 | 0.77 |
| KIG 489 | 0.017 | 0.983 | 0.017 | 1.19 | 20.20 | 0.48 | 7.25 | 19.35 | |||
| KIG 491 | 0.076 | 0.924 | 0.083 | 1.60 | 19.76 | 1.66 | 7.45 | 19.28 | |||
| KIG 494 | 0.040 | 0.916 | 0.044 | 0.044 | 2.07 | 21.35 | 0.69 | 7.28 | 20.25 | 6.66 | 0.50 |
| KIG 499 | 0.045 | 0.840 | 0.115 | 0.054 | 0.99 | 19.61 | 2.10 | 12.81 | 20.23 | 7.07 | 0.69 |
| KIG 502 | 0.085 | 0.915 | 0.093 | 8.98 | 21.87 | 1.45 | 337.49 | 23.34 | |||
| KIG 508 | 0.031 | 0.912 | 0.057 | 0.034 | 1.19 | 19.70 | 1.41 | 11.00 | 20.61 | 5.94 | 0.70 |
| KIG 512 | 0.016 | 0.951 | 0.033 | 0.017 | 3.93 | 21.45 | 1.50 | 38.30 | 21.74 | 19.80 | 0.62 |
| KIG 515 | 0.044 | 0.952 | 0.003 | 0.046 | 2.43 | 20.96 | 0.88 | 7.13 | 19.42 | 5.15 | 1.37 |
| KIG 520 | 0.094 | 0.866 | 0.040 | 0.109 | 1.94 | 19.87 | 1.97 | 8.38 | 19.60 | 8.17 | 0.71 |
| KIG 522 | 0.123 | 0.742 | 0.135 | 0.166 | 0.77 | 18.76 | 2.50 | 4.02 | 19.16 | 7.92 | 0.50 |
| KIG 525 | 0.150 | 0.795 | 0.055 | 0.189 | 2.04 | 19.08 | 2.69 | 14.67 | 20.50 | 13.07 | 0.91 |
| KIG 532 | 0.040 | 0.844 | 0.116 | 0.048 | 1.54 | 19.80 | 0.51 | 5.89 | 20.02 | 6.34 | 0.85 |
| KIG 550 | 0.066 | 0.879 | 0.055 | 0.075 | 1.96 | 18.98 | 1.32 | 19.67 | 20.43 | 15.84 | 0.63 |
| KIG 553 | 0.331 | 0.557 | 0.112 | 0.593 | 2.82 | 18.76 | 3.38 | 68.00 | 22.99 | 24.95 | 0.45 |
| KIG 560 | 0.143 | 0.857 | 0.166 | 1.76 | 20.24 | 0.65 | 4.04 | 19.79 | |||
| KIG 571 | 0.031 | 0.969 | 0.032 | 2.53 | 21.50 | 1.22 | 9.06 | 19.41 |
Table 4.–continued
| (1) | (2) | (3) | (4) | (5) | (6) | (7) | (8) | (9) | (10) | (11) | (12) |
| Galaxy | re | nbulge | hR | lbar | nbar | ||||||
| (″) | () | (″) | () | (″) | |||||||
| KIG 575 | 0.038 | 0.962 | 0.040 | 2.57 | 20.42 | 1.50 | 11.73 | 19.08 | |||
| KIG 580 | 0.052 | 0.948 | 0.055 | 1.13 | 20.36 | 1.45 | 5.71 | 19.42 | |||
| KIG 598 | 0.052 | 0.937 | 0.011 | 0.055 | 1.36 | 19.50 | 1.96 | 10.33 | 19.48 | 11.88 | 0.74 |
| KIG 612 | 0.153 | 0.768 | 0.079 | 0.199 | 1.63 | 19.35 | 2.22 | 15.76 | 21.32 | 13.88 | 0.44 |
| KIG 626 | 0.004 | 0.982 | 0.014 | 0.004 | 1.47 | 20.71 | 1.60 | 34.42 | 20.64 | 9.90 | 0.67 |
| KIG 630 | 0.061 | 0.939 | 0.065 | 2.56 | 20.24 | 0.86 | 12.71 | 19.69 | |||
| KIG 633 | 0.052 | 0.948 | 0.055 | 1.03 | 19.31 | 0.39 | 3.41 | 18.48 | |||
| KIG 639 | 0.033 | 0.967 | 0.034 | 0.80 | 20.27 | 1.02 | 5.25 | 19.71 | |||
| KIG 640 | 0.099 | 0.901 | 0.110 | 0.93 | 19.24 | 0.97 | 2.14 | 18.05 | |||
| KIG 641 | 0.141 | 0.801 | 0.058 | 0.176 | 1.50 | 18.76 | 1.74 | 10.33 | 19.97 | 11.88 | 0.72 |
| KIG 645 | 0.111 | 0.889 | 0.124 | 3.23 | 20.81 | 1.49 | 14.35 | 20.71 | |||
| KIG 652 | 0.029 | 0.940 | 0.031 | 0.031 | 1.17 | 19.03 | 1.84 | 12.09 | 19.39 | 8.32 | 1.19 |
| KIG 665 | 0.086 | 0.914 | 0.094 | 1.90 | 20.56 | 0.98 | 6.73 | 19.70 | |||
| KIG 671 | 0.110 | 0.648 | 0.218 | 0.169 | 1.27 | 18.65 | 0.76 | 34.38 | 22.74 | 14.54 | 0.50 |
| KIG 689 | 0.067 | 0.933 | 0.072 | 4.04 | 21.64 | 1.02 | 8.51 | 20.22 | |||
| KIG 712 | 0.059 | 0.941 | 0.062 | 5.06 | 20.72 | 1.05 | 22.06 | 19.65 | |||
| KIG 716 | 0.175 | 0.825 | 0.212 | 3.51 | 20.28 | 3.16 | 39.34 | 22.28 | |||
| KIG 719 | 0.121 | 0.679 | 0.153 | 0.186 | 1.27 | 18.84 | 1.28 | 14.88 | 21.42 | 14.26 | 0.63 |
| KIG 731 | 0.040 | 0.885 | 0.075 | 0.045 | 0.81 | 19.91 | 0.94 | 5.96 | 20.16 | 7.92 | 0.31 |
| KIG 743 | 0.056 | 0.865 | 0.079 | 0.064 | 1.32 | 20.23 | 2.11 | 14.10 | 21.10 | 13.46 | 0.30 |
| KIG 757 | 0.074 | 0.847 | 0.079 | 0.088 | 1.16 | 19.48 | 2.24 | 7.29 | 19.61 | 11.29 | 0.79 |
| KIG 795 | 0.046 | 0.954 | 0.048 | 1.45 | 20.61 | 1.53 | 9.12 | 19.99 | |||
| KIG 805 | 0.041 | 0.959 | 0.042 | 1.39 | 19.99 | 2.09 | 11.90 | 19.77 | |||
| KIG 807 | 0.022 | 0.978 | 0.023 | 1.02 | 20.03 | 0.70 | 5.07 | 19.01 | |||
| KIG 839 | 0.011 | 0.979 | 0.010 | 0.012 | 0.57 | 20.63 | 1.00 | 4.74 | 19.70 | 3.96 | 0.60 |
| KIG 892 | 0.161 | 0.839 | 0.192 | 2.39 | 19.72 | 1.53 | 8.23 | 19.75 | |||
| KIG 907 | 0.303 | 0.697 | 0.435 | 4.93 | 21.49 | 0.87 | 71.95 | 23.46 | |||
| KIG 912 | 0.039 | 0.961 | 0.041 | 1.26 | 20.89 | 1.39 | 5.18 | 19.22 | |||
| KIG 924 | 0.018 | 0.982 | 0.018 | 1.63 | 20.63 | 0.60 | 17.81 | 20.95 | |||
| KIG 928 | 0.289 | 0.711 | 0.406 | 1.63 | 19.93 | 1.17 | 2.45 | 19.14 | |||
| KIG 931 | 0.120 | 0.880 | 0.137 | 5.12 | 21.33 | 1.75 | 16.36 | 21.29 | |||
| KIG 932 | 0.075 | 0.886 | 0.039 | 0.084 | 1.87 | 19.83 | 2.05 | 8.93 | 19.13 | 10.27 | 0.78 |
| KIG 943 | 0.102 | 0.475 | 0.423 | 0.215 | 0.64 | 18.46 | 2.00 | 9.43 | 21.22 | 7.52 | 1.25 |
Col.(1): Galaxy Name. Col.(2): Bulge/Total luminosity ratio. Col.(3): Disk/Total luminosity ratio. Col.(4): Bar/Total luminosity ratio. Col.(5): Bulge/Disk luminosity ratio. Col.(6): effective radius of the bulge in arcsec. Col.(7): effective surface brightness of the bulge in mag arcsec-2. Col.(8): Sérsic index of the bulge. Col.(9): disk scalelength in arcsec. Col.(10): central surface brightness of the disk in mag arcsec-2. Col.(11): bar length, i.e. semimajor axis of the bar in arcsec. Col.(12): Sérsic index of the bar.
| Type (N) | Bulge/Total | nbulge | re (kpc) | hR (kpc) | ||
|---|---|---|---|---|---|---|
| meanSE median | meanSE median | meanSE median | meanSE median | meanSE median | meanSE median | |
| Sb (25) | 0.120.01 0.11 | 1.790.17 1.90 | 0.730.05 0.64 | 19.240.13 19.30 | 7.401.27 5.56 | 20.470.21 20.34 |
| Sbc (34) | 0.090.01 0.06 | 1.350.13 1.32 | 0.740.08 0.60 | 19.890.12 19.85 | 5.231.11 3.65 | 19.770.19 19.52 |
| Sc (35) | 0.080.01 0.04 | 1.180.08 1.13 | 0.790.10 0.65 | 20.480.12 20.60 | 6.741.58 3.59 | 20.210.21 19.84 |
| Sb-Sc (94) | 0.090.01 0.06 | 1.400.07 1.30 | 0.760.05 0.64 | 19.940.09 19.90 | 6.370.79 4.07 | 20.110.12 19.80 |
Col.(1): Galaxy Name. Col.(2): Bulge/Total luminosity ratio. Col.(3): Sérsic index of the bulge. Col.(4): effective radius of the bulge in kpc. Col.(5): effective surface brightness of the bulge in mag arcsec-2. Col.(6): disk scalelength in kpc. Col.(7): central surface brightness of the disk in mag arcsec-2.
Note: N=number of galaxies; SE is standard deviation of the mean.
Table 6a. Mean/Median for Structural Parameters of Bulges, Disks and Bars of Barred Galaxies
| Type (N) | Bulge/Total | nbulge | re (kpc) | hR (kpc) | lbar (kpc) | ||
|---|---|---|---|---|---|---|---|
| meanSE median | meanSE median | meanSE median | meanSE median | meanSE median | meanSE median | meanSE median | |
| Sb (21) | 0.120.02 0.12 | 1.840.16 1.97 | 0.740.06 0.65 | 19.060.12 19.19 | 8.291.44 6.55 | 20.640.23 20.38 | 6.480.51 6.33 |
| Sbc (13) | 0.080.02 0.05 | 1.560.20 1.66 | 0.660.09 0.61 | 19.750.22 19.66 | 5.331.81 4.03 | 19.720.28 19.45 | 4.390.72 4.79 |
| Sc (14) | 0.040.02 0.02 | 1.120.14 0.94 | 0.660.09 0.64 | 20.450.20 20.60 | 5.261.44 4.00 | 20.250.31 19.99 | 3.230.55 2.90 |
| Sb-Sc (48) | 0.090.01 0.05 | 1.550.10 1.63 | 0.700.04 0.65 | 19.650.13 19.51 | 6.600.91 4.54 | 20.280.16 20.09 | 4.970.39 4.78 |
Col.(1): Galaxy Name. Col.(2): Bulge/Total luminosity ratio. Col.(3): Sérsic index of the bulge. Col.(4): effective radius of the bulge in kpc. Col.(5): effective surface brightness of the bulge in mag arcsec-2. Col.(6): disk scalelength in kpc. Col.(7): central surface brightness of the disk in mag arcsec-2. Col.(8): bar length, i.e. semimajor axis of the bar in kpc.
Note: N=number of galaxies; SE is standard deviation of the mean; Barred galaxies are those galaxies for which BUDDA returned a non-zero bar contribution.
Table 6b. Mean/Median for Structural Parameters of Bulges, Disks and Bars of Non-Barred Galaxies
| Type (N) | Bulge/Total | nbulge | re (kpc) | hR (kpc) | ||
|---|---|---|---|---|---|---|
| meanSE median | meanSE median | meanSE median | meanSE median | meanSE median | meanSE median | |
| Sb (4) | 0.100.03 0.07 | 1.530.57 1.01 | 0.660.05 0.63 | 20.200.20 20.25 | 2.780.14 2.72 | 19.560.02 19.57 |
| Sbc (21) | 0.090.02 0.06 | 1.230.16 1.07 | 0.790.11 0.59 | 19.980.13 19.91 | 5.181.45 3.57 | 19.800.27 19.60 |
| Sc (21) | 0.100.02 0.07 | 1.220.10 1.14 | 0.880.16 0.74 | 20.500.16 20.63 | 7.742.47 3.57 | 20.190.30 19.65 |
| Sb-Sc (46) | 0.100.01 0.06 | 1.250.10 1.10 | 0.820.09 0.62 | 20.240.10 20.12 | 6.141.31 3.09 | 19.960.18 19.59 |
Note: N=number of galaxies; SE is standard deviation of the mean. Columns have the same designations like in Table 6a.
| Type | a/hR | lbar/a | lbar/hR |
|---|---|---|---|
| meanSE median | meanSE median | meanSE median | |
| Sb | 2.90.3 3.0 | 0.400.03 0.37 | 0.980.08 0.96 |
| Sbc | 3.90.3 3.8 | 0.300.04 0.26 | 1.060.13 1.00 |
| Sc | 3.30.2 3.6 | 0.260.03 0.25 | 0.750.09 0.68 |
| Sb-Sc | 3.40.1 3.5 | 0.340.02 0.34 | 0.930.06 0.90 |
Note: SE is standard deviation of the mean.
Col.(1): Morphological Type. Col.(2): Semimajor axis of =25 mag arcsec-2 isophote normalized by the disk radial scalelength hR. Col(3): semimajor axis of the bar normalized by the semimajor axis of =25 mag arcsec-2 isophote. Col.(4): semimajor axis of the bar normalized by disk radial scalelength hR.
Table 8a. Mean/Median for re/hR
| Type | all | barred | non-barred |
|---|---|---|---|
| meanSE median | meanSE median | meanSE median | |
| Sb | 0.130.01 0.11 | 0.110.01 0.10 | 0.240.02 0.23 |
| Sbc | 0.220.02 0.20 | 0.170.02 0.16 | 0.240.04 0.20 |
| Sc | 0.200.02 0.17 | 0.170.03 0.13 | 0.220.03 0.20 |
| Sb-Sc | 0.190.01 0.16 | 0.150.01 0.13 | 0.230.02 0.20 |
Note: SE is standard deviation of the mean.
Table 8b. Mean/Median for re/hR for Bulge/Total less than and larger than 0.1
| Type | Bulge/Total0.1 | Bulge/Total0.1 | ||||
|---|---|---|---|---|---|---|
| all | barred | non-barred | all | barred | non-barred | |
| meanSE median | meanSE median | meanSE median | meanSE median | meanSE median | meanSE median | |
| Sb | 0.160.02 0.14 | 0.130.02 0.11 | 0.240.02 0.23 | 0.110.02 0.10 | 0.100.01 0.10 | 0.23 |
| Sbc | 0.190.02 0.18 | 0.170.02 0.16 | 0.210.03 0.20 | 0.280.08 0.29 | 0.170.13 0.17 | 0.320.01 0.30 |
| Sc | 0.180.02 0.16 | 0.160.03 0.12 | 0.190.03 0.18 | 0.280.05 0.30 | 0.29 | 0.280.06 0.31 |
| Sb-Sc | 0.180.01 0.16 | 0.160.01 0.13 | 0.200.02 0.20 | 0.200.03 0.14 | 0.130.02 0.10 | 0.290.05 0.30 |
Note: SE is standard deviation of the mean.
| Galaxy | C | A | S |
|---|---|---|---|
| KIG 11 | 3.39 | 0.05 | 0.27 |
| KIG 33 | 3.04 | 0.12 | 0.22 |
| KIG 56 | 4.18 | 0.07 | 0.26 |
| KIG 187 | 3.22 | 0.04 | 0.20 |
| KIG 198 | 3.19 | 0.08 | 0.21 |
| KIG 203 | 2.63 | 0.02 | 0.20 |
| KIG 217 | 2.52 | 0.08 | 0.15 |
| KIG 222 | 2.57 | 0.06 | 0.15 |
| KIG 232 | 3.06 | 0.28 | 0.23 |
| KIG 238 | 4.25 | 0.07 | 0.28 |
| KIG 241 | 2.44 | 0.11 | 0.15 |
| KIG 242 | 3.19 | 0.05 | 0.20 |
| KIG 258 | 3.77 | 0.12 | 0.19 |
| KIG 260 | 2.86 | 0.11 | 0.22 |
| KIG 271 | 2.71 | 0.08 | 0.18 |
| KIG 281 | 2.42 | 0.05 | 0.14 |
| KIG 282 | 2.95 | 0.17 | 0.23 |
| KIG 287 | 3.53 | 0.07 | 0.30 |
| KIG 292 | 3.18 | 0.08 | 0.19 |
| KIG 298 | 3.69 | 0.07 | 0.22 |
| KIG 302 | 2.89 | 0.26 | 0.17 |
| KIG 314 | 3.22 | 0.09 | 0.26 |
| KIG 325 | 2.94 | 0.08 | 0.21 |
| KIG 328 | 2.61 | 0.11 | 0.16 |
| KIG 330 | 2.45 | 0.13 | 0.15 |
| KIG 336 | 3.96 | 0.04 | 0.24 |
| KIG 339 | 5.70 | 0.04 | 0.29 |
| KIG 351 | 2.79 | 0.05 | 0.21 |
| KIG 365 | 2.58 | 0.14 | 0.16 |
| KIG 366 | 3.45 | 0.05 | 0.26 |
| KIG 367 | 3.10 | 0.06 | 0.22 |
| KIG 368 | 2.79 | 0.10 | 0.21 |
| KIG 386 | 2.56 | 0.18 | 0.20 |
| KIG 397 | 2.83 | 0.19 | 0.21 |
| KIG 399 | 2.68 | 0.13 | 0.20 |
| KIG 401 | 2.61 | 0.03 | 0.16 |
| KIG 405 | 2.51 | 0.03 | 0.15 |
| KIG 406 | 2.61 | 0.10 | 0.14 |
| KIG 409 | 2.47 | 0.11 | 0.17 |
| KIG 410 | 2.76 | 0.28 | 0.20 |
| KIG 429 | 2.41 | 0.06 | 0.16 |
| KIG 444 | 2.62 | 0.28 | 0.15 |
| KIG 446 | 2.82 | 0.07 | 0.25 |
| KIG 460 | 2.96 | 0.07 | 0.18 |
| KIG 466 | 3.01 | 0.23 | 0.12 |
| KIG 489 | 2.65 | 0.17 | 0.18 |
| KIG 491 | 2.95 | 0.07 | 0.26 |
| KIG 494 | 2.82 | 0.16 | 0.20 |
| KIG 499 | 3.70 | 0.05 | 0.22 |
| KIG 502 | 3.71 | 0.01 | 0.27 |
| KIG 508 | 2.88 | 0.19 | 0.17 |
| KIG 512 | 2.47 | 0.00 | 0.16 |
| KIG 515 | 2.84 | 0.08 | 0.22 |
| KIG 520 | 3.34 | 0.07 | 0.24 |
| KIG 522 | 3.06 | 0.04 | 0.14 |
| KIG 525 | 3.88 | 0.08 | 0.24 |
| KIG 532 | 3.04 | 0.18 | 0.18 |
| KIG 550 | 3.14 | 0.07 | 0.19 |
| KIG 553 | 4.90 | 0.03 | 0.34 |
| KIG 560 | 3.20 | 0.09 | 0.25 |
| KIG 571 | 2.70 | 0.10 | 0.19 |
Table 9.–continued
| Galaxy | C | A | S |
|---|---|---|---|
| KIG 575 | 3.00 | 0.08 | 0.25 |
| KIG 580 | 2.79 | 0.08 | 0.16 |
| KIG 598 | 2.80 | 0.12 | 0.18 |
| KIG 600 | 2.94 | 0.04 | 0.20 |
| KIG 612 | 4.04 | 0.05 | 0.24 |
| KIG 626 | 2.42 | 0.08 | 0.17 |
| KIG 630 | 3.03 | 0.10 | 0.26 |
| KIG 633 | 2.74 | 0.20 | 0.23 |
| KIG 639 | 2.66 | 0.06 | 0.18 |
| KIG 640 | 2.97 | 0.10 | 0.22 |
| KIG 641 | 3.74 | 0.05 | 0.25 |
| KIG 645 | 2.85 | 0.06 | 0.20 |
| KIG 652 | 2.86 | 0.13 | 0.17 |
| KIG 665 | 3.06 | 0.05 | 0.22 |
| KIG 671 | 4.75 | 0.08 | 0.29 |
| KIG 689 | 2.66 | 0.14 | 0.14 |
| KIG 712 | 2.99 | 0.07 | 0.23 |
| KIG 716 | 3.90 | 0.03 | 0.22 |
| KIG 719 | 5.07 | 0.06 | 0.17 |
| KIG 731 | 2.89 | 0.06 | 0.21 |
| KIG 743 | 2.72 | 0.05 | 0.15 |
| KIG 754 | 2.46 | 0.02 | 0.15 |
| KIG 757 | 3.13 | 0.13 | 0.23 |
| KIG 795 | 2.57 | 0.19 | 0.15 |
| KIG 805 | 2.89 | 0.06 | 0.21 |
| KIG 807 | 2.50 | 0.15 | 0.16 |
| KIG 839 | 2.55 | 0.07 | 0.19 |
| KIG 892 | 3.21 | 0.10 | 0.23 |
| KIG 907 | 2.84 | 0.04 | 0.19 |
| KIG 912 | 2.72 | 0.07 | 0.20 |
| KIG 924 | 2.31 | 0.04 | 0.15 |
| KIG 928 | 2.83 | 0.11 | 0.21 |
| KIG 931 | 2.70 | 0.02 | 0.18 |
| KIG 932 | 3.39 | 0.04 | 0.26 |
| KIG 943 | 3.86 | 0.09 | 0.18 |
C-Concentration
A-Asymmetry
S-Clumpiness.
| Type | C | A | S |
|---|---|---|---|
| meanSE median | meanSE median | meanSE median | |
| Sb | 3.550.14 3.57 | 0.070.01 0.06 | 0.220.01 0.22 |
| Sbc | 2.940.10 2.84 | 0.100.01 0.08 | 0.200.01 0.20 |
| Sc | 2.830.05 2.80 | 0.110.01 0.09 | 0.190.01 0.19 |
| Sb-Sc | 3.060.06 2.89 | 0.090.01 0.08 | 0.200.01 0.20 |
Note: SE is standard deviation of the mean.
Col.(1): Morphological Type. Col.(2): C-Concentration. Col.(3) A-Asymmetry. Col.(4) S-Clumpiness.
| C | A | S | |
|---|---|---|---|
| meanSE median | meanSE median | meanSE median | |
| This study | 3.060.06 2.89 | 0.090.01 0.08 | 0.200.01 0.20 |
| Conselice (2003) | 3.470.08 3.44 | 0.140.01 0.13 | 0.280.02 0.25 |
Note: SE is standard deviation of the mean.
Col.(1): Morphological Type. Col.(2): C-Concentration. Col.(3) A-Asymmetry. Col.(4) S-Clumpiness.