The HD 163296 Circumstellar Disk in Scattered Light: Evidence of Time-Variable Self-Shadowing
Abstract
We present the first multi-color view of the scattered light disk of the Herbig Ae star HD 163296, based on coronagraphic observations from the Hubble Space Telescope Advanced Camera for Surveys (ACS). Radial profile fits of the surface brightness along the disk’s semi-major axis indicates that the disk is not continuously flared, and extends to 540 AU. The disk’s color (V-I)=1.1 at a radial distance of 35 is redder than the observed stellar color (V-I)=0.15. This red disk color might be indicative of either an evolution in the grain size distribution (i.e. grain growth) and/or composition, both of which would be consistent with the observed non-flared geometry of the outer disk. We also identify a single ansa morphological structure in our F435W ACS data, which is absent from earlier epoch F606W and F814W ACS data, but corresponds to one of the two ansa observed in archival HST STIS coronagraphic data.
Following transformation to similar band-passes, we find that the scattered light disk of HD 163296 is 1 mag arcsec-2 fainter at 35 in the STIS data than in the ACS data. Moreover, variations are seen in (i) the visibility of the ansa(e) structures, in (ii) the relative surface brightness of the ansa(e) structures, and in (iii) the (known) intrinsic polarization of the system. These results indicate that the scattered light from the HD 163296 disk is variable. We speculate that the inner disk wall, which Sitko et al. suggests has a variable scale height as diagnosed by near-IR SED variability, induces variable self-shadowing of the outer disk. We further speculate that the observed surface brightness variability of the ansa(e) structures may indicate that the inner disk wall is azimuthally asymmetric.
1 Introduction
Investigations of the nature and evolution of dust grains in proto-planetary systems are motivated in part by our desire to understand the birth and evolution of planetary bodies, which originate from these systems. It is well established that Herbig Ae/Be stars (Herbig, 1960) are intermediate mass pre-main-sequence stars, analogous to the more familiar low mass T Tauri stars, which contain copious amounts of circumstellar gas and dust (Waters & Waelkens, 1998). A wealth of observational evidence (Mannings & Sargent, 1997; Oudmaijer & Drew, 1999; Mannings & Sargent, 2000; Vink et al., 2002; Eisner et al., 2004) suggests that the geometry of this gas and dust takes the form of a circumstellar disk. By contrast, our understanding of fundamental properties such as grain composition and size distribution, as well as the time evolution of these parameters, are much less understood.
Analysis of ISO spectra led Meeus et al. (2001) to develop a 2-part evolutionary classification of Herbig systems; Group I sources were characterized as being slightly younger systems with flared outer disks, while Group II sources were characterized as slightly more evolved systems which have flatter disks owing to grain growth and settling. While Meeus et al. (2001) invoked dust settling to explain the differences in flaring between Group I and II sources, it has also been suggested that the outer regions of some Herbig disks may experience self-shadowing, owing to a “puffed-up” inner circumstellar disk rim (Natta et al., 2001; Dullemond et al., 2001; Dullemond & Dominik, 2004a; Isella & Natta, 2005). Recent models which include inflated inner disk rims have proven to be successful in explaining the near-IR and interferometric properties of several Herbig Ae stars (Isella et al., 2006). Conclusive confirmation of the geometry of the outer disk regions of Herbig Ae/Be stars inferred by SED-based studies has generally not occurred.
HD 163296 is a young (4 Myr; van den Ancker et al. 2000), nearby (122 pc; van den Ancker et al. 1998) Herbig Ae star. While the star is not deeply embedded in a natal star formation dust cloud (Thé et al., 1985), it still displays clear signs of active accretion via the presence of jets and Herbig Haro knots (Grady et al., 2000; Devine et al., 2000; Wassell et al., 2006). Hence, HD 163296 appears to be in a transition phase between optically thick, extremely young pre-main-sequence stars and the much more optically thin, near zero-age-main-sequence debris disk type stars (Ardila et al., 2004; Kalas et al., 2005, 2006; Golimowski et al., 2006). Indirect techniques (Bjorkman et al., 1995) and resolved imaging (Mannings & Sargent, 1997; Grady et al., 2000; Isella et al., 2007) have confirmed the presence of a circumstellar disk associated with HD 163296. HST STIS white-light coronagraphic observations spatially resolved the outer regions of this disk, and detected evidence of disk structure including an inner annulus of reduced scattering and a bright outer ring or ansae of material (Grady et al., 2000). The inner region of HD 163296’s circumstellar disk, as diagnosed by near-IR (0.8 - 5 m) SED monitoring, exhibits evidence of variability, possibly owing to changes in the inner disk wall (Sitko et al., 2008).
Attempts to link processes which dominate the inner regions of Herbig Ae disks to morphological features observed in the outer disk regions, i.e. determining the relative roles of self-shadowing, dust settling, and disk flaring (Dullemond & Dominik, 2004a), requires a wealth of observational data which diagnose the inner and outer disk regions. In this paper, we present a multi-epoch, multi-color view of the HD 163296 scattered light disk, providing a significant improvement in the documented behavior of the outer regions of HD 163296’s circumstellar disk. We describe the observational details and data reduction procedures applied to our ACS data in Section 2. In Section 3, we document the basic features of the HD 163296 scattered light disk in our ACS data, and compare these results to earlier epoch scattered light imaging in Section 4. The possible mechanisms which might explain the observed scattered light variability are discussed in Section 5. We provide a summary of our main results in Section 6.
2 Observations and Data Reduction
We obtained coronagraphic imaging of HD 163296 in the HST ACS F435W filter via the cycle 12 GTO program 9987, and in the ACS F606W and F814W filters via the cycle 11 GTO program 9295. All observations utilized the coronagraphic mode of the High Resolution Channel (HRC) camera, along with its 18 diameter occulting spot, yielding a 292 x 262 field of view at a pixel scale of 0028 x 0025. The FWHM of point spread function (PSF) of the HRC is 50 mas in V. Our science target data were obtained at two different HST roll angles to better facilitate the separation of PSF artifacts from real structures. The A3IV star HD 145570, selected for its spectral match to HD 163296, was used as a PSF reference, and was observed in orbits immediately following our HD 163296 exposures. A summary of the basic parameters of our dataset is presented in Table 1.
The standard HST pipeline was used to perform basic initial data reduction procedures. We used the best available calibration files for this processing, including a correction for the different flat field illumination of the region nearby the coronagraphic spot. CR-split images were combined using standard pipeline techniques.
Techniques to identify and remove PSF signatures from HST ACS coronagraphic data are well documented in the literature (Clampin et al., 2003; Golimowski et al., 2006). Following these established procedures, we first normalized and aligned the non-distortion corrected images of our PSF reference star to HD 163296 in an iterative manner, using a cubic convolution interpolation function. Residual alignment errors in the resultant best subtraction are on the order of 0.05 pixels (Pavlovsky et al., 2005) and our normalization is accurate to 2% (Clampin et al., 2003). Following the subtraction of a fully registered and scaled PSF, we used MultiDrizzle to correct our data for the known geometric distortion of the HRC field of view and rotate all images into a common orientation.
Next, SYNPHOT, the synthetic photometry package within STSDAS, was used to determine the correction factor needed to calibrate our data to an absolute photometric scale. As a template for HD 163296, we used a synthetic spectrum of 69 Her (A2V), normalized to the V-band magnitude of HD 163296, 6.899; a synthetic spectrum of 59 Her (A3III) normalized to a V-band magnitude of 4.940 served as a template for HD 145570. The ratio of the stellar flux between HD 163296 and HD 145570, extracted both from our coronagraphic images and our synthetic representations of these data, were consistent to 2% over multiple filter combinations, indicating our choice of synthetic spectra were reasonable. All PSF-subtracted, distortion corrected images were normalized to the synthetic flux of HD 163296, and the different roll angle images were combined to increase the effective signal to noise ratios (SNR). Note that all surface brightnesses reported in the native ACS filter bandpasses are based on the STMAG photometric system, and have been corrected for the known achromatic 52.5% reduction of flux induced by the coronagraph.
3 Disk Characteristics Derived from HST ACS Observations
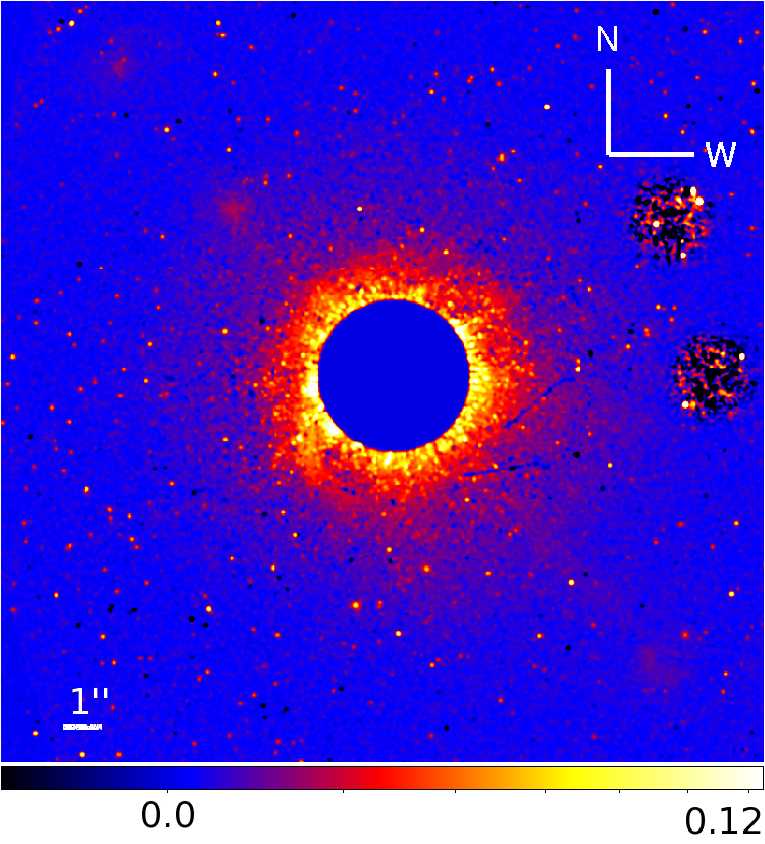
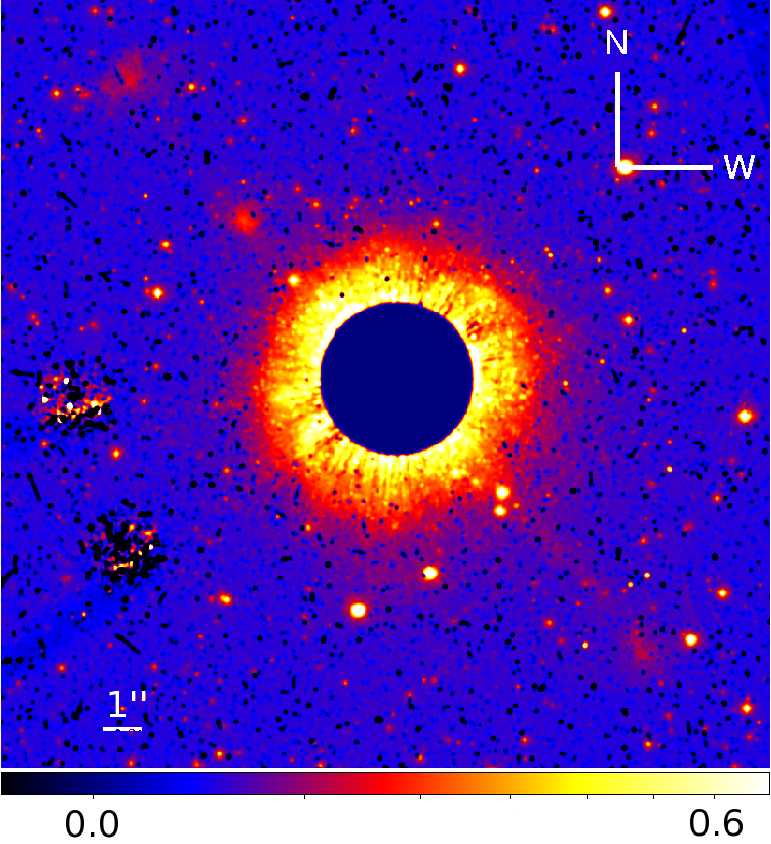
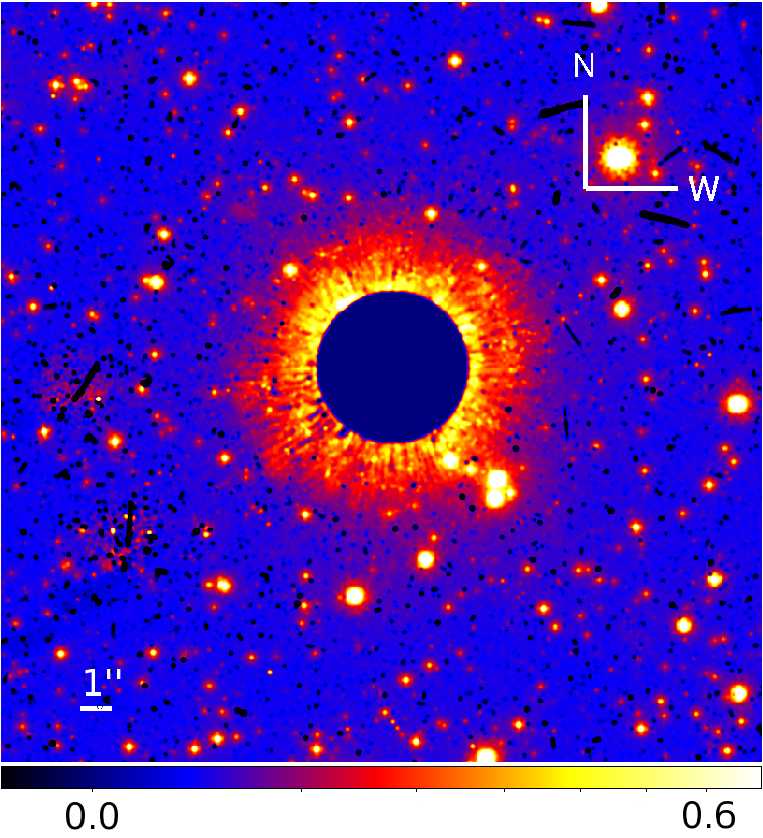
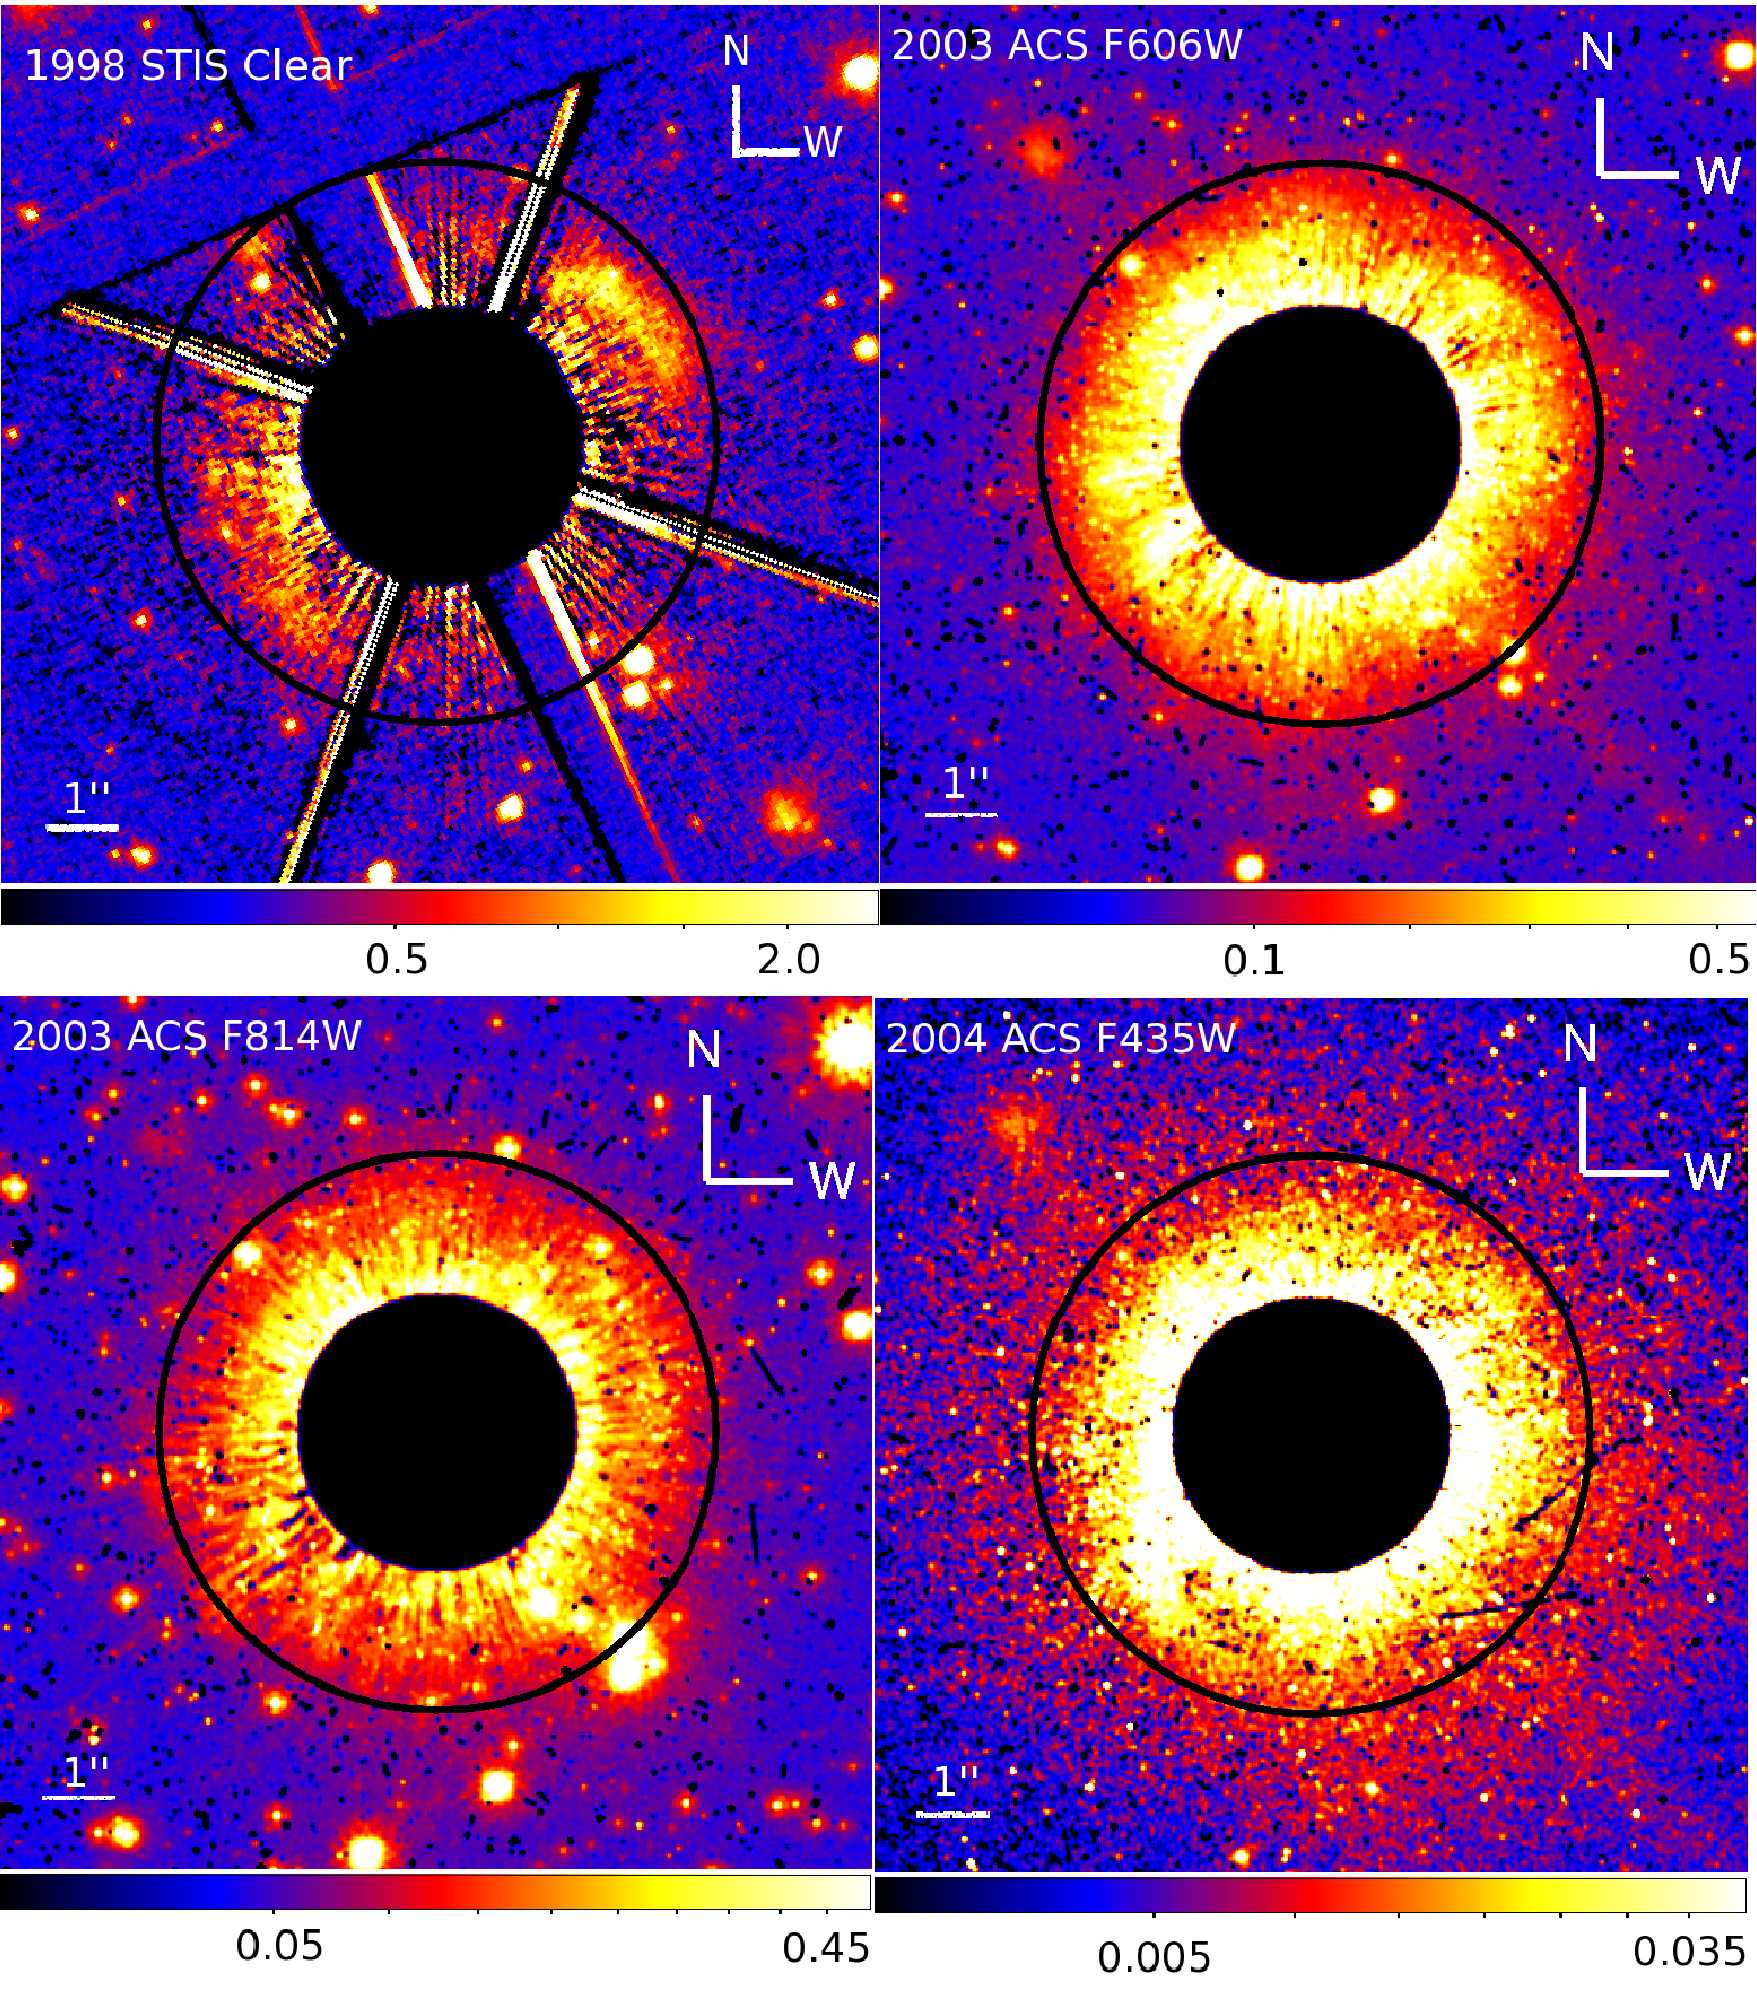
Figures 1, 2, and 3 present the PSF-subtracted, roll angle combined, calibrated images of HD 163296 in the F435W, F606W, and F814W filters respectively, using a square-root intensity stretch and a 3 pixel Gaussian kernel smoothing function. We have masked regions interior to a radial distance of 20, which are dominated by PSF-subtraction residuals. Note that several apparent features in these figures are actually well known instrumental artifacts, whose characteristics and origin are discussed in depth elsewhere (Clampin et al., 2003; Krist et al., 2005a; Gonzaga et al., 2005). All narrow radial spikes are residuals due to incomplete PSF subtraction. Additionally, image imperfections arising from the 30 diameter occulting spot and its occulting finger are clearly seen in all images (WNW of the central source in the F435W filter, ESE of the central source in the F606W and F814W filters). This occulting finger and spot also projects “horn-shaped” artifacts located at a distance of 225-30 from the central source.
Three Herbig-Haro knots and a bipolar jet are clearly visible in our multi-epoch images; these features have been identified in previous investigations (Grady et al., 2000; Devine et al., 2000), and Wassell et al. (2006) has used some of these data to estimate both the proper motion of the knots and the mass-loss rate of the HD 163296 system. Having identified these known features and artifacts of our data, we now focus on describing the radial and azimuthal surface brightness, color, and morphological features of the HD 163296 disk.
3.1 Disk Surface Brightness
While the surface brightness profile of portions of the HD 163296 disk were characterized via white-light STIS coronagraphic imaging (Grady et al., 2000), the large occulting wedges used by this coronagraph prevents an investigation of the full radial and azimuthal structure of the disk. Our ACS images do not suffer from such artifacts, hence we are able to provide the first complete, multi-color assessment of the HD 163296 disk.
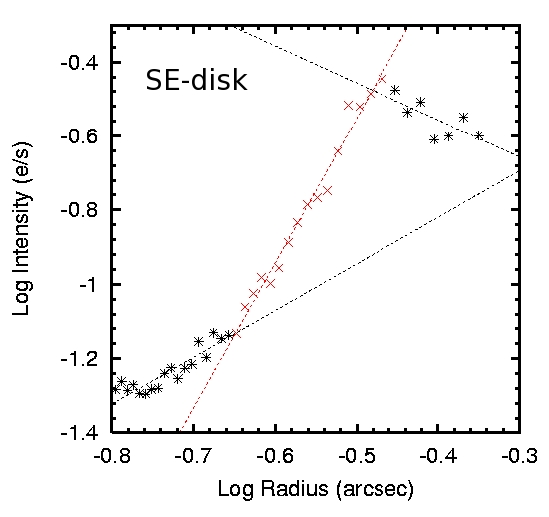
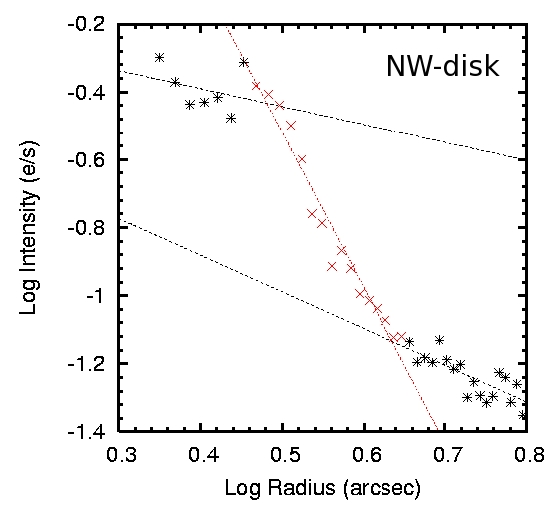
We first calculate the disk surface brightness along the semi-major axis, as reported by Grady et al. (2000) and Wassell et al. (2006). We extracted 10 pixel wide (025) radial profile cuts at position angles of 132∘ and 312∘ measured north to east, and subsequently combined these data in 4 pixel (010) bins (see Figure 4). As illustrated in Figure 5 for our F606W data, these radial profiles followed three distinct power-law trends. Between 22 to 28, evidence of scattered light is apparent; however, it is likely that PSF-subtraction residuals at least partially contribute to this measured flux. Clear evidence of the scattered light disk is seen in all filters from 29 - 44 (350-540 AU). The abrupt turnover in the profiles at radial distances 44 (540 AU) represents the termination of our detection of the disk; this boundary could either indicate the physical outer radius of the disk’s upper atmosphere or merely the radial location at which the disk becomes extremely optically thin.
Table 2 lists the exponents of the best power law fits derived along the disk major axis in each of our three filters. Concentrating on the 29 - 44 regions over which we are clearly seeing the scattered light disk, several features and trends are apparent. At the level of the SNR of our data, we do not detect clear evidence of differences between the surface brightness behavior in the SE versus NW quadrants of the disk in the F606W and F814W filters. Note that the SE quadrant of our F435W disk major axis radial profile cut is “contaminated” by the presence of an ansa feature, which will be discussed in Section 3.3.
3.1.1 Disk Size
A large range of sizes have been suggested for the HD 163296 circumstellar disk. Dominik et al. (2003) assumed an outer radius of 50 AU in their SED fitting of the system. Isella et al. (2007) reported that CO emission, likely produced in the upper layers of the disk, extended out to a radial distance of 540 AU; moreover, they reported an unexpected deficit of mm continuum emission beyond 200 AU which they interpreted as evidence that the disk was strongly depleted of dust outside of 200 AU. Isella et al. (2007) speculated that this deficit could be due to the inward migration of large bodies in the disk or due to clearing by a low mass companion.
Our spatially resolved imagery reveals that light scattering off of dust residing in the upper layers of the HD 163296 disk extends out to a radial distance of 540 AU. Given our detection, we suggest that there is no physical gap of dust at radial distances greater than 200 AU as hypothesized by Isella et al. (2007). Rather, we suggest that some of the alternate interpretations discussed in Isella et al. (2007) might provide more feasible explanations for the non-detection of dust mm continuum emission beyond 200 AU, including grain growth and/or a change in the disk geometry beyond 200 AU (assumed by Isella et al. 2007 to be a fully flared disk).
3.1.2 Disk Geometry
Power-law fits to scattered light imagery provide one means to diagnose the geometry of Herbig Ae circumstellar disks (see e.g. Grady et al. 2007). As seen in Table 2, the surface brightness of the HD 163296 disk in the ACS F435W, F606W, and F814W filters follow a r-4 dependence. These data clearly deviate from the expected behavior of a continuously flared disk, which would follow a r-2 dependence, or a geometrically thin disk, which would follow a r-3 dependence (Whitney & Hartmann, 1992). Dominik et al. (2003) also reached the conclusion that the HD 163296 disk was not continuously flared based on SED modeling, though some of the parameters adopted in their model which produced this result (i.e. a disk outer radius of 50 AU) are dubious.
3.2 Disk Color
Our multi-filter HST ACS dataset also allows us to provide the first measurement of the color of HD 163296’s scattered light disk. We first calculated the surface brightness at radial distances of 30 and 35 along the disk semi-major axis (PAs of 132∘ and 312∘). The median flux within 10 x 10 apertures were determined at each location, and complimentary measurements (PAs of 132 and 312) were averaged to produce the surface brightnesses listed in Table 3. Given our previous assessment that PSF-subtraction residuals could be contributing to the observed scattered light inside a radial distance of 29, we caution that our aperture photometry at 30 similarly might be marginally contaminated: by contrast, the aperture photometry at 35 should be free from such effects. Background sky surface brightnesses (Table 3) were determined by averaging the median pixel values in two 10 x 10 apertures located 90 from the central star. The standard deviation of these background sky apertures were used to provide an estimate of the photometric uncertainties within our science apertures at 30 and 35 along the disk semi-major axis.
The surface brightnesses in each of our ACS filters (Table 3) were converted to the standard BVI system by iteration of the transformation equation outlined by Sirianni et al. (2005); TMag = SMag + c0 + c1 * TC + c2 * TC2, where TMag is the Johnson B, V, or I magnitude, SMag is the ACS filter magnitude in the OBMag photometric system, TC is the OBMag color difference of the filters used, and c0, c1, and c2 are transformation coefficients tabulated by Sirianni et al. (2005). Note that the B-band surface brightness and (B-V) color were calculated using multi-epoch data, while V- and I-band surface brightnesses and (V-I) color were calculated using single epoch data (see Table 4).
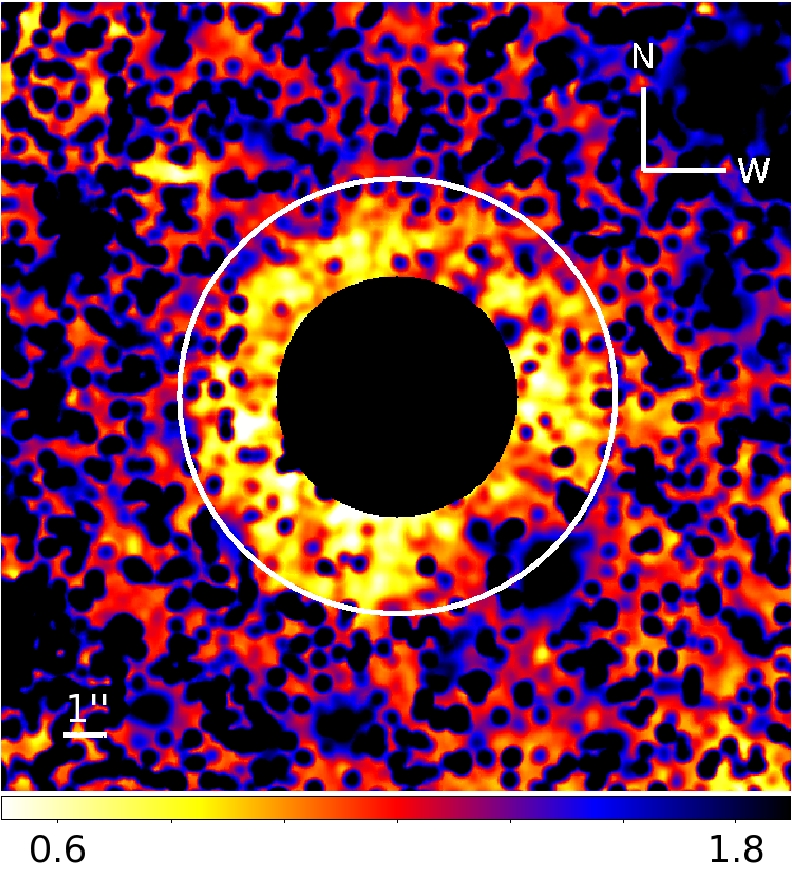
The observed disk (V-I) color 35 from the central star along the semi major axis, 1.1, is significantly redder than literature measurements of the stellar (V-I) color, 0.15 (Thé et al., 1985). To better assess the global behavior of the disk’s color, we transformed our F606W and F814W imagery to the Johnson V- and I-band filters using the aforementioned techniques. The resultant (V-I) image of the scattered light disk, plotted on a linear scale and smoothed with an 8 pixel Gaussian kernel, is shown in Figure 6. From inspection of Figure 6, we conclude that our data provide no clear evidence of a spatial dependence in the (V-I) color of the scattered light disk.
With the exception of AU Mic (Krist et al., 2005a), the colors of many other resolved disk systems are similarly redder than their host stars (HR 4796A, Schneider et al. 1999; HD 141569A, Clampin et al. 2003; GG Tauri, Krist et al. 2005b; Pic, Golimowski et al. 2006). As discussed for these aforementioned systems, disk colors have been used to provide tentative constraints on the relative size distribution and/or chemistry of grain populations, although degeneracies clearly exist in such an analysis (e.g. McCabe et al. 2002). One possible interpretation of a red disk color is that some amount of grain processing has occurred (i.e. grain growth; chemistry evolution). Grain growth and grain settling is a phenomenon which is believed to occur in Herbig Ae disks (van Boekel et al., 2003; Acke et al., 2004; Dullemond & Dominik, 2004a, b), and is generally associated with systems whose outer disks are not continuously flared. Previous analysis of the IR SED of HD 163296 has led to suggestions that this disk system has experienced grain growth and settling (Meeus et al., 2001). The detection of a non-continuously flared disk and red (V-I) disk color from our spatially resolved scattered light imagery is thus consistent (though not conclusive) with such phenomenon occurring. We also note that our HD 163296 imagery does not exhibit significant evidence of a scattering asymmetry due to differences in forward and back scattering of grains in the disk, as is seen in systems such as GG Tauri (Krist et al., 2005b). Future modeling efforts which utilize both the known SED properties (Meeus et al., 2001) and scattered light properties (the present study) of the HD 163296 disk would help to better constrain the grain size distribution in a more quantitative manner.
3.3 Morphological Features
The superlative spatial resolution of the HST ACS allows for the search of both radial and azimuthal morphological structures within the HD 163296 scattered light disk. Simple visual inspection of our F606W and F814W images (Figure 7) reveals no clear evidence of disk structure. By contrast, our later epoch F435W data (Figure 7) clearly exhibits evidence of an ansa-like structure in the southeast (SE) quadrant of the disk, located at the same position of one of two ansae noted in archival HST STIS coronagraphic observations (Grady et al., 2000). The ansa is visible and stationary in both of the roll angle images at F435W, whereas PSF-subtraction artifacts rotate with the roll angle; moreover, this structure is not associated with the “horn-shaped” artifacts attributable to the ACS large occulting spot and finger.
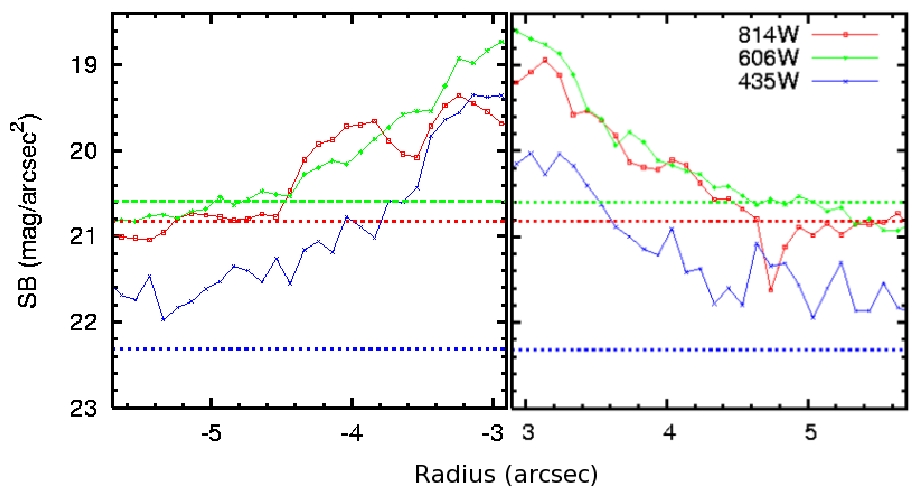
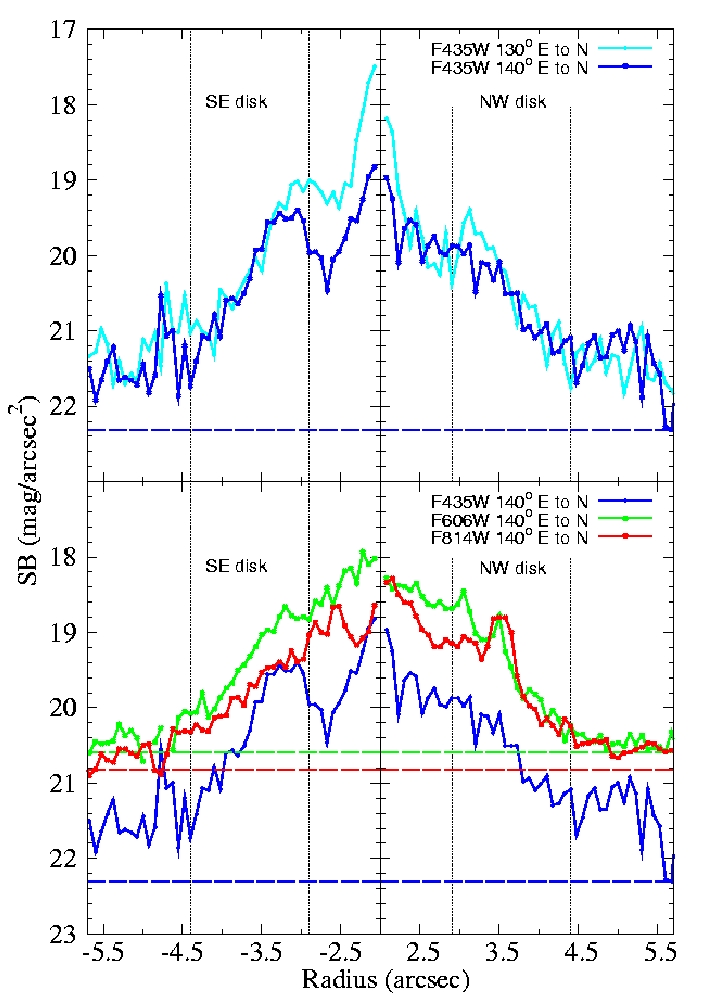
We extracted 10 pixel wide (025) median averaged radial profile cuts from our data to parameterize this disk structure. The bottom panels of Figure 8 depict the radial surface brightness profiles, in 3 pixel (0075) radial bins, at position angles of 140∘ N to E (SE disk) and 320∘ N to E (NW disk) for our three band-passes. At its brightest point, a radial distance of 31-32, the structure has a F435W surface brightness of 19.5 mag arcsec-2, and is preceded by sudden dimming in surface brightness. At slightly different position angles, 130∘ N to E and 310∘ N to E (see top panel, Figure 8), the feature is slightly brighter (F435W 19.0 mag arcsec-2), characterized by a less steep dimming in surface brightness, and reaches a peak flux at a slightly more interior radial distance. At both position angles, no corresponding structures are seen either in the NW cut of the F435W data or the SE and NW cuts of the F606W and F814W data. Note that the apparent “feature” in the F814W filter (and less apparent in the F606W filter) data at 35 in the NW disk quadrant is merely a background star. It is quite clear that the overall surface brightness of the F435W data at the radial distance of the feature (30) is brighter in the SE region of the disk than in NW region of the disk.
4 The Multi-Epoch Behavior of the HD 163296 Scattered Light Disk
Grady et al. (2000) presented white-light HST STIS coronagraphic observations of HD 163296, obtained in September 1998. The STIS observations were characterized by a featureless signal from 15 to 25, a darker zone at 265 of width 04, and two bright ansae peaking at 29 in the SE quadrant and 32 in the NW quadrant (see Figure 7). Grady et al. (2000) considered two primary explanations for the observed bright ansae and dark lanes in their STIS imagery, changes in the dust grain composition and dynamical clearing by planetary-like bodies, although they noted other possibilities could not be excluded.
Comparison of these archival white-light ( = 5850 Å, = 4410 Å) STIS data with our multi-epoch F435W ( = 4297 Å, = 1038 Å), F606W ( = 5907 Å, = 2342 Å), and F814W ( = 8333 Å, = 2511 Å) ACS observations requires caution, given the different band-passes sampled by each individual observation. Our single-epoch F606W and F814W observations span most of the STIS bandpass. To serve as a crude, approximate template for comparison to the archival STIS images, we have combined our ACS F606W and F814W data after first normalizing the images to account for the different throughput of these filters, 0.16 for F814W and 0.26 for F606W. Hereafter we refer to this combination as our ACS F606W+F814W dataset. Similarly, under the assumption that the HD 163296 disk surface brightness is not variable, we have combined our different epochs of ACS data, again after normalizing the images to account for the different throughput of the filters, 0.16 for F814W, 0.26 for F606W, and 0.19 for F435W. We will refer to this latter combination, which covers the majority of the STIS clear filter bandpass, as our ACS F435W+F606W+F814W dataset.
4.1 Disk Surface Brightness
Mirroring the analysis performed in Section 3.2, we calculated the average disk surface brightness along the semi-major axis of the disk, at radial distances of 30 and 35 from the central star. These surface brightness measurements are listed in Table 3; we also report the surface brightness of the STIS epoch data in the Johnson V-band in Table 4. We stress that this quoted V-band surface brightness, calculated via a transformation equation which incorporated our observed (V-I) disk color, is only a crude approximation.
The 1998 STIS epoch surface brightness along the major axis of the HD 163296 scattered light disk is significantly fainter than all other measurements in all other filter band-passes. In the Johnson V-band system, the 1998 STIS observation at a radial distance of 35 from the central star (20.1 mag arcsec-2) is 1 mag arcsec-2 fainter than the 2003 ACS V-band surface brightness (19.2 mag arcsec-2; see Table 4). In the instrumental filter system, the 1998 STIS clear filter surface brightness at a radial distance of 35 from the central star (20.3 mag arcsec-2) is similarly 1.0 mag arcsec-2 fainter than that measured in both of our ACS “white-light” filter approximation datasets (19.3 and 19.1 mag arcsec-2 respectively; see Table 3). As the 1998 epoch STIS data are significantly fainter than that measured in each bandpass of our ACS data, it is clear that no combination of the ACS data can reproduce the behavior of the STIS scattered light surface brightnesses. We suggest that the observed multi-epoch behavior of the disk’s surface brightness is one piece of evidence which suggests that the system’s scattered light disk is variable.
4.2 Morphological Features
Grady et al. (2000) reported the presence of two ansae in the white-light STIS coronagraphic image of HD 163296 obtained in 1998, with the brightest ansa located in the NW quadrant of the disk. In Section 3.3, we reported a null detection of any morphological features in our 2003 epoch data (F606W and F814W filters) and the detection of a single ansa structure in the SE quadrant of our HST ACS F435W data. The variability in the visibility of these morphological features are easily seen in Figure 7.
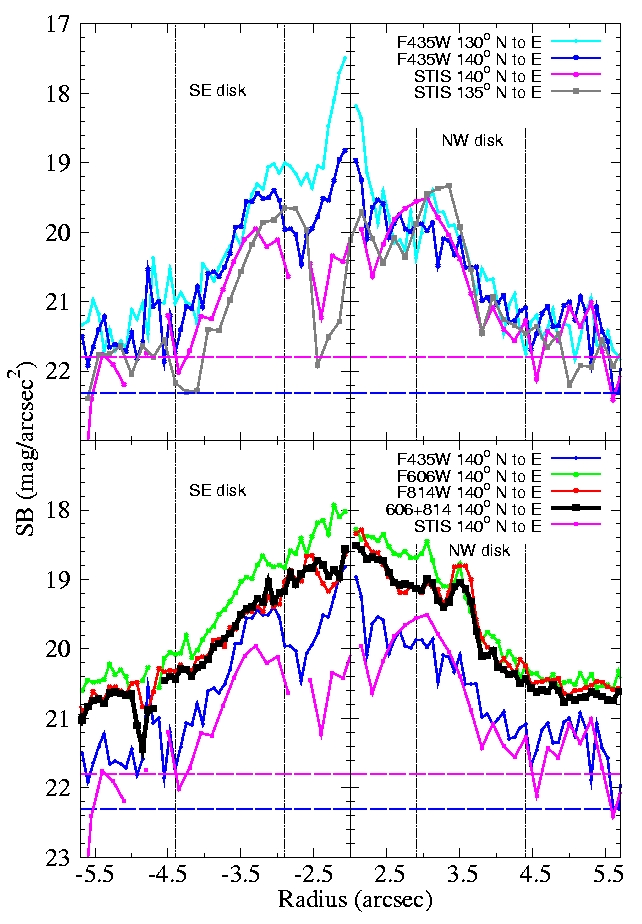
To compare and contrast these features in a quantitative manner, we have followed the technique outlined in Section 3.3 and extracted radial surface brightness profiles for the ACS F606W+F814W and STIS data (see Figure 9). Note that our ACS radial profile cuts correspond to the median average of a 10 pixel wide (025 arcsec) aperture which were subsequently averaged in 3 (radial) pixel bins, while our STIS radial profile cuts correspond to the median average of a 5 pixel wide (025 arcsec) aperture which were subsequently averaged in 3 (radial) pixel bins.
It is clear that the ansa structure we reported in our ACS F435W data in the SE quadrant of the disk (top left panel, Figure 9) occurs at the same radial distance as the ansa in the SE quadrant reported by Grady et al. (2000); hence it is plausible to suggest that these morphological features are in fact the same phenomenon. Interestingly, while the ansa is brighter in the NW quadrant than in the SE quadrant in the STIS data, a nearly opposite scenario characterizes the ACS F435W data, such that the ansa is present in the SE quadrant and absent in the NW quadrant. The ansa features which characterize the HD 163296 scattered light disk not only exhibit variability in the epochs in which they are discernible, but also exhibit different surface brightnesses in the epochs in which they are visible.
The non-detection of these morphological features in our 2003 epoch data are unlikely to be due to the sensitivity limits of our data. Ignoring the obvious differences in band-passes, the observed surface brightness of our ACS data which fail to detect any morphological features (2003; F606W, F814W) are actually brighter than that observed in our ACS data in which structure is detected (2004; F435W). Moreover, the limiting magnitude of our 2003 ACS data, depicted as dashed horizontal lines in Figure 8, is one magnitude arcsec-2 below the measured surface brightness of the morphological feature in our 2004 epoch F435W data, inside of a radial distance of 35.
One might also reason that, given the different band-passes probed by our multi-epoch ACS and STIS data, perhaps the visibility of the morphological structure is an optical depth effect, and is extremely color dependent (i.e. produced by small particle size scatterers). Given the very red (V-I) color of the disk (Section 3.2), we suggest that this scenario is dubious. Moreover, it is difficult to envision how an optical depth phenomenon could simultaneously explain both the visibility pattern (visible in 1998 white-light; 2004 F435W) and surface brightness variability (NW ansa brighter than SE ansa in 1998; SE ansa brighter than (non-detected) NW ansa in 2004) of these morphological features. Rather, we suggest that the visibility and surface brightness variability of these morphological features are two additional pieces of evidence which suggest that the system’s scattered light disk is variable.
We also note that unresolved linear spectropolarimetric monitoring of HD 163296 has revealed evidence of a time variable intrinsic polarization component (Bjorkman 2007, personal communication). Such data indicate variability in the net (unresolved) scattered light behavior of the system. As the integrated scattered light of HD 163296 exhibits variability, we suggest it is perhaps not surprising to find evidence that when this scattered light is resolved via coronagraphic imaging, that one finds multiple avenues of evidence indicating variability.
5 Origin of the Observed Scattered Light Variability
Our analysis of multi-epoch, multi-color spatially resolved imagery of HD 163296 suggests that its scattered light disk is variable; we observe a 1 mag arcsec-2 change in the overall surface brightness of the disk between epochs of observations, variability in the visibility of ansa structure(s), and azimuthally asymmetric variability of the surface brightness of these ansa(e), when they are visible. We now consider the possible origins of this variability, in the context of what is already known about the nature of the HD 163296 disk.
Previous interpretations of the bright ansae and dark zones which characterize the STIS scattered light data (Grady et al., 2000) outlined numerous mechanisms which could explain the origin of the observed phenomenon, including dynamical clearing, grain composition and/or size distribution differences, changes in the degree of disk flaring, and changes in the number density of grains. Grady et al. (2000) also postulated that, if the darker zones were in fact a partially cleared annulus, then a 0.4 MJupiter gas giant planet might be responsible for producing the disk clearing. While our 2003 epoch ACS F606W and F814W data clearly detected the HD 163296 scattered light disk, no evidence of any dark lanes were observed. Thus it appears unlikely that the morphological “dark lane” identified by Grady et al. (2000) corresponds to a cleared region of the disk; we suggest that the scattered light data present no clear evidence of the presence of a planetary mass body.
We consider two classes of mechanisms which could induce variability in our scattered light observations, changes in the fundamental properties of the scatterers and changes in the illumination of these scatterers. Our data indicate that the scattered light disk is variable on at least a time-scale of several years, which strongly suggests that we can exclude changes in the fundamental properties of the scatterers (i.e. grain composition, grain size distribution, grain number density, and degree of disk flaring) as a plausible mechanism.
Changes in the illumination of the disk, from the perspective of the scatterers, could include either (or both) stellar variability or variations in the number of stellar photons which reach the scatterers. We are not aware of any evidence which suggests that HD 163296 experiences UX-Ori-like photometric outbursts (Waters & Waelkens, 1998; Dullemond et al., 2003); rather, the star appears to have a generally stable photometric brightness of V=6.88, with a maximum variability range (high to low) of 0.42 magnitudes (Herbst & Shevchenko, 1999). Direct imaging of HD 163296 was obtained in each of our ACS filters at the epoch of our coronagraphic observations; however, these data were heavily saturated and did not use a gain setting which sampled the full well depth of the HRC, which would have permitted accurate photometry to be extracted (Gilliland, 2004; Sirianni et al., 2005). Thus, we do not have any observational evidence which could link HD 163296’s observed scattered light variability with stellar variability. Moreover, it is not clear that brightening/dimming of the central star could explain the visibility and surface brightness variability patterns observed in the disk ansae features. Rather, we suggest that HD 163296’s scattered light variability is related to changes in the number of photons which reach the disk scatterers.
Self-shadowing of the outer regions of Herbig Ae disks is a phenomenon predicted by theory (Natta et al., 2001; Dullemond et al., 2001; Dullemond & Dominik, 2004a; Isella & Natta, 2005), and variable illumination of envelopes has been reported in observations of GG Tau (Krist et al., 2005b) and Hubble’s Variable Nebula (Lightfoot, 1989). One suggested method to produce a self-shadowed disk is by inflation of the inner disk wall, which prevents copious amounts of photons from reaching at least part of the outer (flatter) disk. Sitko et al. (2008) has noted that the infrared spectral energy distribution (IR SED) of HD 163296 can vary by 30% on time-scales of 3 years or less, which they interpret as evidence of structural changes in the region of the disk near the dust sublimation zone. The mechanism driving this inner disk variability is not known, although Sitko et al. (2008) discuss several possibilities: -disk instabilities, magneto-rotational instabilities, an X-wind origin, and perturbations by a planetary-mass body. Given the non-continuously flared geometry of the HD 163296 outer disk, as inferred from our ACS scattered light data (Section 3.1), it is plausible that even small-scale changes in the scale height of the inner disk wall could induce a variable amount of self-shadowing of the outer disk. Thus we suggest that variable self-shadowing is one plausible mechanism which might explain the observed variability of the outer scattered light disk. Coordinated, contemporaneous observations of the inner and outer disk regions of HD 163296, namely follow-up IR SED and coronagraphic monitoring, would provide a robust means of investigating this proposed mechanism.
Recall that the bright ansa(e) features which sometimes characterize the HD 163296 scattered light disk were only observed during epochs in which the overall disk surface brightness was low (1998, 2004; see Figure 9 and Tables 3 and 4). Thus, in our working picture of the HD 163296 scattered light disk, with admittedly few data points to work with, these morphological features are only detected during periods of enhanced self-shadowing. We suggest that the source of these observed bright features is not a density enhancement of scatterers (i.e. a clump), as one would expect such a clump would contribute a localized enhancement of scattered light not only during enhanced self-shadowing periods, but also during epochs characterized by less self-shadowing. Rather, we speculate that these bright features signify a change in the spatial distribution of the scatterers, i.e. the ansa(e) represent a region in the disk which is modestly less flattened than other surrounding locations. During periods of increased self-shadowing these structures would partially escaped the shadow created by the inner disk wall. During periods of less self-shadowing, this region would be illuminated similar to its neighboring disk regions, thus as long as the structures do not have a significantly higher density of scatterers, the morphological feature would not be conspicuous in scattered light profiles. While the origin of the perturbations which give rise to these localized features is unknown, structure in the tenuous upper layers of protoplanetary disks is predicted to occur by theory. For example, Jang-Condell & Boss (2007) predicted such a phenomenon would occur in the inner regions of protoplanetary disks as a byproduct of planet formation via the disk instability model.
Finally, we consider the origin of the surface brightness variability of the ansa(e) structures, during the epochs in which they were visible (Section 4.2; Figure 9). If the visibility of these features is linked to the behavior of the inner disk wall, as we have suggested, then it is likely that the surface brightness variability of these features is also linked to events in the inner disk wall region. We speculate that the inner disk wall might be azimuthally asymmetric, hence cast an azimuthally asymmetric shadow on the outer disk. Given the orbital period of material located at the inner wall sublimation radius, 1 week (Sitko 2007, personal communication), the time-scale for such a asymmetry to produce a brighter NW versus SE illumination (and vice-versa) is much less than the maximum time-scale of the observed ansa variability, several years. We suggest that a series of scattered light images of HD163296, obtained in time steps of 1 to several weeks and during a period of enhanced self-shadowing, would provide a direct test of our interpretation of the system.
6 Summary
We have presented the first multi-color, multi-epoch analysis of resolved optical scattered light imaging of the Herbig Ae star HD 163296. To summarize the observational properties of these data:
-
1.
We spatially resolved the HD 163296 scattered light disk over radial distances of 29-44 (350-540 AU) in the HST/ACS F435W, F606W, and F814W filters.
-
2.
Radial profiles of the surface brightness along the semi-major axis of the disk follow a r-4 power law behavior, which is indicative of a non-continuously flared disk.
-
3.
The (V-I) color of the disk at 35, 1.1, is significantly redder than the stellar (V-I) color, 0.15. This red disk color appears to be spatially uniform at the SNR of our data, and is consistent with that expected for a disk which has experienced grain growth and is at least partially self-shadowed.
-
4.
A single ansa structure is present in the SE disk quadrant of the 2004 epoch ACS data (F435W filter), while no structure was observed in the 2003 epoch ACS data (F606W and F814W filters), despite the fact that the limiting detection magnitude of these latter data was sufficient to probe structure at the surface brightness observed in 2004. This morphological feature is spatially coincident with the fainter ansa reported in 1998 STIS observations (Grady et al., 2000) of HD 163296; the brighter ansa seen in the NW disk quadrant of the STIS data are absent from our ACS epoch data.
-
5.
The scattered light disk was observed to be significantly brighter in each of three filters of ACS observations from 2003-2004, as compared to white-light STIS observations in 1998. Combining the multi-color ACS data to crudely approximate the STIS bandpass suggests that the ACS epoch data are 1 mag arcsec-2 brighter than the STIS data. Along with the variability of the visibility and surface brightness of ansa structure(s) in the disk, these results suggest the scattered light disk of HD 163296 is variable.
We expect that the characterization of the basic behavior of HD 163296’s scattered light disk that we have provided in this study will serve as an important foundation to future efforts to model the multi-wavelength behavior of the system. Although speculative, we suggest that one plausible explanation for the origin of the observed variability is:
-
1.
The scale height of the inner disk wall is believed to inflate and deflate on time-scales of less than a few years, based on IR SED monitoring (Sitko et al., 2008). The variable scale height of the inner disk wall could induce variable self-shadowing of the outer disk, hence produce the observed overall variability of the scattered light disk.
-
2.
We suggest that the ansa structure(s), which appear to be discernible only during periods of enhanced self-shadowing, represent a localized region of scatterers which are at a scale height (at least marginally) above the projected shadow. As the features are not discernible during periods of more complete illumination of the outer disk, we believe that a localized enhancement in the scale height of the disk is more likely to produce the observed phenomenon than a localized density enhancement of the scatterers (i.e. a clump).
-
3.
The relative surface brightness variability of the NW versus SE ansa structures during epochs in which they are visible suggests that the inner disk wall might be azimuthally asymmetric, hence produce an azimuthally asymmetric shadow on the outer disk. Based on the short (1 week, Sitko 2007 personal communication) orbital time-scale of material located at the inner wall, we suggest that a series of resolved scattered light images of HD 163296, obtained during an epoch of enhanced self-shadowing, would provide a test of this particular suggested phenomenon.
References
- Acke et al. (2004) Acke, B., van den Ancker, M.E., Dullemond, C.P., van Boekel, R., & Waters, L.B.F.M. 2004, A&A, 422, 621
- Ardila et al. (2004) Ardila, D.R. et al. 2004, ApJL, 617, 147
- Bjorkman et al. (1995) Bjorkman, K.S. et al. 1995, BAAS, 27, 1319
- Clampin et al. (2003) Clampin, M. et al. 2003, AJ, 126, 385
- Devine et al. (2000) Devine, D., Grady, C.A., Kimble, R.A., Woodgate, B., Bruhweiler, F.C., Boggess, A., Linsky, J.L., & Clampin, M. 2000, ApJL, 542, 115
- Dominik et al. (2003) Dominik, C., Dullemond, C.P., Waters, L.B.F.M., & Walch, S. 2003, A&A, 398, 607
- Dullemond et al. (2001) Dullemond, C.P., Dominik, C., & Natta, A. 2001, ApJ, 560, 957
- Dullemond et al. (2003) Dullemond, C.P., van den Ancker, M.E., Acke, B., & van Boekel, R. 2003, ApJL, 594, 47
- Dullemond & Dominik (2004a) Dullemond, C.P. & Dominik, C. 2004a, A&A, 417, 159
- Dullemond & Dominik (2004b) Dullemond, C.P. & Dominik, C. 2004b, A&A, 421, 1075
- Eisner et al. (2004) Eisner, J.A., Lane, B.F., Hillenbrand, L.A., Akeson, R.L., & Sargent, A.I. 2004, ApJ, 613, 1049
- Gilliland (2004) Gilliland, R.L. 2004, Instrument Science Report (ACS 04-01; Baltimore: STScI)
- Golimowski et al. (2006) Golimowski, D.A. et al. 2006, AJ, 131, 3109
- Gonzaga et al. (2005) Gonzaga, S. et al. 2005, ACS Instrument Handbook, Version 6.0, (Baltimore:STScI)
- Grady et al. (2000) Grady, C.A., Devine, D., Woodgate, B., Kimble, R., Bruhweiler, F.C., Boggess, A., Linsky, J.L., Plait, P., Clampin, M., & Kalas, P. 2000, ApJ, 544, 895
- Grady et al. (2005) Grady, C.A. et al. 2005, ApJ, 630, 958
- Grady et al. (2007) Grady, C.A. et al. 2007, ApJ, 665, 1391
- Habart et al. (2006) Habart, E., Nata, A., Testi, L., & Carbillet, M. 2006, A&A, 449, 1067
- Herbig (1960) Herbig, G. 1960, ApJS, 4, 337
- Herbst & Shevchenko (1999) Herbst, W. & Shevchenko, V.S. 1999, AJ, 118, 1043
- Isella & Natta (2005) Isella, A. & Natta, A. 2005, A&A, 438, 899
- Isella et al. (2006) Isella, A., Testi, L., & Natta, A. 2006, A&A, 451, 951
- Isella et al. (2007) Isella, A., Testi, L., Natta, A., Neri, R., Wilner, D., & Qi, C. 2007, A&A, 469, 213
- Jang-Condell & Boss (2007) Jang-Condell, H. & Boss, A.P. 2007, ApJL, 659, 169
- Kalas et al. (2005) Kalas, P., Graham, J.R., & Clampin, M. 2005, Nature, 435, 1067
- Kalas et al. (2006) Kalas, P., Graham, J.R., Clampin, M.C., & Fitzgerald, M.P. 2006, ApJL, 637, 57
- Krist et al. (2005a) Krist, J.E. et al. 2005a, AJ, 129, 1008
- Krist et al. (2005b) Krist, J.E. et al. 2005b, AJ, 130, 2778
- Lecavelier des Etangs et al. (1993) Lecavelier des Etangs, A. et al. 1993, A&A, 274, 877
- Lightfoot (1989) Lightfoot, J.F. 1989, MNRAS, 239, 665
- Mannings & Sargent (1997) Mannings, V. & Sargent, A.I. 1997, ApJ, 490, 792
- Mannings & Sargent (2000) Mannings, V. & Sargent, A.I. 2000, ApJ, 529, 391
- McCabe et al. (2002) McCabe, C., Duchene, G., & Ghez, A.M. 2002, ApJ, 575, 974
- Meeus et al. (2001) Meeus, G., Waters, L.B.F.M., Bouwman, J., van den Ancker, M.E., Waelkens, C., & Malfait, K. 2001, A&A, 365, 476
- Natta et al. (2001) Natta, A., Prusti, T., Neri, R., Grinin, V.P., & Mannings, V. 2001, A&A, 371, 186
- Oudmaijer & Drew (1999) Oudmaijer, R.D. & Drew, J.E. 1999, MNRAS, 305, 166
- Paresce & Burrows (1987) Paresce, F. & Burrows, C. 1987, ApJL, 319, 23
- Pavlovsky et al. (2005) Pavlovsky, C., et al. 2005, ACS Data Handbook, Version 4.0, (Baltimore: STScI)
- Schneider et al. (1999) Schneider, G. et al. 1999, ApJL, 513, 127
- Sirianni et al. (2005) Sirianni, M. et al. 2005, PASP, 117, 1049
- Sitko et al. (2008) Sitko, M. L. et al. 2008, ApJ, 678, 1070
- Thé et al. (1985) Thé, P.S., Felenbok, P., Cuypers, H., & Tjin A Djie, H.R.E. 1985, A&A, 149, 429
- van Boekel et al. (2003) van Boekel, R., Waters, L.B.F.M., Dominik, C., Bouwman, J., de Koter, A., Dullemond, C.P., & Paresce, F. 2003, A&A, 400, L21
- van den Ancker et al. (1998) van den Ancker, M.E., de Winter, D., & Tjin A Djie, H.R.E. 1998, A&A, 330, 145
- van den Ancker et al. (2000) van den Ancker, M.E., Bouwman, J., Wesselius, P.R., Waters, L.B.F.M., Dougherty, S.M., & van Dishoeck, E.F. 2000, A&A, 357, 325
- Vink et al. (2002) Vink, J.S., Drew, J.E., Harries, T.J., & Oudmaijer, R.D. 2002, MNRAS, 337, 356
- Wassell et al. (2006) Wassell, E.J., Grady, C.A., Woodgate, B., Kimble, R.A., & Bruhweiler, F.C. 2006, ApJ, 650, 985
- Waters & Waelkens (1998) Waters, L.B.F.M. & Waelkens, C. 1998, ARA&A, 36, 233
- Whitney & Hartmann (1992) Whitney, B.A. & Hartmann, L. 1992, ApJ, 395, 529
| Object | Date | Instrument | Filter | Expos. Time | PA | Comment |
|---|---|---|---|---|---|---|
| HD 163296 | 16 Aug 2004 | HST ACS HRC | 435W | 2275 sec | 281 | roll angle 1 |
| HD 163296 | 16 Aug 2004 | HST ACS HRC | 435W | 2480 sec | 251 | roll angle 2 |
| HD 145570 | 16 Aug 2004 | HST ACS HRC | 435W | 2320 sec | 280 | PSF star |
| HD 163296 | 25 Mar 2003 | HST ACS HRC | 606W | 2350 sec | 76 | roll angle 1 |
| HD 163296 | 25 Mar 2003 | HST ACS HRC | 606W | 2350 sec | 104 | roll angle 2 |
| HD 145570 | 25 Mar 2003 | HST ACS HRC | 606W | 900 sec | 94 | PSF star |
| HD 163296 | 25 Mar 2003 | HST ACS HRC | 814W | 2100 sec | 76 | roll angle 1 |
| HD 163296 | 25 Mar 2003 | HST ACS HRC | 814W | 2260 sec | 104 | roll angle 2 |
| HD 145570 | 25 Mar 2003 | HST ACS HRC | 814W | 900 sec | 94 | PSF star |
| Filter-Disk Quadrant | Region 1 | Region 2 | Region 3 |
|---|---|---|---|
| 22-28 | 29-44 | 45-61 | |
| F435W-NW | 1.4 1.1 | 3.7 0.3 | 2.2 0.6 |
| F435W-SE | 4.9 1.1 | 5.3 0.4 | 1.5 0.5 |
| F606W-NW | 0.5 0.8 | 4.6 0.2 | 1.1 0.2 |
| F606W-SE | -1.0 0.4 | 3.9 0.1 | 1.3 0.2 |
| F814W-NW | 2.4 0.5 | 3.7 0.3 | 0.4 0.3 |
| F814W-SE | -0.7 0.6 | 3.21 0.4 | 0.72 0.3 |
| Filter | Disk Major Axis | Disk Major Axis | Background Sky S.B. |
|---|---|---|---|
| 30 | 35 | 90 | |
| (mag arcsec-2) | (mag arcsec-2) | (mag arcsec-2) | |
| ACS F435W | 19.60.1 | 20.10.2 | 22.3 |
| ACS F606W | 18.60.2 | 19.20.2 | 20.6 |
| ACS F814W | 19.10.2 | 19.40.2 | 20.8 |
| ACS (F606+F814)ave | 18.90.2 | 19.30.2 | 20.7 |
| ACS (F435+F606+F814)ave | 18.70.2 | 19.10.2 | 20.7 |
| STIS Clear | 20.00.1 | 20.30.2 | 21.8 |
| Filter | 30 | 35 |
|---|---|---|
| (mag arcsec-2) | (mag arcsec-2) | |
| B (ACS 2004)1 | 20.20.1 | 20.70.2 |
| V (ACS 2003) | 18.50.2 | 19.20.2 |
| I (ACS 2003) | 17.80.2 | 18.10.2 |
| V (STIS 1998) | 19.60.1 | 20.10.2 |
| (V-I) | 0.70.3 | 1.10.3 |