Massive Star Formation in the Molecular Ring Orbiting the Black Hole at the Galactic Center
Abstract
A ring of dense molecular gas extending 2-7 pc orbits the supermassive black hole Sgr A* at the center of our Galaxy. Using the Green Bank Telescope, we detected water maser lines and both narrow (0.35 km s-1) and broad (30 - 50 km s-1) methanol emission from the molecular ring. Two of the strongest methanol lines at 44 GHz are confirmed as masers by interferometric observations. These class I methanol masers are collisionally excited and are signatures of early phases of massive star formation in the disk of the Galaxy, suggesting that star formation in the molecular ring is in its early phase. Close inspection of the kinematics of the associated molecular clumps in the HCN (J=1-0) line reveals broad red-shifted wings indicative of disturbance by protostellar outflows from young (few ), massive stars embedded in the clumps. The thermal methanol profile has a similar shape, with a narrow maser line superimposed on a broad, red-shifted wing. Additional evidence for the presence of young massive protostars is provided by shocked molecular hydrogen and a number of striking ionized and molecular linear filaments in the vicinity of methanol sources suggestive of 0.5-pc scale protostellar jets. Given that the circumnuclear molecular ring is kinematically unsettled and thus is likely be the result of a recent capture, the presence of both methanol emission and broad, red-shifted HCN emission suggests that star formation in the circumnuclear ring is in its infancy.
1 Introduction
The circumnuclear molecular ring (CMR) extends from 2 to 7 pc from the massive black hole at the center of the Galaxy (Güsten et al. 1987; Jackson et al. 1993; Marshall, Lasenby & Harris 1995; Latvakoski et al. 1999; Yusef-Zadeh et al. 2006; Bradford et al. 2005; Herrnstein & Ho 2005; Schödel et al. 2002; Ghez et al. 2005; Reid et al. 2004; Christopher et al. 2005, hereafter CSSY). The ring was initially discovered more than 25 years ago (Becklin et al. 1982; Gatley et al. 1986; Telesco et al. 2006) via detection of thermal emission from dust. Subsequent studies of molecular line emission showed the ring to be inhomogeneous, clumpy, warped and kinematically disturbed (e.g., Jackson et al. 1993) suggesting that it has not fully settled since the gas was captured. The existence of the ring as well as the kinematics of molecular clouds in the Galactic center suggest that gas sporadically falls into the Galactic center and forms stars (Morris & Serabyn 1996 and the references therein). Star formation in the ring itself has been thought to be inhibited by the strong tidal force in the gravitational potential of the black hole and nearby stars unless the gas density exceeds . Recent high-resolution HCN (1-0) observations (CSSY) infer that the clumps near the inner edge of the ring have densities of a few times higher than this limit, thus implying that star formation may not be inhibited in the ring.
Here we report the detection of H2O and class I methanol masers in the CMR. Methanol masers are unambiguous signposts of on-going massive star formation throughout the Galaxy (Menten et al. 2002). Class I methanol masers are collisionally pumped, are relatively rare, and are often offset from the associated young stellar objects (Sobolev et al. 2005; Kurtz et al. 2004; Voronkov et al. 2004; Cesaroni 2005; Arce et al. 2007). Interstellar H2O masers are also collisionally excited (Elitzur, Hollenbach & McKee 1992) at high densities of 107-9 cm-3 and are also found in star forming regions. Close inspection of HCN line profiles in the vicinity of the masers are suggestive of protostellar outflows. Together, these data provide evidence for star formation activity in the CMR.
2 Observations
Using the Green Bank Telescope (GBT) of the National Radio Astronomy Observatory111 The National Radio Astronomy Observatory is a facility of the National Science Foundation operated under cooperative agreement by Associated Universities, Inc., we searched for methanol I (44.0694 GHz) and 6 water masers (22.23508 GHz) toward the CMR and the Sgr A East HII region near the center of the Galaxy. Our initial observations were made on 2007 October 30 using total power position switching. We used an uneven sampling covering 18 positions to map the CMR in the water line and searched for methanol toward 10 selected molecular clumps. The spectrometer was configured with a 50 MHz bandwidth and 12.2 kHz channels for the water observations and 200 MHz bandwidth and 24.4 kHz channels for the methanol. The channel spacing corresponds to 0.16 km s-1 in each case. We removed residual baseline shapes by subtracting a polynomial fit to the line-free channels. Our typical noise after Hanning smoothing was 17 mJy per channel for the water survey and 23 mJy per channel for the methanol survey. We estimate the flux scale uncertainty to be about 15%. On 2008 March 25 we obtained deeper GBT observations of the methanol lines detected in the first run. We observed using frequency switching this time to avoid contamination by sources in the reference beam. We used a 200 MHz bandwidth and 12.2 kHz channels. The methanol spectra presented in this paper come from the second set of observations. Also, a short Very Large Array (VLA) observation of the 44 GHz methanol line with typical integration of 2-3 minutes was also carried out in the C configuration on 2008 May 25 using the 1A mode of the correlator with a velocity coverage of 84 km s-1 (12.5 MHz) and channel separation of 1.2 km s-1 (195 kHz). The phase calibrator 17443-31165 was used every few minutes in fast switching mode to calibrate the three methanol sources detected in the CMR with the GBT.
3 Results
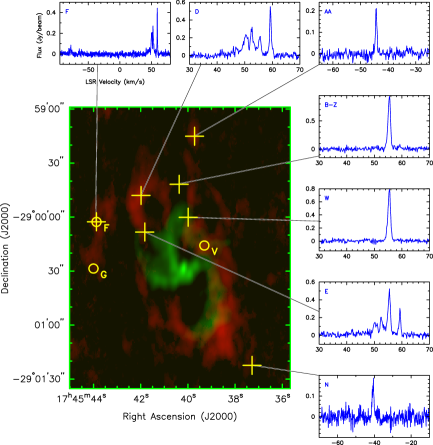
Our search detected five methanol sources, three of which arise from the CMR and two from sources SgrA-A and SgrA-D of the SgrA East HII regions. Figure 1 shows the positions of detected methanol and water line emission from the CMR; the water spectra are shown in panels around the HCN image of the molecular ring. A total of seven water line emission sources are detected toward the CMR. The three methanol detections coincide with HCN clumps F, G and V whereas water emission is detected toward clumps O, W, B-Z, D, E, F and an isolated clump which we label AA located at . A prominent ‘outer filament’ to the north of this source is traced by both H2 and HCN emission (Yusef-Zadeh et al. 2001; Bradford et al. 2005; CSSY). Interstellar water lines are potentially contaminated by water lines from evolved OH/IR stars. Examination of the OH-IR survey by (Sjouwerman & van Langevelde 1996) suggests this may be the case for the emission towards clump F, as stellar water maser G359.956-0.05 is located at the half-power position of the GBT beam for the positions covering the northern and southern components of the clump (Fig. 1). A more detailed examination of interstellar water lines toward the CMR and methanol lines toward Sgr A East HII regions will be given elsewhere. Here, we focus on the three methanol maser sources that are detected toward clumps E, G and V in the CMR.
One of the methanol masers coincides with clump V identified in the HCN emission from the molecular ring (CSSY). Previous H2 observations (Gatley et al. 1986) have indicated the presence of three shocked molecular H2 features in the CMR, one of which coincides with clump V. This clump is estimated to have a hydrogen number density of 5.8 cm-3, a size of 0.1pc, and a total mass of 1.4 (CSSY). Figure 2 shows the methanol and HCN spectra toward two positions taken from the circled region where methanol line emission has been detected; these spectra are shown in panels against the integrated HCN distribution of clump V. The methanol spectrum shows a narrow line at 44.17 km s-1 with a peak flux density of 0.682 Jy superimposed on broad emission that extends over LSR velocities between 40 and 100 km s-1. The relatively large beam of GBT at 44 GHz (15′′) means that we are unable to distinguish whether the broad methanol emission arises from a cluster of weak, collisionally excited methanol masers or from thermal cores in star forming regions. Both types of emission have been identified in hot molecular cores with outflow activity in massive star forming regions such as Sgr B2 (Mehringer & Menten 1997) and G31.41+0.31 (Kurtz et al. 2004). The narrow line with a FWHM km s-1 strongly suggests the presence of class I methanol masers. Our VLA observations had insufficient sensitivity (56 mJy per channel) and spectral resolution (1.2 km s-1) to confirm the location within the GBT beam.
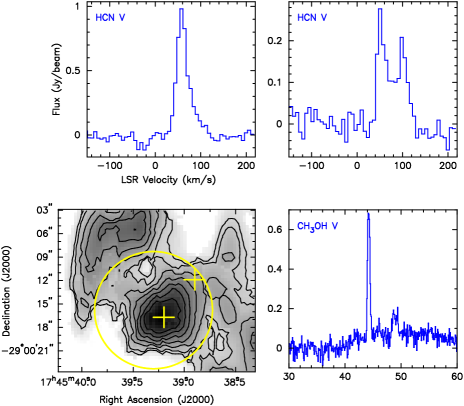
The HCN spectra shown in Figure 2 consist of a peak (0.22 Jy) at 44.3 km s-1 and a red-shifted component at 100 km s-1 a few arcseconds to the northeast of the peak emission. The HCN spectra of the emission from the region corresponding to the 15′′ GBT beam size of the detected methanol source shows clearly the presence of a red-shifted broad wing in its velocity profiles. The similarity of HCN and methanol line profiles toward clump V is a classic signature of one-sided molecular outflows in star forming regions (Plambeck & Menten 1990). The broad methanol emission is not widespread in the CMR as it appears to be located within GBT beams where narrow lines are detected. The presence of shocked molecular gas traced by the H2 1–0 S(1) line at the position of clump V and collisionally excited methanol emission support this picture. At a deprojected distance of 1.1 pc from Sgr A* (CSSY), this clump requires H2 number density of 2 cm-3 to be gravitationally bound, consistent with density estimates based on excitation (CSSY) and within the range required to collisionally pump the methanol emission (Sobolev et al. 2005). The flux of methanol emission with its broad velocity km s-1 are used to make an estimate of the column density of molecular gas in the quasi-thermal core. Using equation 6 of Mehringer & Menten (1997), we estimate the column density of 5.1 cm-2 using a typical flux of 200 mJy and a velocity width of FWHM km s-1 and adopting a rotational temperature of 200K. These thermal cores are only detected where nonthermal methanol maser components are detected. If we use a value of 10-7 as the abundance ratio of CH3OH to H2, a column density N cm-2 is estimated. This corresponds to of warm molecular gas associated with methanol masers. This low abundance of methanol is consistent with recent observations showing a lack of 96 GHz methanol emission from the CMR (Stanković et al. 2007) relative to the 20 and 50 km s-1 molecular clouds adjacent to the CMR. These measurements suggest that our detection of thermal methanol emission determined from the GBT spectrum is due to enhancement by localized star formation rather than the intrinsic physical conditions of the CMR, in contrast with the 20 and 50 km s-1 molecular clouds.
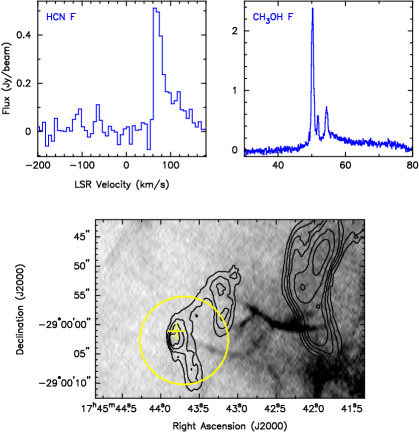
The second methanol maser coincides with HCN clump F. The spectrum (Fig. 3) shows three narrow lines between 52 and 55 km s-1 with peak flux density of 2.38 Jy at 50.2 km s-1 and a broad red-shifted wing extending up to 100 km s-1, similar to the velocity profile seen toward clump V. This is the only one among the five detected methanol sources that shows a counterpart in the 22 GHz water line. However, as noted earlier, the OH-IR star G359.956-0.05 (Sjouwerman & van Langevelde 1996) at the edge of the GBT beam makes it difficult to identify any interstellar H2O maser component associated with clump F. The HCN emission has a red-shifted wing near the maser position (see Fig. 3). Our VLA observation of this source detected several weak components at 50 km s-1 with flux densities ranging between 600 and 800 mJy corresponding to antenna temperatures of 450 - 700 K and signal-to-noise of 5 and 7, respectively. The VLA map with a resolution of 1.27 (PA=140) shows these weak sources to be distributed around a 20′′ diameter shell-like structure centered on clump F. The narrow velocity component of the emission (line width 0.3 km s-1), as measured by the GBT, increases the brightness temperature of the weak VLA sources to 1800 - 2800 K.
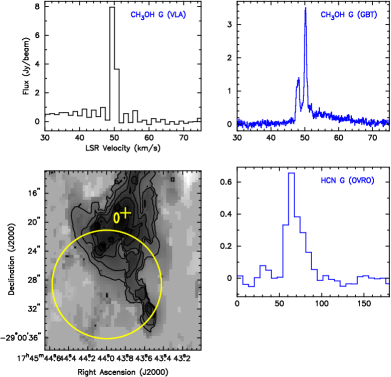
Finally, the brightest methanol maser has a peak flux density 3.03 Jy at 50.67 km s-1 and is associated with clump G (Fig. 4). This again exhibits a broad, red-shifted line profile, similar to those of clumps F and V. This profile peaks near 50 km s-1 and extends up to 70 km s-1. VLA observations detected a component with a peak flux density of 8 Jy but was localized a few arcseconds outside the GBT beam at . The higher VLA peak flux density than that of the GBT suggests that the methanol source is located beyond the half power of the GBT beam. The HCN spectrum showing a red-shifted wing in its velocity profile is detected 1.5′′ northwest of the location of the VLA spectrum, both of which are presented in Figure 4. The brightness temperature of the VLA source using the 0.3 km s-1 width of the line is K. The narrow velocity width and the high brightness temperature confirms the maser nature of the methanol emission detected with the GBT.
Although methanol emission has been detected from three regions in the CMR, we find additional broad, red-shifted HCN profiles, as in the region in the southern lobe of the CMR at . The line profile taken from a 0.4′′ pixel at this position peaks at -105 km s-1 and ranges between -139 and -17 km s-1. This suggests that the southern lobe of the CMR may also be a site of on-going star formation. Future mapping of the CMR in the methanol line will be able to determine if there are any methanol counterparts to red-shifted HCN line emission from the southern lobe.
4 Discussion and Conclusion
The presence of Class I methanol masers or thermal methanol emission and the absence of ultra compact HII regions in the immediate vicinity of clumps F and G are consistent with the earliest stages of massive star formation, within a few of the onset of gravitational collapse of a molecular cloud core, and prior to ionization by the UV flux from the newborn massive star. Furthermore, the HCN line profiles indicate that of molecular gas has been swept up at km s-1 presumably by a fast jet from an embedded protostar. This mass is consistent with the estimate of molecular gas estimated from quasi-thermal component of methanol emission. The momentum in the swept up gas is within the range associated with massive protostars in star forming regions (Arce et al. 2007) in the disk of the Galaxy. Assuming a jet speed of 500 km s-1 and an age of years, the inferred mass-loss rate from the protostar is yr-1, again consistent with the range observed for massive protostars in the Galactic disk (Arce et al. 2007).
The presence of components with negative and positive velocity relative to the bulk of clump G indicates a bipolar outflow. The one-sided, redshifted profiles of clumps F and V suggest that in these cases the approaching side of the jet has burst through the edge of the molecular clump. Jets emerging from cloud cores in the Galactic center would become exposed to the UV radiation of hot stars, thus the full extent of the jet could in principle be visible as an ionized source. Indeed, radio continuum image of the inner few arc-minutes shows several ionized linear features associated with molecular clumps in the CMR or the maser sources we have detected. A more detailed discussion of these ionized jet-like features will be given elsewhere.
Our detection of collisionally excited methanol masers, the broad molecular lines and shocked H2 line associated with the clumps of gas indicates the presence of outflows (Plambeck & Menten 1990) from massive protostars in the CMR with ages of a few yr. The lack of ultracompact HII regions throughout the ring implies that older, massive protostars are not present in appreciable numbers, and therefore that star formation in the CMR is only just beginning. This is consistent with the youthful dynamical state of the ring; the high velocity dispersion (Jackson et al. 1993) (30 km s-1) in the ring suggests that it is marginally gravitationally unstable. The velocity dispersion is expected to be damped by clump-clump collisions on a time scale comparable to the orbital time of the gas . It is also consistent with the high densities recently inferred from HCN measurements (CSSY), which imply the existence of gravitationally bound clumps, the precursors of collapse. Furthermore, the asymmetry in the northern and southern halves of the CMR suggests that the southern half of the CMR has not begun its star formation activity.
The youth of the ring supports the idea that star formation within the central few parsecs of the Galaxy is continually being fed by the capture of interstellar gas clouds. This process may be responsible for the unusual stellar populations in the central few pc of the Galaxy, which include very young stars (Paumard et al. 2006; Lu et al. 2006) (ages few Myr), as well as a population built up by continuous formation of stars over the last billion years. We have recently proposed (Wardle & Yusef-Zadeh 2008) that the sub-parsec-scale disk of massive stars orbiting the massive black hole at the Galactic center and the CMR can be created by partial accretion of extended Galactic center clouds when they envelop Sgr A* on a passage through the inner Galactic center. The cancellation of angular momentum of the captured cloud by self-interaction naturally creates a compact, gaseous disk of material close to Sgr A* in which star formation subsequently takes place. The CMR may be a relic from a recent passage of a cloud similar to that envisioned for the young stellar disk near Sgr A*, but with a lower incident cloud resulting in the capture of a larger region of the incoming cloud. Future studies of the molecular and ionized material and protostars associated with the CMR should be able to examine the role that this young cloud makes in our understanding of the evolution of gas and stars in in the nucleus of our Galaxy.
Acknowledgments: We are extremely grateful to M. Christopher and N. Scoville for providing us with their HCN data. We also thank the referee for careful reading of this paper.
References
- (1) Arce, H. G. et al. 2007, in Protostars and Planets V, B. Reipurth, D. Jewitt, and K. Keil (eds.), University of Arizona Press, Tucson, 245
- (2) Becklin, E., Gatley, I. & Werner, M. W. 1982, ApJ, 258, 135
- (3) Bradford, C. M., Stacey, G. J., Nikola, T., Bolatto, A. D., Jackson, J. M., Savage, M. L., Davidson, J. A. 2005, ApJ, 623, 866
- (4) Cesaroni, R. 2005, Outflow, Infall, and Rotation in High-Mass Star Forming Regions, Ap.Space.Science , 295 , 5
- (5) Christopher, M. H., Scoville, N. Z., Stolovy, S. R. & Yun, M. S. 2005, ApJ, 622, 346 (CSSY)
- (6) Elitzur, M., Hollenbach, D. J. & McKee, C. F. 1992, ApJ, 394, 221
- (7) Gatley, I., Beattie, D. H., Lee, T. J., Jones, T. J. & Hyland, A. R. 1986, MNRAS, 222, 299
- (8) Ghez, A. M., et al. 2005, ApJ, 620, 744
- (9) Güsten, R., Genzel, R., Wright, M. C. H., Jaffe, D. T. 1987, ApJ, 318, 124
- (10) Herrnstein, R. M. & Ho, P. T. P. 2005 ApJ, 620, 287
- (11) Jackson, J. M., Geis, N., Genzel, R., Harris, A. I., Madden, S., Poglitsch, A., Stacey, G. J. & Townes, C. H. 1993, ApJ, 402, 173
- (12) Kurtz, S. & Hofner, P. & lvarez C. V. 2004, ApJS, 155, 149
- (13) Marshall, J., Lasenby, A. N. & Harris, A. I. 1995, MNRAS, 277, 594
- (14) Latvakoski, H.M., Stacey, G.J., Gull, G.E. & Hayward, T.L. 1999, ApJ, 511, 761
- (15) Lu, J. R., Ghez, A. M., Hornstein, S. D., Morris, M., Matthews, K. & Thompson, D. J. 2006, JPCS, 54, 279
- (16) Mehringer, D. M. & Menten, K. M. 1997, ApJ, 474 , 364
- (17) Menten, K. M. et al. 1992, ApJ, 401, L39
- (18) Morris, M. & Serabyn, E. 1996, ARAA, 34, 645
- (19) Paumard, T. et al. 2006, ApJ, 643, 1011
- (20) Plambeck, R. L. & Menten, K. M. 1990, ApJ, 364, 555
- (21) Reid, M. J. & Brunthaler, A. 2004, ApJ, 616, 872
- (22) Schödel, R., Ott, T., Genzel, R., Eckart, A., Mouawad, N., & Alexander, T. 2002, Nature, 419, 694
- (23) Sjouwerman, L. O. & van Langevelde, H. J. 1996, ApJ, 461, L41
- (24) Sobolev, A. M. et al. 2005, in the proceedings of the IAUS 227, eds: Cesaroni, R. Churchwell, E. B., Felli, M., Walmsley, C. M. 174
- (25) Stanković, M., Seaquist, E. R. Mühle, S. Leurini, S. & Menten, K. M. 2007, in “Molecules in Space and Laboratory”, , May 14-18, 2007. Eds: J.L. Lemaire, et al. p.15
- (26) Telesco, C. M., Davidson, J. A. & Werner, M. W. 1996, ApJ, 456, 541
- (27) Voronkov, M. A., Brooks, K. J., Sobolev, A. M., Ellingsen, S. P., Ostrovskii, A. B. & Caswell, J. L. 2006, MNRAS, 373 , 411
- (28) Wardle, M. & Yusef-Zadeh, F. 2008, ApJ, submitted (arXiv:0805.3274)
- (29) Yusef-Zadeh, F., Hewitt, J. W. & Cotton, W. 2004, ApJS, 155, 421
- (30) Yusef-Zadeh, F., Stolovy, S. R., Burton, M., Wardle, M. & Ashley, M. C. B. 2001, ApJ, 560, 749