Open-flow mixing: Experimental evidence for strange eigenmodes
Abstract
We investigate experimentally the mixing dynamics of a blob of dye in a channel flow with a finite stirring region undergoing chaotic advection. We study the homogenization of dye in two variants of an eggbeater stirring protocol that differ in the extent of their mixing region. In the first case, the mixing region is separated from the side walls of the channel, while in the second it extends to the walls. For the first case, we observe the onset of a permanent concentration pattern that repeats over time with decaying intensity. A quantitative analysis of the concentration field of dye confirms the convergence to a self-similar pattern, akin to the strange eigenmodes previously observed in closed flows. We model this phenomenon using an idealized map, where an analysis of the mixing dynamics explains the convergence to an eigenmode. In contrast, for the second case the presence of no-slip walls and separation points on the frontier of the mixing region leads to non-self-similar mixing dynamics.
pacs:
47.52.+j, 05.45.-aI Introduction
Many industrial situations require the mixing of very viscous fluids, and involve mechanical stirring in order to achieve sufficient homogeneity. We investigate here the mixing scenario of a low-diffusivity dye in a free-surface open flow that crosses a localized stirring region. Relevant applications concern continuous throughflow industrial processes, for example the food processing, glassmaking, or pulp and paper industries.
Despite its ubiquity, open-flow mixing has received comparatively much less attention than its closed-flow counterpart in the applied mathematics and physics literature. Efficient stirring flows promote chaotic advection Aref1984 ; Ottino1989 in viscous fluids, that is chaotic Lagrangian trajectories of point-like particles. The temporal dynamics of the concentration field of a diffusive dye mixed by chaotic advection have been addressed in various experimental and numerical studies of closed flows Antonsen1996 ; Rothstein1999 ; Jullien2000 ; Villermaux2003 ; Gouillart2007 ; Haynes2005 ; Pikovsky2003 ; Sukhatme2002 ; Fereday2002 ; Fereday2004 . Time-persistent patterns and exponential decay rates of fluctuations observed in experiments and simulations Rothstein1999 ; Jullien2000 ; Sukhatme2002 ; Thiffeault2003 ; Fereday2004 have been associated with an eigenmode of the advection-diffusion operator dubbed strange eigenmode Pierrehumbert1994 ; Liu2004 ; Thiffeault2004b ; Haynes2005 ; Gilbert2006 . Non-hyperbolic structures of the phase space may nevertheless affect mixing dynamics Popovych2007 . In particular, we have shown in recent experimental work Gouillart2007 ; Gouillart2008a that fixed solid walls with no-slip boundary conditions can support parabolic separation points leading to algebraic mixing dynamics in closed flows Chertkov2003a ; Lebedev2004 ; Burghelea2004 ; Salman2007 .
A wide class of open-flow mixing devices successfully used in microfluidics rely on the repetition of similar passive or active mixing elements — such as grooved patterns Strook2002 , serpentine channels Castelain2001 ; Lin2007 , or elementary micro-pumps Okkels2004 — that induce repeated stretching and folding events as fluid particles flow through successive mixing elements Strook2002 ; Wiggins2004 ; Villermaux2008 . However, many large-scale processes of heavy industry cannot afford the pressure drop induced by repeated geometry changes, which is acceptable only for microscales.
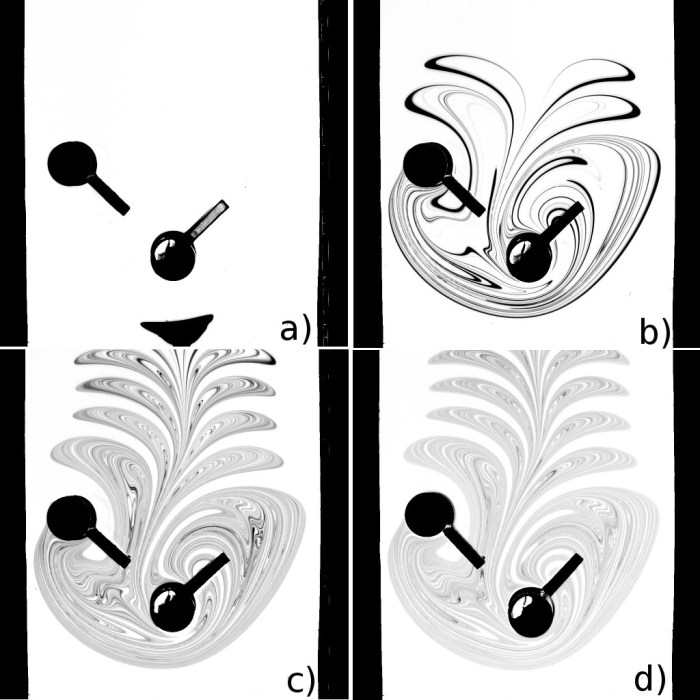
In contrast, we study here a free-surface channel flow that crosses a single mixing region where stirrers fold and stretch passing fluid particles, which is a more realistic device for large-scale processes. In the following, by “open-flow mixers” we refer to devices with a single mixing region. In such systems chaotic advection necessarily affects fluid particles for only a finite time, corresponding to their stay in the vicinity of the stirring elements. Successive stages of the mixing of an impurity — a blob of dye — are shown in Fig. 1: incoming dye escapes progressively downstream, and fluid particles experience only a finite number of stretching and folding steps. As chaos is usually characterized by asymptotic indices such as Lyapunov exponents Ottino1989 , the description of finite-time chaotic advection in open flows requires additional concepts.
Some tools of dynamical systems are nevertheless relevant to characterize mixing in open flows. Of particular importance is the set of periodic orbits that never escape the mixing region, called chaotic saddle Jung1993 ; Pentek1995 ; Sommerer1996 ; Pentek1999 ; Tel2000 . This set, together with its stable and unstable manifolds, are the backbone of fluid transport in and out of the mixing region Ott1993 ; Tel2000 . During their stay inside the chaotic region, Lagrangian particles successively shadow the trajectories of periodic orbits Bowen1975 ; Auerbach1987 ; Ghosh1998 , and finally leave the chaotic region close to the unstable manifolds of such orbits. In particular, fluid particles with long residence time in the mixing region (Fig. 1(c-d)) trace out the unstable manifold of the chaotic saddle Tel2000 . Aspects of mixing in open flows such as residence-time distributions, fractal dimensions of the mixing pattern, or the dynamics of chemical reactions occurring in the flow have been related to properties of the chaotic saddle Jung1993 ; Pentek1995 ; Sommerer1996 ; Pentek1999 ; Tel2000 ; Tel2005 .
However, except for an early pioneering study by Sommerer et al. Sommerer1996 , the evolution of the statistical properties of the dye concentration field have never been studied quantitatively in open chaotic flows. This contrasts with closed flows, where much research effort has been invested in the study of persistent concentration patterns and strange eigenmodes Pierrehumbert1994 ; Liu2004 ; Thiffeault2004b ; Haynes2005 ; Gilbert2006 . In addition, much of the earlier work on chaotic mixing in open flows has focused on flows more relevant for geophysics than industry (see Tel2005 for a review), such as Von Kármán alleys in the wake of a cylinder Jung1993 ; Sommerer1996 ; Pentek1999 ; Tel2000 . A noteworthy exception concerns mobile point vortices in an infinite domain studied by Neufeld and Tél Neufeld1998 , and Shariff et al. Shariff2006 , which share similarities with moving-rod devices that we study here. Our paper follows similar lines to the closed-flow studies of dye concentration cited above. Rather than characterizing kinematic properties of chaotic advection, we concentrate on describing quantitatively the evolution of the concentration field of a dye tracer over successive stirring periods in an open-flow system, shown in Fig. 1. The question of mixing efficiency and its characterization is beyond the scope of this paper and left for future communications. Rather, we investigate thoroughly the evolution of the concentration field resulting from the initial injection of a tracer.
The paper is organized as follows. In Section II we introduce our experimental apparatus, designed to reproduce some key ingredients of open-flow industrial mixers. In Section III we consider the main qualitative features of dye patterns. In Section IV, we take on the evolution of the concentration field for a first stirring protocol, where mixing takes place far from the channel side walls. After a few stirring periods, we observe the onset of a persistent concentration pattern whose moments decay exponentially with time, which we attribute to a concentration eigenmode. In Section V, we introduce a simplified 1-D model derived from the baker’s map Farmer1983 to describe chaotic advection in open flows. The onset of the concentration eigenmode and its link with the chaotic saddle are investigated in Section VI for this ideal model. In Section VII we report on departure from the eigenmode behavior of the concentration field in experiments with non-hyperbolic chaotic saddles, a case that occurs for example when the chaotic saddle extends to the fixed no-slip walls of the channel. We conclude in Section VIII with some final remarks.
II Experimental set-up and methods
We have designed an experimental device to study mixing in open flows with two main criteria: (i) a stirring flow that promotes chaotic advection and is simple enough to draw generic conclusions; and (ii) a device that is realistic enough to be relevant to applications. To satisfy the latter criterion, we require the device to have good mixing properties, but still be realizable with standard mechanical components.
Viscous cane sugar syrup flows in a long glass channel of length ( direction) and width ( direction). Sugar syrup fills the channel up to a height ( direction). We fix the flow rate at by imposing a constant pressure drop at the inflow of the channel, which corresponds to a velocity averaged over a channel cross-section . In the absence of stirrers, the flow is steady, and independent of after a few viscous diffusion lengths from the channel entrance. Analytical calculations and numerical simulations Pigeonneau_private show that this shallow and free-surface flow has a much flatter profile at all heights than a Poiseuille flow, and is instead closer to plug flow save close to the side walls.
Our stirring protocol resembles an egg-beater device (Fig. 2). Two cylindrical stirrers of diameter are plunged into the fluid and rotated at constant linear speed by two motors on intersecting circular paths of diameter . The distance between the centers of the two trajectories is , allowing a significant overlap of the two circles. We can vary the stirring frequency to tune the mean number of stirring periods spent by a particle inside the mixing region , where . is a rough measure of the typical non-dimensional timescale of chaotic advection for Lagrangian particles. was varied between and to study the dependence on stirring frequency of the evolution of the concentration field.
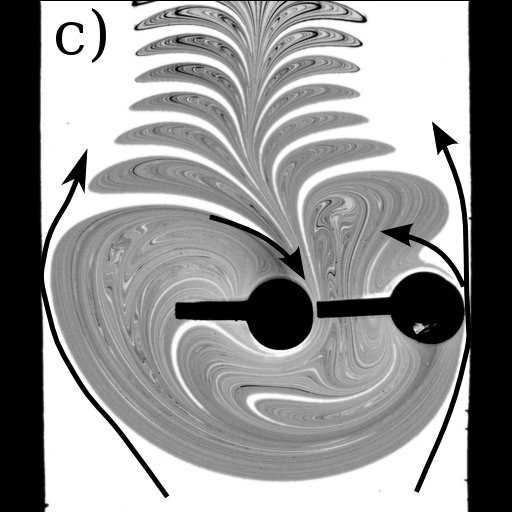
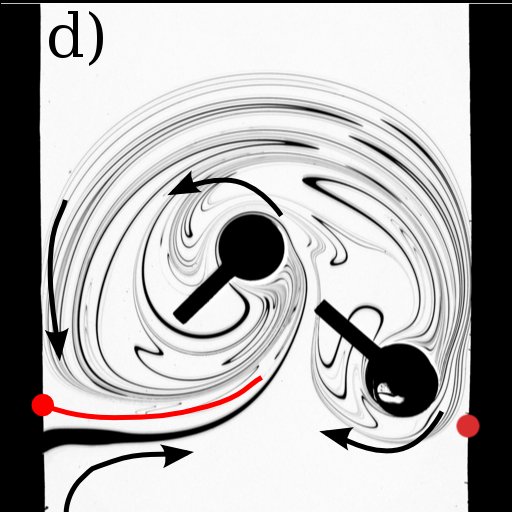
The direction of rotation of the stirrers with respect to the flow direction is an important factor. We can rotate the rods so that they assist fluid in passing along the channel walls (Figs. 2(a) and (c)), where they tend to incorporate fluid inside the mixing region while on the upper and central part of their trajectory (see arrows in Figs. 2(a) and (c)). By analogy with swimming, we call this protocol the butterfly (BF) protocol. Or we can rotate the rods in the opposite direction, so that fluid cannot cross the stirring region along the side walls, but is forced into a central funnel (Figs. 2(b) and (d)). To pursue the swimming analogy, we call this protocol the breaststroke (BS) protocol.
We inject with a syringe a spot of low-diffusivity dye (Indian ink diluted in sugar syrup) directly beneath the surface, far upstream of the stirring rods. With the stirring frequencies used here, we did not observe any 3-D motion of the dye, which remains just beneath the fluid’s surface for the duration of the experiments.
The stirring region is visualized from below using a Redlake camera of 12-bit depth. We visualize the whole width of the channel except for a strip on each side of width that are hidden by the frame bearing the channel. The region of interest (see Fig. 1) is lit from above in order to directly relate light intensity as measured by the camera to the absorption of light by dye, hence to dye concentration. We choose the acquisition frequency of the camera to be a multiple of the stirring frequency. A careful calibration of the response of the camera to dye absorption allows us to deduce from pixel values the concentration field of dye in the whole image Gouillart_thesis .


III Mixing patterns and their link with the chaotic saddle
In this section, we describe briefly some qualitative features of mixing patterns in our experiments. In the Stokes (viscous) flow regime, the presence of the side walls sharply dampens the stirring flow. We may thus consider the flow as steady and -independent outside a mixing region. The typical size of the mixing region corresponds to the range of the trajectories of the rods, plus a damping length that scales with the channel width. We shall now focus on this flow region.
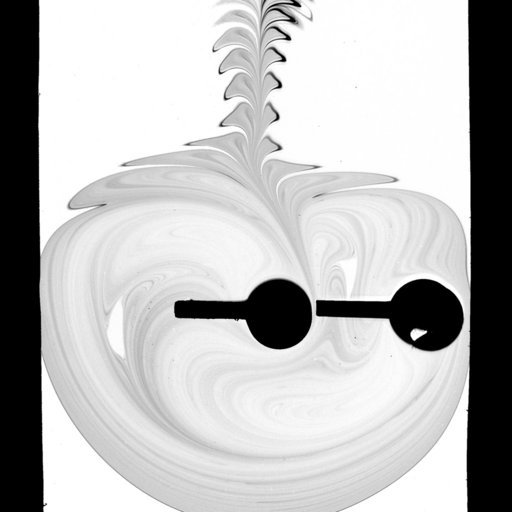
We obtain completely different mixing patterns by simply changing the direction of rotation of the rods, as can be seen in Fig. 2. However, some features of the time-evolution of the concentration pattern — illustrated in Fig. 1 for a butterfly protocol — are common to butterfly and breaststroke protocols. When the blob of dye arrives in the mixing region, some parts of the blob escape downstream very rapidly (thick black filaments in the upper part of Fig. 1(a)). They keep the same concentration level as the original concentration of the blob. Thus, our mixer fails to mix such elements efficiently. However, dye particles remaining in the mixing region (filaments caught by the rods in Fig. 1(a)) are stretched and folded by the rods. The dynamics of Lagrangian particles are thus chaotic in at least some part of the mixing region, leading to an exponential separation of neighboring particles at a typical rate Ottino1989 . After several stretching and folding events, the width of a filament of dye stretched at a rate inside the chaotic mixing region stabilizes at the so-called Batchelor length
| (1) |
where the effects of compression and diffusion balance, with the diffusivity. Obviously, stretching is not constant in the mixing region, but the width of a filament depends only on its recent history of stretching rate Batchelor1959 ; Villermaux2003 . After a few periods, the dye pattern therefore consists of gray dye filaments that have reached the Batchelor scale, and of white gaps that result from the repeated incorporation of undyed upstream fluid (Fig. 1(c)). Most strikingly, this pattern appears to repeat periodically in time (Figs. 1(c) and (d)), and also in space up to distortions due to the deviation from plug flow in the channel.
The persistence of the long-time pattern visible in Fig. 1 evokes permanent patterns observed in closed flows Rothstein1999 ; Jullien2000 ; Voth2003 that have been dubbed strange eigenmodes. For long times, the concentration field converges to the strange eigenmode, which is the second slowest decaying eigenmode of the advection-diffusion operator (the first trivial mode corresponds to a nondecaying uniform concentration in closed flows). This formalism was first presented by Pierrehumbert in a 1994 paper Pierrehumbert1994 , and deeper mathematical foundations were given by subsequent work Sukhatme2002 ; Liu2004 . The strange eigenmode regime corresponds to a global decay of concentration fluctuations Haynes2005 ; Fereday2004 , that arises when a box of width holds a large number of filaments coming from different parts of the fluid domain.
We are not aware of any previous observation of strange eigenmodes in open flows. In the remainder of this paper, we shall examine whether the presence of a permanent pattern, as suggested by the above visual inspection, is confirmed by a quantitative analysis of the evolution of the concentration field. We shall see that butterfly protocols indeed give rise to permanent patterns, whereas the spatial distribution of dye keeps evolving in the breaststroke case. We shall also explain the origin of such a difference.
Important differences between mixing dynamics in the two protocols may already be inferred from direct visual observation of Fig. 2. In the case of the butterfly protocol, after a few periods the mixing pattern has a smooth boundary on its upstream side and a cusped boundary on its downstream side. In addition, lobes detach at each period from the mixing region, as the pattern is advected downstream by the main flow and sliced by the rods (Fig. 1). Note that the lobes do not occupy the whole width of the channel: there exists a layer of free trajectories on both sides of the channel that are never caught by the rods and “shield” the mixing region from the low-stretching regions at the wall.
In the case of the breaststroke protocol, filaments are smoothly elongated in the upper part of the mixing region, and the advected pattern consists of roughly parallel striations of dye and white filaments that extend over the whole width of the channel. One of the striking features of the breaststroke pattern is the presence of two separation points on the channel walls (represented as small disks in Fig. 2 (d)) that stem from the competition between the main flow and the rods. Such separations points play a special role, as dye filaments emanating from the vicinity of the separation points bear a much higher concentration value than in the remainder of the pattern (Fig. 2(d)).
Fixed separation points observed in the breaststroke protocol are an obvious, but atypical, example of points belonging to the chaotic saddle Tel1990 , which is defined as the set of periodic orbits of the flow that return to their initial position after a finite number of stirring periods . Periodic orbits are therefore trapped in the vicinity of the rods, unlike most trajectories. Since Lagrangian trajectories obey Hamiltonian dynamics in 2-D incompressible flows, orbits of the chaotic saddle can be either hyperbolic, elliptic, or parabolic orbits. Fluid particles are stretched exponentially with time in the vicinity of hyperbolic points, while they loop around elliptic points and experience at most algebraic stretching — elliptic points are therefore found in non-chaotic regions, also known as elliptic islands. It can be shown Gouillart2007 ; Gouillart2008a that separation on fixed no-slip walls are marginally unstable parabolic points: fluid escapes their vicinity with slow, algebraic dynamics. Note than the chaotic saddle provides an elegant way to define formally the mixing region as the smallest connected set that contains all the periodic orbits of the saddle.
IV Butterfly protocol: onset of a strange eigenmode
In this section, we consider the evolution of the statistical properties of the concentration field in the butterfly protocol, and we show that the visual observation of a concentration eigenmode is confirmed quantitatively.
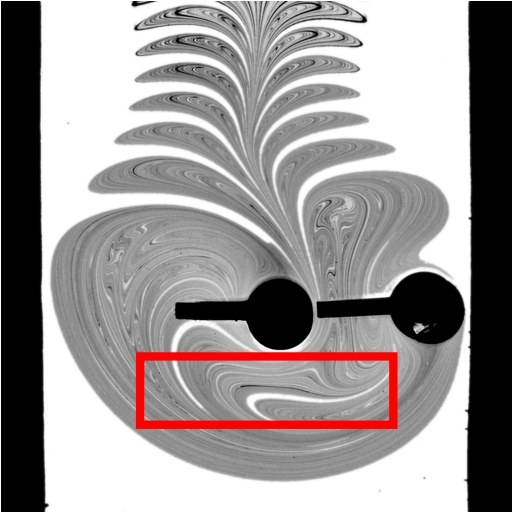

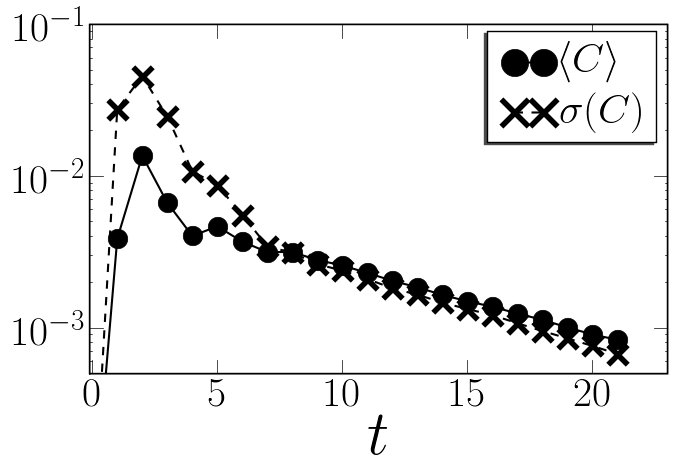


We measure the concentration field of dye in a rectangle inside the mixing region (Fig. 3(a)). The concentration mean and standard deviation over the studied domain are plotted for two different stirring frequencies in Fig. 3(b) and (c). The first thing to note is that the evolution of the mean is exponential in time, which amounts to an exponential distribution of residence times inside the mixing region for dye particles injected in the initial blob. The exponential evolution of the mean can be interpreted as a feature of chaos: a lobe is advected away from the mixing region at each period, but chaotic advection folds the remaining dye over the entire mixing region, so that the same fraction of the dye is taken away at each period. Residence time distributions with exponential tails have been observed in several studies of chaotic advection in open flows Jung1993 ; Sommerer1996 , at least for intermediate times.
Note that the decay rate is controlled to first order by mass conservation across the mixing region. If all fluid particles were to undergo a transient chaotic motion and be stretched and folded by the rods, the decay rate would depend only on the flowrate and the extent of the mixing region. In the limit of an infinite stirring frequency, this situation would correspond to a “perfect mixer” Danckwerts1953 ; Denbigh1984 , in the language of chemical engineering. Perfect mixers have the property that a particle leaves the mixing region with the same probability distribution as if it were picked at random, and have a purely exponential distribution of residence times. However, our device cannot be considered as a perfect mixer as some fluid particles escape rapidly downstream along the channel sides, and contribute to the short-time peak of the concentration mean in Fig. 3(b) and (c). The deviation from a purely exponential distribution of residence times may be considered as a crude measure of the deviation from perfect mixing.
We also observe on Fig. 3(b) and (c) that the evolution of the standard deviation is exponential as well, and with the same rate as the mean concentration, a first symptom of self-similarity. This is confirmed by the plots of the concentration histograms taken at different periods (Fig. 3(d)), which collapse on a single curve when rescaled by the exponentially-decaying concentration mean (Fig. 3(e)). We also observe that the spatial correlation of patterns taken at successive periods (inset in Fig. 3(e)) converges rapidly to unity, indicating a persistent pattern. This means that after a short transient phase the evolution of the concentration field is self-similar, and is therefore described by the exponential decay of its mean:
Such a permanent field is the signature of a coherent process (here, a time-periodic flow), in contrast to e.g. random turbulent mixing.
We have thus provided quantitative evidence of a concentration eigenmode in chaotic advection in open flows. Note that an eigenmode scenario was also observed for other stirring frequencies for the butterfly protocol. The next section is devoted to an interpretation of the eigenmode.
V An open-flow baker’s map model
Since Pierrehumbert drew attention to invariant patterns and strange eigenmodes Pierrehumbert1994 , much work has been devoted to their characterization in closed flows. The mean concentration is conserved in a closed geometry, so the evolution of the eigenmode corresponds to an exponential decay of fluctuations around the mean by averaging the concentration values of neighboring filaments Villermaux2003 ; Thiffeault2004 . It is now widely believed that the decay rate arises from a complex combination of spatial correlations of stretching, and cannot be easily predicted Antonsen1996 ; Wonhas2002 ; Fereday2002 ; Thiffeault2003 ; Fereday2004 ; Thiffeault2004b . In a recent paper Gouillart2008a , we have shown that the unstable manifolds of least-unstable periodic orbits are the backbone where the strange eigenmode takes significant values. In the vicinity of these orbits, particles repeatedly experience a lower stretching than average, and concentration fluctuations can survive longer.


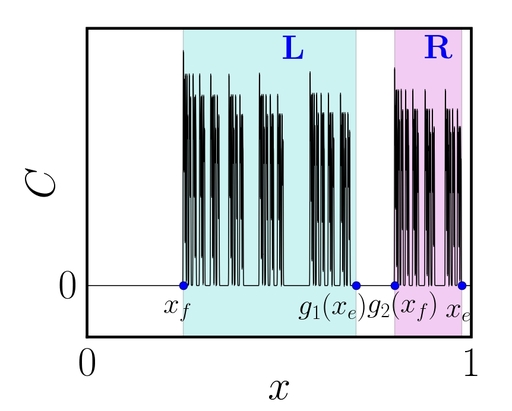
In this section, we account for the appearance of the concentration eigenmode observed in our experiments in open flows. We will rely on a simplified model for an open flow with chaotic advection. Our model is a variant of one of the most studied models of chaotic mixing, the inhomogeneous area-preserving baker’s map Farmer1983 ; Ott1989 ; Antonsen1991 ; Fereday2002 .
The open-flow baker’s map is defined on a channel-like domain, that is an infinite strip (Fig. 4) composed of a square central mixing region, and corresponding upstream and downstream regions. At each iteration, the action of the map consists of two parts: (i) a translation of the strip by a distance , mimicking the global advection in an open flow; (ii) a ‘traditional’ baker’s map, that is a division into two strips, which are then compressed and re-stacked as in Fig. 4, preserving area. The map has the property of mapping a distribution invariant along the direction transverse to the channel into another such distribution.
We take our initial “blob of dye” to be a uniform strip in the -direction, i.e. a strip that extends over the whole channel width. Inside the mixing region, the baker’s map stretches and folds this strip to create more strips, leaving the concentration independent of Fereday2002 ; Fereday2004 . We can thus focus on one-dimensional distributions that depend only on the coordinate: they represent a ‘cut’ across a striated pattern such as in Fig. 2(c) or (d). Hence, in the following calculation we limit ourselves to a one-dimensional version of the baker’s map.
Inside the unit interval, the baker’s map reads
| (2a) | |||
| where | |||
| (2b) | |||
and the union () symbol in (2a) means that is one-to-two: every point has two images given by and . The parameter satisfies and controls the homogeneity of stretching, with being the perfectly homogeneous case. We also define the mean stretching rate or Lyapunov exponent,
In the map represents the flow rate, where the unit of time is the period of the map, and the unit of length the width of the channel. The baker’s map is represented in Fig. 4(b) for the reference values we will use throughout the paper, and .
Under the action of the baker’s map, the concentration profile evolves as
| (3) |
The map therefore transforms the concentration profile at time into two images compressed by a factor and , respectively. In contrast to the classical baker’s map, a fraction of the strip is mapped outside of the unit interval at each iteration, so that the total amount of “dye” in the central interval decreases. Note that “leaking” baker’s maps relying on similar principles have already been used in Tel1996 ; Neufeld1998 ; Schneider2002 ; however, our map follows more closely the geometry of the channel flow. Diffusion is mimicked by letting the concentration evolve diffusively during a unit time interval Pierrehumbert2000 ; Fereday2002 . During that interval, evolves according to the heat equation with diffusivity .
First, we compute numerically the evolution of an initial blob under the action of . The initial condition (leftmost frame in Fig. 5(a)) is a strip of constant concentration , located in the interval . A few iterates () of the concentration profile are shown in Fig. 5(a) for the parameters , . The initial blob is repeatedly stretched and folded into many thinner strips (second to fourth frames in Fig. 5(a)). Some of the strips are mapped downstream, so that the number of remaining iterates is less than at time — or equal to for a vanishing flowrate .
As soon as strips are compressed to the Batchelor scale , diffusion starts smoothing the strips, so that the profiles of neighboring strips are merged together. From this moment on, we observe the recurrence of the same concentration pattern, but with lower amplitude at each iteration (third and fourth plots in Fig. 5(a)). This eigenmode behavior is confirmed by the same statistical analysis as in experiments: as shown in Fig. 6(a), we measure an exponential decay of the concentration mean inside the mixing region, and a similar decay of higher moments. Moreover, concentration histograms collapse onto a single curve when the concentration is rescaled by its mean value (Fig. 6(b)). The map therefore reproduces well the salient features observed in the physical flow.
VI Symbolic dynamics of the open-flow baker’s map
We now exploit the simplicity of the map to gain more insight into the structure of the asymptotic concentration pattern, and to describe its evolution with time. Periodic points of the chaotic saddle play a special role in the concentration profile, as they form the backbone of the profile. Some iterates of dye particles converge rapidly towards periodic orbits and remain close to them. The support of the asymptotic profile is therefore the set of periodic points broadened by diffusion to the minimal scale . In other words, the mixing profile is composed of a succession of iterates of the interval that have entered the mixing region at different times: apart from a zero-measure set of periodic orbits — the chaotic saddle — each point of the interval can be mapped backward in time to a point in the upstream region. Iterates of wider than do not overlap with other iterates and appear as gaps in the pattern (no periodic points are present in these intervals), while iterates that have been compressed down to overlap with images of the initial strip and belong to regions where the concentration is positive — the fractal chaotic saddle Tel2000 .
The central mixing region encloses the support of the chaotic saddle, and extends from to , (see Fig. 5 (b)). Here, is the unique fixed point of the map, and is the rightmost periodic point in the chaotic saddle. For our parameter values, belongs to the unique period-2 orbit of the map, .


We now look for a partition of the unit interval into disjoint regions that are mapped onto each other by the map — that is, we search for a Markov partition of the map Adler1998 ; Katok1995 , which describes succinctly the dynamics of the map. The partition is particularly simple in our example: using the map expression (2b), one easily checks that defining respectively the blocks and as the intervals and divides the concentration pattern in two disjoint blocks. Moreover, compresses both and inside , whereas moves a compressed image of to the location of , and advects downstream. Defining as and the amount of dye remaining in the two blocks at time , we obtain the symbolic dynamics Beigie1991b ; Tel1996
| (4a) | ||||
| (4b) | ||||
The symbolic dynamics (4) explains the exponential decay of the concentration mean: after a short transient, the total amount of dye decays exponentially at a rate , where
| (5) |
is the largest eigenvalue of the linear system (4). This is indeed the rate of decay measured in simulations (Fig. 6(a)).
Symbolic dynamics therefore allows us to determine the exact form of the global asymptotic evolution of the concentration profile in the map. Note that the value of depends only on the specific form of symbolic dynamics (4). In particular, does not depend on inside the interval where the symbolic dynamics (4) is valid. For example, for a fixed value of , the symbolic dynamics (4) accounts for the map in the interval
| (6) |
We have checked numerically that the dependence of on follows a devil’s staircase, that is a function constant almost everywhere except at values where the form of the symbolic dynamics change. This happens when the period of the rightmost periodic orbit changes, as the rightmost iterate of the interval gradually slides to the right as is increased, until it leaves completely the unit interval and it is replaced by another iterate with different symbolic dynamics. There is no obvious correlation in the successive periods of the rightmost orbits as is increased. Symbolic dynamics where the rightmost orbit has a short period are valid for a wider range of values than for longer periods.
The global exponential decay of the total concentration value also imposes the same exponential decay everywhere in the profile, hence the onset of a strange eigenmode. This can be explained as follows. Choose a box centered on of size given by the local scale of variation of the concentration profile , and suppose we measure a positive value of the concentration in this box. After a typical number of periods (which is the number of iterations needed to compress the whole unit interval to the Batchelor scale), the concentration value is the average of many images of the initial profile. Neglecting round-off and truncation errors, we may consider that measured at time represents the total amount of dye inside the whole unit interval at time , multiplied by the compression factor , that is a quantity
In the next period , the value of the concentration measured at is now
that is
| (7) |
as we have shown that and have a geometric progression. Eq. (7) is exactly the equation of an eigenmode (or invariant distribution) of the advection operator (the map). While not rigorous, the above reasoning shows that a concentration eigenmode appears because of the coherent cascading of large blocks towards smaller scales resulting from the repeated compression by the same map, whereas the decay of the total concentration in the larger blocks is explained by considering symbolic dynamics that describe the map.
We have chosen a set of parameters where the Markov partition of the map, and consequent symbolics dynamics, are very simple. Nevertheless, the same line of reasoning can be followed for more complicated partitions to explain how a concentration eigenmodes sets in. In the experiments, we know from the study of surface diffeomorphisms Boyland2000 that it is possible to define a Markov partition with a finite number of blocks for the real flow as well — in the absence of elliptical islands. Hence, we can infer the onset of an eigenmode from the existence of such a partition. However, it is very difficult to find the location of periodic orbits and the Markov partition from experimental pictures. In contrast, for the map, the partition can be determined by partitioning the unit interval using the iterates of periodic points Solari2005 .
VII Deviations from the strange eigenmode
In sections IV and V, we showed the appearance of a concentration eigenmode for experiments conducted with the butterfly protocol, where the chaotic saddle is located far from the channel walls, and we used an open-flow baker’s map to provide a simple physical picture of this evolution. We now report on experiments where the concentration pattern does not converge to an eigenmode, which we attribute to the non-hyperbolic character of the chaotic saddle.
We first present results for the evolution of the concentration field in breaststroke experiments (see Figs. 2(b) and (d) for a description of the rod motion). As for the butterfly protocol, we study the evolution of the first moments and histograms of the concentration, respectively plotted in Figs. 7(c) and (d) for a typical experiment. The evolution of the concentration mean plotted in Fig. 7(c) is close to exponential, though somewhat faster. This means that dye increasingly concentrates in a zone where it is rapidly advected downstream by the flow. However, the standard deviation, also plotted in Fig. 7(c), does not follow the evolution of the mean: it is slower than an exponential law. In addition, concentration histograms taken at different periods do not collapse onto a single curve: Fig. 7(d) reveals that the culprit is the high-concentration tail of the histogram, whose relative importance grows with time. This is the signature of dark filaments reinjected along the unstable manifolds of separation points (see Sec. III for a discussion of separation points).
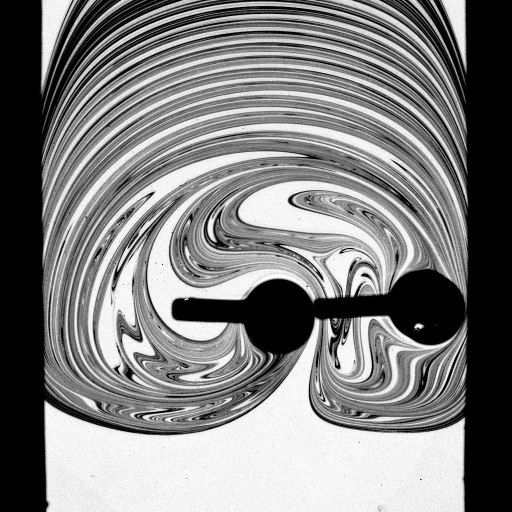
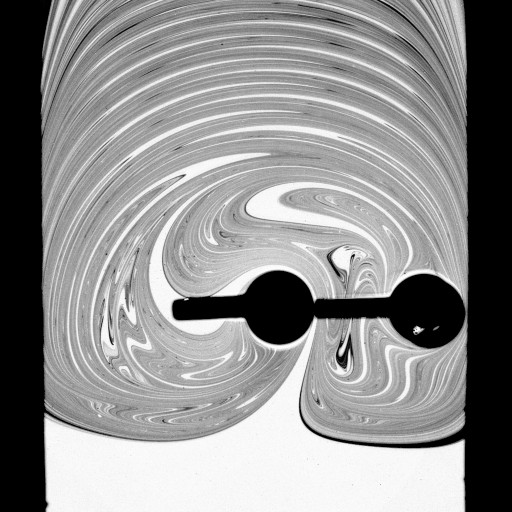


Hence, in the breaststroke protocol the concentration is not an eigenmode, since it is neither repeating nor exponentially-decaying. This can be related as follows to the concentration patterns discussed in Sec. III. We have already observed that mixing patterns for the breaststroke protocol differ significantly from those for the butterfly protocol. The patterns extend over the entire channel width, and the boundary between the upstream region and the mixing pattern is fixed by two separation points and their unstable manifolds. Following earlier work by Chertkov et al. Chertkov2003a ; Lebedev2004 , we have described in recent work Gouillart2007 ; Gouillart2008a how Lagrangian particles come closer to, or escape from, separation points obeying slow algebraic dynamics. As a consequence of the no-slip conditions, separation points on the walls are parabolic points that are only marginally unstable Jana1994 and therefore slow down fluid in their vicinity Gouillart2007 ; Gouillart2008a . Particles approach the wall according to slow algebraic dynamics for asymptotic times. A hint of such slow dynamics is evident in successive pictures of the mixing pattern, which grows slowly towards the unstable manifold of the separation points (Figs. 7(a) and (b)). In contrast, for butterfly protocols the mixing pattern rapidly adopts a constant shape.
Dye filaments from the initial blob are therefore trapped for long times in the vicinity of separation points, where they are hardly stretched and mixed. Unmixed fluid is slowly reinjected along the unstable manifold of separation points, forming dark filaments clearly visible in Fig. 7. As time goes on, dye is almost exhausted inside the bulk, whereas there remains a pool of poorly mixed fluid near the separation points that slowly leaks into the bulk. This contrast between bulk and reinjected filaments intensifies with time (Figs. 7(a) and (b)), in contradiction with the hypothesis of a decaying eigenmode. The discrepancy with a concentration eigenmode may therefore be traced back to the differences in the stretching rate near the walls, where stretching vanishes, and the bulk.
Structures of the phase space other than parabolic separation points may cause departure from an eigenmode behavior of the concentration pattern. It is well known that elliptical islands can store poorly-mixed fluid in the vicinity of their boundary, a phenomenon known as stickyness of islands Zaslavsky2002 ; Motter2005 . This stickiness is associated with exceptionally-low stretching values near the island. For the butterfly protocol, increasing the stirring frequency causes two small islands to appear inside the circles trace out by the rods (Fig. 8). These stable islands are destroyed by the main flow at lower stirring frequency. We indeed observe that dye accumulates around the islands with time, whereas it is depleted in the chaotic bulk. Dye is however slowly fed from the islands into the bulk by filaments escaping from the islands, visible in Fig. 8. This evolution of the pattern is incompatible with the onset of a strange eigenmode: the evolutions of the mean and standard deviation of the concentration are not similar.

VIII Conclusions
We have studied the mixing of a dye tracer by chaotic advection in an open-flow geometry, where a net free-surface flow crosses a limited stirring region. Our device was designed to be relevant for industrial applications, but our foremost objective was to classify mixing protocols according to generic mixing scenarios. For a first class of mixers characterized by the absence of regular islands in the mixing pattern or separation points on the walls, we have observed permanent concentration patterns that decay exponentially with time, and uniformly in space. A quantitative analysis of the concentration field confirmed that the same pattern repeats over time with decaying intensity. The onset of a permanent pattern may be attributed to the convergence of the concentration field to an eigenmode of the advection-diffusion operator, as it is now commonly accepted for closed flows Pierrehumbert1994 . We have provided here a more physical picture of the eigenmode by introducing an open-flow variant of the baker’s map. Symbolic dynamics of the map shed further light on the global decay of the total concentration in the mixing region. The repeated and coherent compression of the whole concentration profile down to smaller scales then explains the global decay at the same rate everywhere in the profile, hence the onset of a permanent pattern.
However, we observed a departure from the eigenmode in the case where stretching is anomalously slow in some regions of the phase space, that is when either parabolic points on no-slip walls or elliptic islands are present in the mixing region. The former case is related to a recent study Gouillart2007 ; Gouillart2008a where the influence of separation points on the dynamics of mixing in closed flows was investigated. In the case of a no-slip boundary condition on fixed walls, separation points promote slow reinjection of fluid that has been poorly stirred in the vicinity of the walls. This leads to a net slowdown of mixing dynamics, yielding algebraic decay instead of the exponential decay expected for a purely hyperbolic system.
Still, many important questions remain, in particular regarding mixing dynamics in the breaststroke case. While a previous study Jung1993 reported a power-law shape of the residence-time distribution in a Von Kármán alley in the wake of a fixed cylinder, we have always observed a decay of the mean concentration faster than a power law. Furthermore, we found the shape of the time-evolution of the mean concentration to depend on whether the blob of dye had been injected in the center of the channel or close to a side wall. Further investigation and modeling of this class of mixers is therefore needed.
A crucial question in chemical engineering concerns the quantitative evaluation of the mixing properties of different devices. We have studied here the decay of the first moments of the concentration field, which provide information about the time during which a “contaminant” remains in the mixing region with a significant concentration. Other situations of interest for industrial processes include a continuous injection of inhomogeneous fluid (say a succession of blobs of dye), where one expects the output to be “homogeneous enough” on a large range of scales. Since the work of Danckwerts Danckwerts1953 , a measure of mixing commonly used is the intensity of segregation, which measures the ability of a mixer to reduce fluctuations (as evaluated by the variance of the concentration field) between the input and the output. However, this measure depends strongly on the spatial distribution of the inhomogeneity. In contrast, for the butterfly case, the strange eigenmode characterizes the mixer itself, independent of initial condition. It may therefore be tempting to relate the characteristics of the strange eigenmode, i.e. its probability distribution function or its power spectrum, to the mixer’s capacity for reducing the concentration fluctuations. Future work will deal with the characterization of the early transient pattern, which consists of the worst-mixed fluid elements, and address the short-residence-time regime and a subsequent assessment of mixing quality.
Acknowledgements
We gratefully acknowledge enlightening discussions with Franck Pigeonneau about the form of the channel flow. The authors also thank Cécile Gasquet and Vincent Padilla for technical assistance, as well as François Daviaud and Philippe Petitjeans for fruitful discussions.
References
- (1) H. Aref, “Stirring by chaotic advection,” J. Fluid Mech. 143, 1 (1984).
- (2) J. M. Ottino, The Kinematics of Mixing: Stretching, Chaos, and Transport (Cambridge University Press, Cambridge, U.K., 1989).
- (3) T. M. Antonsen, Z. Fan, E. Ott, and E. Garcia-Lopez, “The role of chaotic orbits in the determination of power spectra of passive scalars,” Phys. Fluids 8, 3094 (1996).
- (4) D. Rothstein, E. Henry, and J. P. Gollub, “Persistent patterns in transient chaotic fluid mixing,” Nature (London) 401, 770 (1999).
- (5) M.-C. Jullien, P. Castiglione, and P. Tabeling, “Experimental observation of batchelor dispersion of passive tracers,” Phys. Rev. Lett. 85, 3636 (2000).
- (6) E. Villermaux and J. Duplat, “Mixing as an aggregation process,” Phys. Rev. Lett. 91, 184501 (2003).
- (7) E. Gouillart, N. Kuncio, O. Dauchot, B. Dubrulle, S. Roux, and J.-L. Thiffeault, “Walls inhibit chaotic mixing,” Phys. Rev. Lett. 99, 114501 (2007).
- (8) P. H. Haynes and J. Vanneste, “What controls the decay of passive scalars in smooth flows?,” Phys. Fluids 17, 097103 (2005).
- (9) A. Pikovsky and O. Popovych, “Persistent patterns in deterministic mixing flows,” Europhys. Lett. 61, 625 (2003).
- (10) J. Sukhatme and R. T. Pierrehumbert, “Decay of passive scalars under the action of single scale smooth velocity fields in bounded two-dimensional domains: From non-self-similar probability distribution functions to self-similar eigenmodes,” Phys. Rev. E 66, 056302 (2002).
- (11) D. R. Fereday, P. H. Haynes, A. Wonhas, and J. C. Vassilicos, “Scalar variance decay in chaotic advection and Batchelor-regime turbulence,” Phys. Rev. E 65, 035301 (2002).
- (12) D. R. Fereday and P. H. Haynes, “Scalar decay in two-dimensional chaotic advection and batchelor-regime turbulence,” Phys. Fluids 16, 4359 (2004).
- (13) J.-L. Thiffeault and S. Childress, “Chaotic mixing in a torus map,” Chaos 13, 502 (2003).
- (14) R. T. Pierrehumbert, “Tracer microstructure in the large-eddy dominated regime,” Chaos Solitons Fractals 4, 1091 (1994).
- (15) W. Liu and G. Haller, “Strange eigenmodes and decay of variance in the mixing of diffusive tracers,” Physica D 188, 1 (2004).
- (16) J.-L. Thiffeault, “The strange eigenmode in Lagrangian coordinates,” Chaos 14, 531 (2004).
- (17) A. D. Gilbert, “Advected fields in maps — iii. passive scalar decay in baker’s maps,” Dynamical Systems 21, 25 (2006).
- (18) O. V. Popovych, A. Pikovsky, and B. Eckhardt, “Abnormal mixing of passive scalars in chaotic flows,” Phys. Rev. E 75, 036308 (2007).
- (19) E. Gouillart, O. Dauchot, B. Dubrulle, S. Roux, and J.-L. Thiffeault, “Slow decay of concentration variance due to no-slip walls in chaotic mixing,” Phys. Rev. E 76, 026211 (2008).
- (20) M. Chertkov and V. Lebedev, “Decay of scalar turbulence revisited,” Phys. Rev. Lett. 90, 034501 (2003).
- (21) V. V. Lebedev and K. S. Turitsyn, “Passive scalar evolution in peripheral region,” Phys. Rev. E 69, 036301 (2004).
- (22) T. Burghelea, E. Segre, and V. Steinberg, “Mixing by polymers: Experimental test of decay regime of mixing,” Phys. Rev. Lett. 92, 164501 (2004).
- (23) H. Salman and P. H. Haynes, “A numerical study of passive scalar evolution in peripheral regions,” Phys. Fluids 19, 067101 (2007).
- (24) A. D. Stroock, S. K. W. Dertinger, A. Adjari, I. Mezić, H. A. Stone, and G. M. Whitesides, “Chaotic mixer for microchannels,” Science 295, 647 (2002).
- (25) C. Castelain, A. Mokrani, Y. L. Guer, and H. Peerhossaini, “Experimental study of chaotic advection regime in a twisted duct flow,” European Journal of Mechanics - B/Fluids 20, 205 (2001).
- (26) K.-W. Lin and J.-T. Yang, “Chaotic mixing of fluids in a planar serpentine channel,” International Journal of heat and mass transfer 50, 1269 (2007).
- (27) F. Okkels and P. Tabeling, “Spatiotemporal resonances in mixing of open viscous fluids,” Phys. Rev. Lett. 92, 038301 (2004).
- (28) S. Wiggins and J. M. Ottino, “Foundations of chaotic mixing,” Phil. Trans. R. Soc. Lond. A 362, 937 (2004).
- (29) E. Villermaux, A. D. Stroock, and H. A. Stone, “Bridging kinematics and concentration content in a chaotic micromixer,” Phys. Rev. E 77, 015301 (2008).
- (30) C. Jung, T. Tél, and E. Ziemniak, “Application of scattering chaos to particle transport in a hydrodynamical flow,” Chaos 3, 555 (1993).
- (31) A. Péntek, Z. Toroczkai, T. Tél, C. Grebogi, and J. A. Yorke, “Fractal boundaries in open hydrodynamical flows: Signatures of chaotic saddles,” Phys. Rev. E 51, 4076 (1995).
- (32) J. C. Sommerer, H.-C. Ku, and H. E. Gilreath, “Experimental evidence for chaotic scattering in a fluid wake,” Phys. Rev. Lett. 77, 5055 (1996).
- (33) A. Péntek, G. Károlyi, I. Scheuring, T. Tél, Z. Toroczkai, J. Kadtke, and C. Grebogi, “Fractality, chaos and reactions in imperfectly mixed open hydrodynamical flows,” Physica A 274, 120 (1999).
- (34) T. Tél, G. Károlyi, A. Péntek, I. Scheuring, Z. Toroczkai, C. Grebogi, and J. Kadtke, “Chaotic advection, diffusion, and reactions in open flows,” Chaos 10, 89 (2000).
- (35) E. Ott and T. Tél, “Chaotic scattering: An introduction,” Chaos 3, 417 (1993).
- (36) R. Bowen, “-limit sets for axiom a diffeomorphisms,” J. Diffl Equat. 18, 333 (1975).
- (37) D. Auerbach, P. Cvitanović, J.-P. Eckmann, G. Gunaratne, and I. Procaccia, “Exploring chaotic motion through periodic orbits,” Phys. Rev. Lett. 58, 2387 (1987).
- (38) S. Ghosh, A. Leonard, and S. Wiggins, “Diffusion of a passive scalar from a no-slip boundary into a two-dimensional chaotic advection field,” J. Fluid Mech. 372, 119 (1998).
- (39) T. Tél, A. de Moura, C. Grebogi, and G. Károlyi, “Chemical and biological activity in open flows: A dynamical system approach,” Physics Reports 413, 91 (2005).
- (40) Z. Neufeld and T. Tél, “Advection in chaotically time-dependent open flows,” Phys. Rev. E 57, 2832 (1998).
- (41) K. Shariff, A. Leonard, and J. H. Ferziger, “Dynamical systems analysis of fluid transport in time-periodic vortex ring flows,” Phys. Fluids 18, 047104 (2006).
- (42) J. D. Farmer, E. Ott, and J. A. Yorke, “The dimension of chaotic attractors,” Physica D 7, 153 (1983).
- (43) F. Pigeonneau, private communication, 2005.
- (44) E. Gouillart, Ph.D. thesis, “A study of chaotic mixing in rod-stirring devices, in closed and open flows,” Université Pierre et Marie Curie, Paris, 2007.
- (45) G. K. Batchelor, “Small-scale variation of convected quantities like temperature in turbulent fluid: Part 1. General discussion and the case of small conductivity,” J. Fluid Mech. 5, 113 (1959).
- (46) G. A. Voth, T. C. Saint, G. Dobler, and J. P. Gollub, “Mixing rates and symmetry breaking in two-dimensional chaotic flow,” Phys. Fluids 15, 2560 (2003).
- (47) T. Tél, in Directions in Chaos, edited by H. B. Lin (World Scientific, Singapore, 1990), Vol. 3, pp. 149–221.
- (48) P. V. Danckwerts, “Continuous flow systems-distribution of residence times,” Chem. Eng. Sci. 2, 1 (1953).
- (49) K. G. Denbigh and J. C. R. Turner, Chemical reactor theory: an introduction (Cambridge University Press, Cambridge, U.K., 1984).
- (50) J.-L. Thiffeault, “Scalar Decay in Chaotic Mixing,” in Transport in Geophysical Flows: Ten Years After. Proceedings of the Gran Combin Summer School, Valle d’Aosta, Italy, 14–24 June 2004 (Springer Verlag, Berlin, in press), http://arxiv.org/abs/nlin/0502011.
- (51) A. Wonhas and J. C. Vassilicos, “Mixing in fully chaotic flows,” Phys. Rev. E 66, 051205 (2002).
- (52) E. Ott and T. M. Antonsen, “Fractal measures of passively convected vector fields and scalar gradients in chaotic fluid flows,” Phys. Rev. A 39, 3660 (1989).
- (53) T. M. Antonsen and E. Ott, “Multifractal power spectra of passive scalars convected by chaotic fluid flows,” Phys. Rev. A 44, 851 (1991).
- (54) T. Tél, J. Vollmer, and W. Breymann, “Transient chaos: the origin of transport in driven systems,” Europhys. Lett. 35, 659 (1996).
- (55) J. Schneider, T. Tél, and Z. Neufeld, “Dynamics of ”leaking” Hamiltonian systems,” Phys. Rev. E 66, 66218 (2002).
- (56) R. T. Pierrehumbert, “Lattice models of advection-diffusion,” Chaos 10, 61 (2000).
- (57) R. L. Adler, “Symbolic dynamics and Markov partitions,” Bull., new ser., Am. Math. Soc. 35, 1 (1998).
- (58) A. Katok and B. Hasselblatt, Introduction to the Modern Theory of Dynamical Systems (Cambridge University Press, Cambridge, U.K., 1995).
- (59) D. Beigie, A. Leonard, and S. Wiggins, “A global study of enhanced stretching and diffusion in chaotic tangles,” Phys. Fluids 3, 1039 (1991).
- (60) P. L. Boyland, H. Aref, and M. A. Stremler, “Topological fluid mechanics of stirring,” J. Fluid Mech. 403, 277 (2000).
- (61) H. G. Solari and M. A. Natiello, “Minimal periodic orbit structure of 2-dimensional homeomorphisms,” Journal of Nonlinear Science 15, 183 (2005).
- (62) S. C. Jana, G. Metcalfe, and J. M. Ottino, “Experimental and computational studies of mixing in complex stokes flows: the vortex mixing flow and multicellular cavity flows,” J. Fluid Mech. 269, 199 (1994).
- (63) G. M. Zaslavsky, “Chaos, fractional kinetics, and anomalous transport,” Phys. Rep. 371, 461 (2002).
- (64) A. E. Motter, A. P. S. de Moura, C. Grebogi, and H. Kantz, “Effective dynamics in hamiltonian systems with mixed phase space,” Phys. Rev. E 71, 036215 (2005).