Probing helium interfaces with light scattering : from fluid mechanics to statistical physics
Abstract
We have investigated the formation of helium droplets in two physical situations. In the first one, droplets are atomised from superfluid or normal liquid by a fast helium vapour flow. In the second, droplets of normal liquid are formed inside porous glasses during the process of helium condensation. The context, aims, and results of these experiments are reviewed, with focus on the specificity of light scattering by helium. In particular, we discuss how, for different reasons, the closeness to unity of the index of refraction of helium allows in both cases to minimise the problem of multiple scattering and obtain results which it would not be possible to get using other fluids.
pacs:
67.25.bfNormal phase of 4He : Transport, hydrodynamics and 67.25.bhFilms and restricted geometries and 47.80.JkFlow visualization and imaging and 47.55.-tMultiphase and stratified flows and 67.25.dgSuperfluid phase of 4He : Transport, hydrodynamics, and superflow1 Introduction
Light scattering is a widely used tool to investigate problems in soft matter physics. In many instances, multiple scattering turns out to be a problem. During the last twenty years, significant progresses in dealing with and even exploiting multiple scattering have been made. Locating objects inside turbid media has been shown to be possible by measuring the staticdenOuter:93 or dynamic scattered intensity. In particular, the so-called dynamic wave spectroscopyMaret1987 ; Pine1988 enables the visualisation of flowsHeckmeier1996 or the location of absorbing objects Heckmeier1997 inside multiple-scattering liquids. However, imaging under multiple scattering conditions is challenging and information provided by such techniques remains limited compared to those obtained by single scattering. This explains why a great deal of effort has been devoted to the suppression or the minimisation of multiple scattering in dense soft-matter systems. A first example is the study of the glass transition in colloidal suspensions of silica and copolymer spherical particlesVanMegen1998 . Here, the solvent index of refraction is matched to that of the copolymer particles, so that scattering only arises from the silica particles. Their volume fraction is small enough (2%) to study their dynamics using quasi-elastic light single scattering (the small amount of multiple scattering being eliminated by two-colour cross-correlation Segre1995 ). A second example is the study of phase separation of binary mixtures in the presence of a disordered environment, provided by confining the mixture inside a porous mediumMaher1984 ; Dierker1991 ; Frisken1995 . Near the critical point, the density fluctuations give rise to multiple scattering which is minimised by careful choice of the refractive index of the fluids with respect to that of the substrate (e.g. isobutyric acid and water in silica aerogels Frisken1995 ).
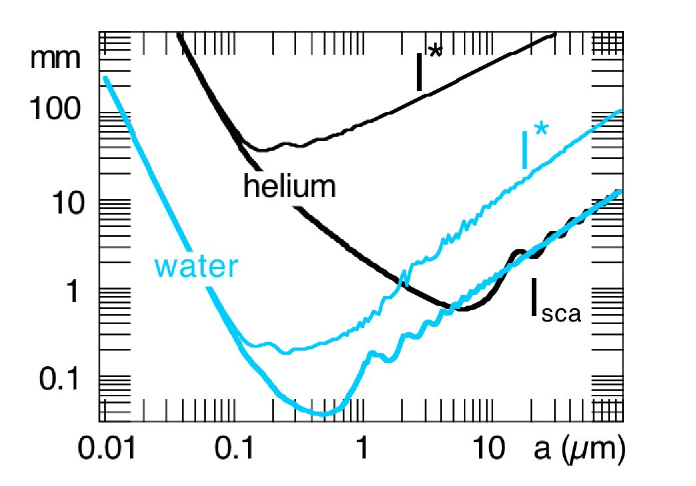
Such an index matching does not occur when one considers a diphasic pure fluid. In this case, the optical contrast between the vapour and the liquid phases is solely fixed by the ratio of their densities and cannot be tuned. This makes the optical study of diphasic systems prone to the occurrence of multiple scattering. From this point of view, helium is a remarkable exception. Due to its small size and closed shell electronic structure, its polarisability is very low and its index of refraction close to 1. For liquid helium below 2 K (density of 145 kg/m3), the dielectric permitivity is 1.057McCarty , and the index of refraction 1.028. This implies that the scattering cross-section for scatterers much smaller than the light wavelength is very small, so that multiple scattering barely occurs. The situation for larger scatterers is more subtle. In the regime of geometrical optics, the scattering cross section is approximately twice the geometrical cross-section (diffraction and reflection/refraction contributing nearly equallyvandehulst ), so that, at a given volume fraction, the scattering mean free path decreases with the particle diameter (figure 1), and reaches a minimum for a particle radius of about 10 m. Even for moderate volume fractions (10-3), it can become smaller than a light path length of 1 cm, giving rise to multiple scattering. However, the small refractive index of helium implies that the scattering is nearly forward in this case. Figure 1 shows that, for droplets of liquid helium, the transport mean free path is then more than two orders of magnitude larger than the scattering mean free path . As we will show, this peculiar situation makes imaging possible even through samples much larger than .
In this paper, we will describe two physical situations where we take full advantage of the low refractive index of helium. The first one is the study of atomisation of normal or superfluid liquid helium by a fast vapour flow. The droplets created through this process range from microns to tens of microns, so that geometrical optics applies. Even when the droplets density becomes large, observation at appropriate angles allows to determine their spatial distribution, and to analyse the influence of the physical characteristics of helium on the atomisation process. The second situation is the condensation and evaporation of helium inside porous silica glasses of different topologies, Vycor and silica aerogels. Both processes involve fluctuations of the helium density on a submicronic scale, which can be probed by spatially resolved light single scattering. This provides information on the size of the microscopic heterogeneities and their macroscopic distribution, which can both be compared to the predictions of the existing models for the condensation and evaporation processes.
2 The case of large scatterers : Atomisation of liquid helium
2.1 The Cryoloop experiment
Blowing a fast enough gas stream parallel to the free surface of a liquid results in the liquid atomisation into a spray of droplets. The Cryoloop experiment aims at studying this process for diphasic helium in a horizontal pipe. The liquid can be either normal or superfluid, depending on the temperature, and the gas is helium vapour at the saturated vapour pressure. The interest of this experiment is two-fold. First, diphasic flows of helium can be used for refrigeration purposes, an example (below the atomisation threshold) being the cooling of the superconducting magnets of the Large Hadron Collider, and it is important to assay the conditions and consequences of atomisation. Second, the physical parameters relevant for atomisation are very different for diphasic helium and for the widely studied air-water system (see table 1), which offers an opportunity to experimentally test the influence of these parameters on the atomisation process.
| fluids | |||||
|---|---|---|---|---|---|
| (kg/m3) | (kg/m3) | (Pa.s) | (Pa.s) | (mJ/m2) | |
| He 1.8 K | 145 | 0.48 | 1.3 | 0.43 | 0.316 |
| He 2.0 K | 145 | 0.79 | 1.5 | 0.52 | 0.301 |
| He 2.2 K | 146 | 1.25 | 2.6 | 0.57 | 0.284 |
| He 2.6 K | 144 | 2.55 | 3.3 | 0.69 | 0.253 |
| Water/air | 1000 | 1.2 | 1000 | 17 | 70 |
The Cryoloop facility is installed at the Service des Basses Températures at CEA-Grenoble. A specially developed refrigeratorRoussel05 with large cooling power (400 W at 1.8 K) is used to deliver a flow of liquid of up to approximately 20 g/s (i.e. more than 400 litres of liquid per hour) to one end of a nearly horizontal, 10 m long and 40 mm inner diameter, pipe. This liquid is partly evaporated by a heater in order to obtain downstream an essentially stratified diphasic flow in which the bulk liquid moves along the bottom of the pipe, and the vapour moves above the liquid. At the end of the pipe, the remaining liquid is evaporated, and the resulting vapour is pumped through cold compressors followed by a room temperature pump, which sets the pressure, hence the temperature, inside the pipe.
At a given applied power (i.e. a given mass flow rate of vapour), the vapour velocity depends on the cross-section of the pipe accessible to the vapour and on its density. In our experiments, the former is essentially the whole cross-section of the pipe, so that the ultimate maximal (mean) vapour velocity decreases with increasing temperature (since the saturated vapour pressure, hence the vapour density, increases with temperature). In order to obtain atomisation, a part of the total flow has to be kept liquid, which makes the practical maximal velocity to depend on the amount of liquid left. Typically, for a liquid height of 3.5 mm (corresponding to a wetted fraction of the pipe of 20%), the maximal velocity decreases from 18 m/s at 1.8 K to 6 m/s at 2.5 K.
2.2 Visualisation of atomisation

In order to observe the droplets created by the atomisation process, the stainless steel pipe is replaced along a length of 13 cm by a Pyrex tube of identical inner diameter. This optical section is located close to the end of the pipe to ensure that the observed spray is fully developed. Viewports through the cryostat containing the pipe allow to illuminate and to detect the spray using room-temperature optical componentsDiMuoio01 . The spray distribution across the whole cross-section of the pipe can be observed by illuminating the pipe with a laser sheet propagating horizontally perpendicular to the pipe. A CCD located opposite to the laser source with respect to the pipe is used to image the illuminated section under a 15∘ angle, as shown in figure 2. With the same CCD, we also observe the light scattered at 90∘ from a laser beam propagating vertically along the pipe diameter, which allows to compare scattering at two angles along this particular light path.

A second optical access opens to a stainless steel portion of the pipe through small flat windows, centred on the pipe horizontal median plane. Shining a horizontal laser beam through these windows and visualising the scattered intensity on a screen located on the other side of the pipe allows to determine the angular dependence of the scattered intensity in a cone of about 10∘ around the forward direction. This enables to test the scattering regime, i.e. the size of the droplets, on the median plane of the pipe. Figure 3 shows that the scattering is strongly peaked in the forward direction. The measured angular dependence is that predicted by geometrical optics for scattering angles larger than 40 mrad, with a steep rise at smaller angles, associated with diffraction. The observation of refraction shows that the average diameter of droplets is larger than one micron. This is confirmed by both the angular range over which diffraction occurs and measurements with a Phase Doppler Particle Analyser (PDPA), which show that the average diameter is a few tens of microns, for all hydrodynamic conditions.
Being in the regime of geometrical optics implies that the scattered intensity (outside the diffraction peak) is directly proportional to the interfacial area , per unit total volume, of the droplets. This also holds for the scattering mean free path, since the total scattering cross section is twice the geometrical one (more precisely, there are oscillations with size, due to interference effects, of both quantities, but they are washed out by the average over the droplets size distribution). By comparing, for given conditions, the image of the mist with the attenuation of the horizontal beam used for measuring the angular dependence, we can determine the coefficient between the brightness of the images and , and thus, extract from any image the spatial dependence of (or, equivalently, of the local mean free path of light =2/).
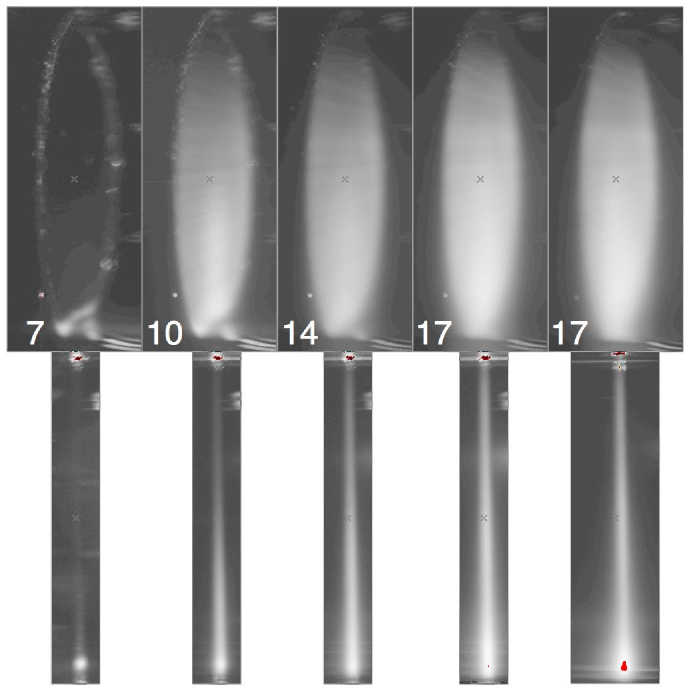
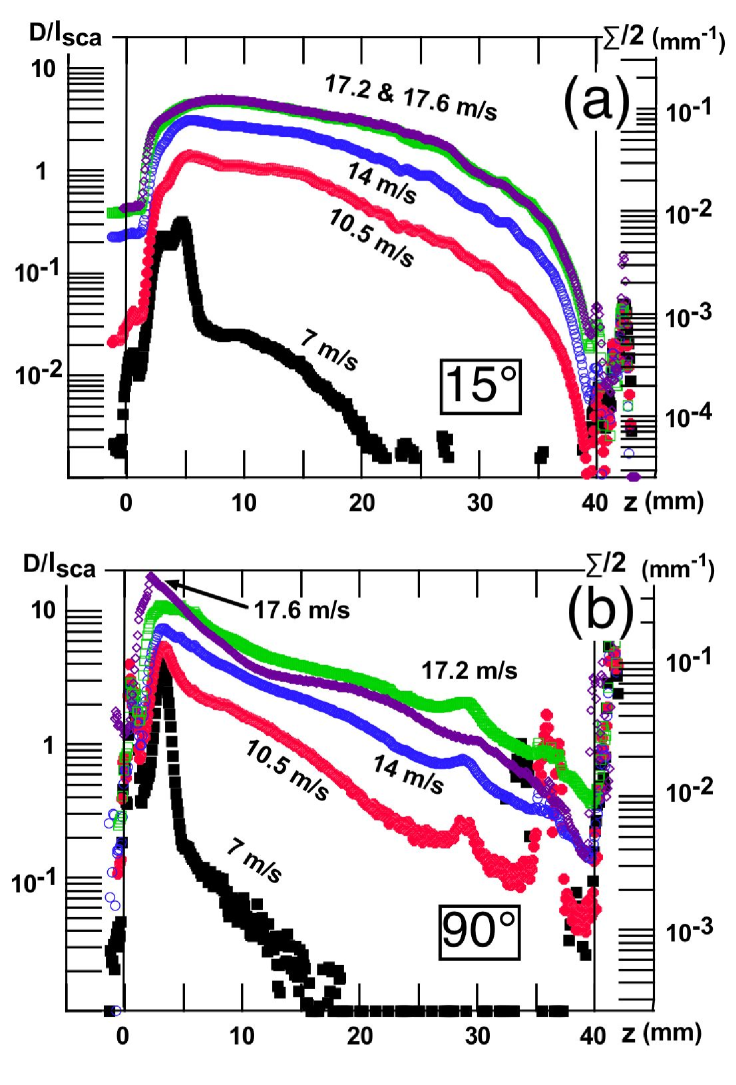
Figure 4 displays pictures separately recorded with laser sheet and vertical laser illumination for increasing vapour velocities, at constant bulk liquid level and vapour temperature. The obvious strong increase of atomisation with vapour velocity is quantified in figure 5, which shows the dependence of the interfacial area on the height inside the pipe, as deduced from both modes of illumination. The curves show that the mist is stratified over a characteristic height which increases with the vapour velocity. This stratification results from the competition between the diffusion of the droplets due to the vapour turbulence and their gravitational fall through the viscous vapourParas91b . The decrease of stratification with increasing vapour velocity can then be ascribed to the increase of the droplets turbulent diffusivity or to a decrease of their settling velocity due to a smaller size. Beyond this common behaviour, a striking difference between the two modes of illumination is that, in the bottom part of the tube ( mm), the interfacial intensity deduced from sheet illumination saturates while that deduced from the vertical laser still grows. This discrepancy occurs for values of the mean free path smaller than the pipe diameter (which is close to the distance travelled by the laser sheet, except very near the bottom of the pipe). This suggests that multiple scattering is involved. The question then arises of how the path of the vertical laser can be imaged in a region where the mean free path is as small as a tenth of the pipe diameter. A qualitative answer is that, because the transport mean free path for helium droplets is so much larger than the scattering mean free path, the light scattered at a large angle involves only one scattering event at (approximately) this angle, between two series of scattering events at small angle. However, it is not obvious whether this mechanism is more likely than a series of small-angle scattering events. In fact, as we now discuss, this depends not only on the ratio of the transport mean free path to the scattering mean free path , but also Ladam01 on the shape of the phase function, which describes the angular dependence of the scattered intensity for one scattering event.
2.3 The multiple scattering of light by helium droplets
The scattered intensity by a spherical droplet only depends on the angle between the incident and the scattered directions, and is described by the phase function cos , the probability distribution of after one scattering event, multiplied by . The probability distribution after scattering events is obtained by successive convolutions of . These convolutions amount to multiplications if and are expanded on Legendre polynomials :
| (1) |
| (2) |
with :
| (3) |
This allows to compute for any given initial distribution 111One should stress that this represents the angular distribution of the light, when summed over all possible positions after the scattering events, i.e. the exact equation 2 does not give any information on the spatial distribution of intensity, in contrast to the full radiative transfer equationvandehulst-book .. A particular case is that of the phase functions corresponding to coefficients given by :
| (4) |
where , and , the average of cos over the distribution (cos ). Note that , and that strong forward scattering corresponds to close to 1. These phase functions have a functional form stable under the convolution process. Special cases are =1 and =2, corresponding respectively to the Henyey-Greenstein (H-G) phase function HGorig :
| (5) |
and to a nearly Gaussian distribution (the true Gaussian distribution corresponds to ). In both cases, the angular dependence after scattering events is given by the same functional form, with .
For small angular width and scattered angles, the H-G function is closely similar to a 2D Lorentzian distribution around the forward direction. For a given half width at half maximum (HWHM) , the large “wings” of such a distribution result in an r.m.s. value much larger than , , of order This is in contrast with the Gaussian phase function of same for which the HWHM is of order . As first pointed out by Van de Hulstvandehulst1996 , this implies that the H-G phase function behaves very differently from the Gaussian phase function of same under multiple scattering. In both cases, implies that scales with , but the characteristic width for the H-G case increases linearly with , i.e. much faster than in the Gaussian case (). As shown by figure 6(a), for , intermediate between the H-G and the Gaussian cases, scales as , suggesting that the general behaviour is of the form , although we have not proven it analytically.
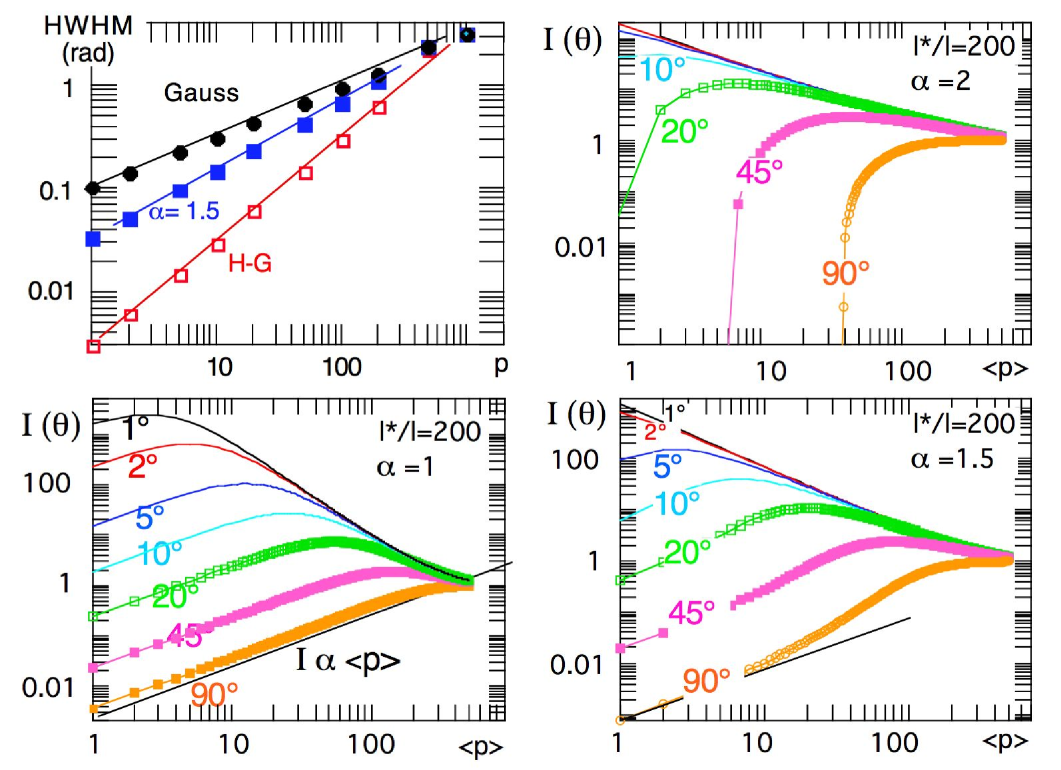
Equation 2 also gives the behaviour at large angles. Figures 6(b), 6(c), 6(d) show how the intensity multiply scattered at various angles varies with the average order of scattering , for a value of , a ratio close to that for helium, and respective values of of 1, 1.5, 2. Here, is the average number of scattering events, and the corresponding multiply scattered phase function is obtained by summing equation 2 over all , with a weight given by the Poisson distribution associated with Ladam01 . In all cases, the intensity is transferred from small to large angles until it is completely isotropized, but the way this isotropization takes place strongly depends on the angular shape of the original phase function, i.e. on . In the Gaussian case, the intensity at large angles only comes from the accumulation of small single-scattering events : the larger the angle, the larger the number of events needed to give some signal at this angle. In contrast, for the H-G case, the signal at large angles (compared to the HWHM of the original phase function) initially grows linearly with , whatever the angle. This implies that it comes from one large angle single-scattering event separating two sequences of small-angle scattering events, which nearly preserve the direction of propagation. Because the large angle single-scattering event can occur at any scattering step, the intensity is indeed proportional to , the total number of steps. The range of validity of this regime increases with the observation angle, and reaches about 200 scattering events at 90∘. At this angle, a pseudo single-scattering behaviour can be observed over a distance of order the transport mean path. The extension of the pseudo single-scattering regime depends on the shape of the phase function. Figure 6(d) shows that this regime still exists for =1.5, but in a smaller range(10, for angles 20∘).
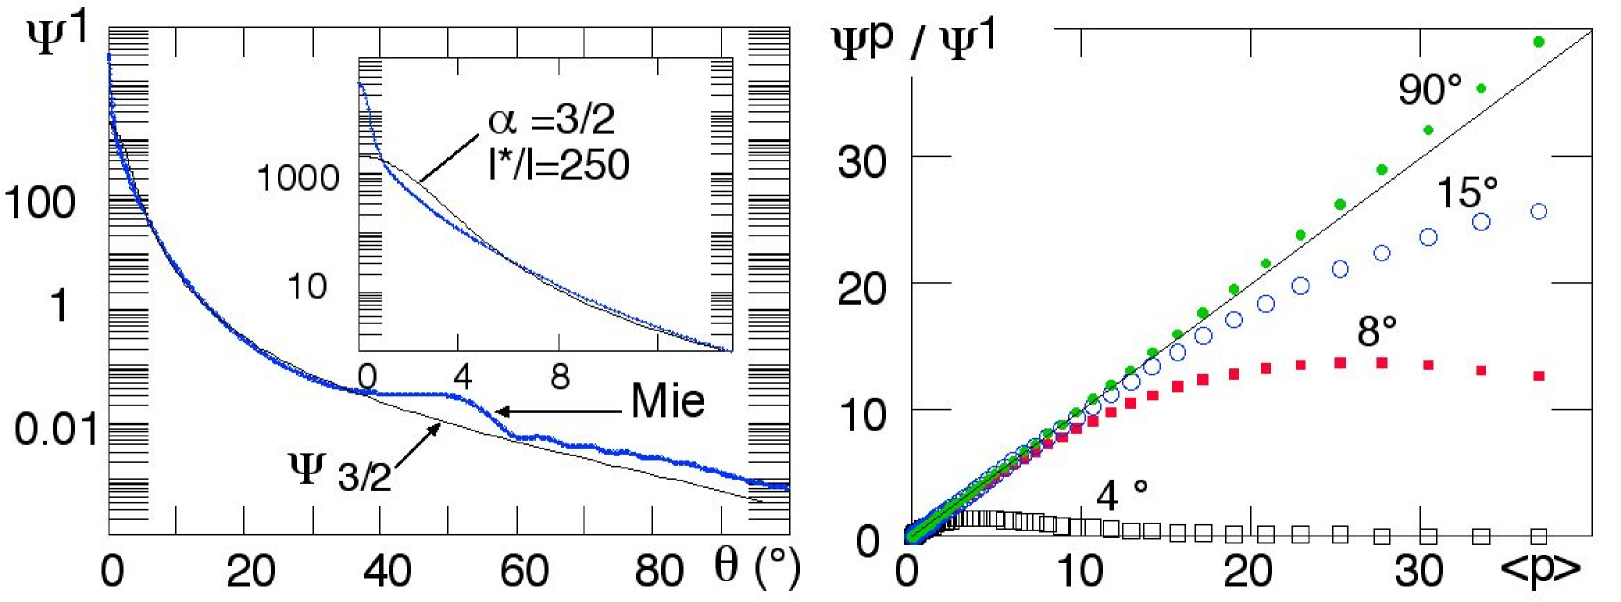
What about the real case of helium ? Figure 7(a) shows the Mie phase function for a realistic distribution of helium droplets. The pronounced decay with angle is approximately accounted for by classical refraction, below its maximal angle of deviation (), and by reflections above, the bump around 45∘ being due to the rainbow effect. The rise at small angles (inset) is due to diffraction, or, more precisely, anomalous scatteringvandehulst . The Mie phase function is approximately represented by for =250, so what we expect a behaviour similar to that of figure 6(d). This can be checked by numerical computation of the coefficients in this case and use of equation 2 to obtain the intensity multiply scattered at various angles as a function of the order of scattering . Figure 7(b) confirms our expectation of a linear dependance in , over a range which increases with the observation angle. In practice, we expect the pseudo single-scattering effect to hold up to 10 scattering events for an observation angle of (case of the sheet illumination) and up to 30 scattering events for an observation angle of (case of the vertical laser).
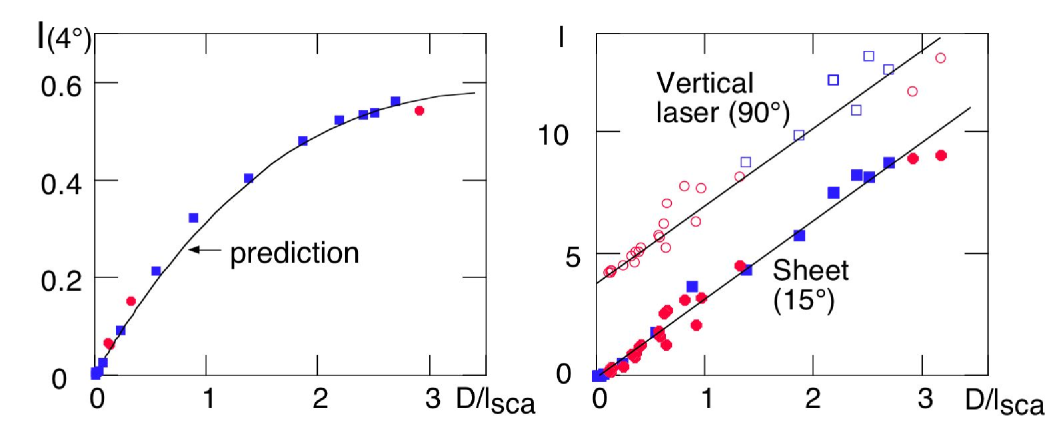
In our experiment, we have tested these calculations up to by comparing the intensity scattered from the pipe horizontal median plane to the average number of scattering events deduced from the attenuation of the horizontal laser beam. Figure 8(a) shows that the intensity scattered at as measured on the screen (figure 3) in not linear with . Its dependence is well accounted for by our calculation. In contrast, figure 8(b) shows that the intensity scattered at and as measured on the images using sheet and vertical laser illumination, respectively, linearly depends on , as expected.
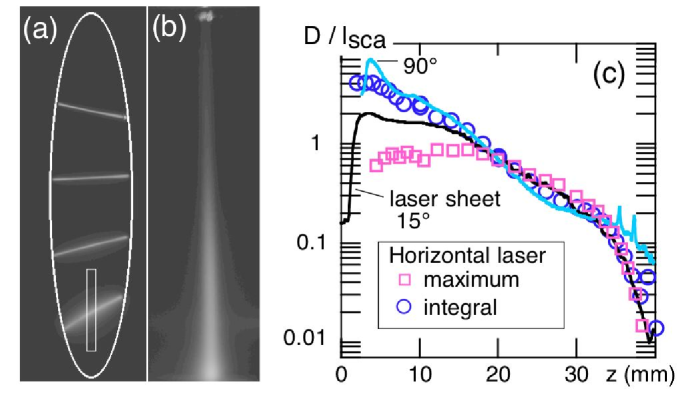
Based on figure 7(b), we would expect the sheet illumination to give the same interfacial area as the vertical laser for values of of order 10. Figure 5 shows that this is not the case. This disagreement is related to the fact that our calculation predicts the total intensity scattered, but not where it does come from. Small scattering-angle events widen the incident beam, which spreads the signal on the CCD over a larger region than for simple scattering. This effect is clearly visible on the figure 9 in the bottom of the pipe, both with the vertical laser beam, and with an horizontal one. Thus, measuring the local interfacial area from the brightness of a pixel on the axis of the horizontal laser beam leads to underestimate it. As shown by figure 9(c), the larger the interfacial area (i.e. the closer to the bottom of the pipe), the larger the underestimation. The error made with the sheet illumination is less than with the horizontal laser beam, because the spreading of light outside a given pixel is partly compensated by the spreading from lower or larger heights. However, unlike with the sheet, a valid measurement of the interfacial area remains possible with the horizontal laser beam by integrating the optical signal over the laser whole effective width, as shown in figure 9(c) (such an integration was also performed to obtain the points of figure 5(b)). In this way, the interfacial area deduced from the scattering at is consistent with that deduced at .
To summarise this section, we have shown that meaningful measurements of the interfacial intensity are possible with helium, even in a regime of quite strong scattering, provided that one observes at a large angle enough and one takes into account the widening of the beam due to multiple scattering. This advantage of helium was crucial to our optical measurements of developed atomisation.
2.4 Atomisation threshold and stratification
The combination of optics with the 400 W refrigerator capabilities enabled us to study the dependence of the atomisation process on three parameters : the level of liquid in the pipe, the vapour velocity, and the temperature, the latter setting the density of the vapour, and the state of the liquid (superfluid below 2.17 K, normal above). The resultsThesePerraud will be described elsewherePerraud2008 . In particular, we have characterised two properties which determine the potentialities of the atomised flow for refrigeration, the velocity threshold for atomisation, and, above this threshold, the mist stratification. In the following, we will describe these properties and compare them to those for the water-air system, so as to pinpoint the specificities of helium.

Let us first discuss the atomisation threshold, and its sensitivity to the superfluidity of the liquid. Figure 10 shows how the the PDPA counting rate increases with the vapour velocity at constant temperature and total flow-rate, both below and above the superfluid transition (1.8 K and 2.52 K). For both temperatures, droplets are detected on the pipe axis above the minimal velocity used, about 4 m/s. The exponential decrease of the counting rate at small velocities does not allow to extrapolate a velocity threshold from these measurements. The atomisation threshold was thus determined from pictures of the whole pipe section using sheet illumination. Droplets were detected above 3.40.4 m/s at 1.8 K, and 2.50.3 m/s at 2.52 K. These velocities are two to three times the Kelvin-Helmoltz threshold for wave formationGuyon91 , , where is the gravity acceleration, and the other quantities are defined in table 1. is 1.7 m/s at 1.8 K et 0.8 m/s at 2.52 K. They can also be compared to the Ishii-Grolmes criterionIshii75 for atomisation, which takes into account the effect of viscosity in a phenomenological way. It predicts a threshold of about 2.2 m/s at both temperatures, the smaller vapour density at 1.8 K being compensated for by the smaller viscosity. While it remarkably accounts for the threshold in the normal state, the Ishii-Grolmes criterion underestimates the threshold in the superfluid state, and, worse, predicts an atomisation threshold below the threshold for wave formation, showing that it overestimates the influence of a vanishing viscosity. In any case, our experiment shows that the influence of superfluidity on the atomisation threshold is at most limited. The threshold is lower than for the water-air system (where it typically lies in the range 10-15 m/s, depending on the pipe diameter and the liquid flow rate Ishii75 ; Williams96 ), but this can be mainly ascribed to the small density and surface tension of liquid helium, the product of which is about 1/2000 of that for water. As this product enters with a power 1/4, we also understand why the difference between helium and water remains nevertheless limited.
Above the atomisation threshold, a stratified mist is observed. Measurements at constant velocity show that the temperature (in the superfluid region) and liquid level do affect the degree of atomisation, but not the profile of stratification. This allows to study the effect of velocity on stratification by comparing experiments at different temperatures and flow rates.

Figure 11(a) shows the stratification profile for three temperatures in the normal region, as deduced from the intensity scattered at from the vertical laser, which we have shown in §2.3 to be the least sensitive to multiple scattering effects. The applied power being constant, the vapour velocity decreases with increasing vapour density, hence temperature. As in the superfluid phase, this implies a stronger stratification. For both figures 5 and 11, the profile is approximately exponential, so that we can quantify the stratification by the characteristic length such that exp. Figure 11(b) shows , measured above 10 mm, for the profiles of figures 5 and 11, as a function of the vapour velocity measured on the pipe axis with the PDPA. is found to follow an approximate dependence, similar to what we have extracted from droplets concentration profiles measured for the water-air systemPan02 .
For droplets of diameter small enough to follow the gas turbulence, , the ratio of the turbulent diffusivity to the droplets fall velocity . For isotropic turbulence, is expected to scale with the vapour velocity, so that . vary approximately as , suggesting that the droplets diameter decreases with the vapour velocity as , independent on the superfluid nature of the liquid. Also, since the stratification, at a fixed vapour velocity, does not depend on temperature, the droplet diameter should only weakly depend on the vapour density.
The decrease of diameter with increasing velocity is physically expected, although measurements in the water-air system generally find a stronger dependenceSimmons01 . However, this conclusion is at variance from the results of direct measurements of the diameter distribution on the pipe axis using the PDPAThesePerraud ; Perraud2008 . They show a nearly exponential size distribution, with an average diameter increasing with the vapour velocity (approximately from 20 to 40 m). Measurements at temperatures between 1.8 and 2.0 K show that the diameter dependence on vapour density follows a similar trend. Both points are inconsistent with the above analysis of the stratification. The reason for this discrepancy remains to be understood.
Despite this problem, the range of average diameters given by the PDPA (m) is consistent with the angular dependence of the intensity scattered at small angle (figure 3), and, independently, on the value of , combined with the concentration of droplets, as inferred from the PDPA count rate and velocity. These diameters are smaller than reported for the water-air interface. For example, for the latter system, Simmons and Hanratty Simmons01 report average diameters on the pipe axis decreasing from 60 to 35 m, for air velocities increasing from 30 to 50 m/s (i.e. two to three times the atomisation threshold). Here again, the difference probably stems from the very low surface tension of helium.
3 The case of small scatterers : condensation and evaporation of helium inside mesoporous glasses
3.1 Background
The phenomenon of condensation and evaporation of fluids in mesoporous media, i.e. with pores sizes falling in the nm-m range, is studied as an example of a phase transition in presence of disorder and confinementGelb99 , and used to characterise pore distributions. Both the condensation and evaporation processes involve the formation of domains of liquid or vapour on a microscopic scale. The associated fluctuations of optical index scatter light so that it is attractive to study the phenomenon in transparent porous media, such as silica glasses (Vycor, silica aerogels, …). However, in some instances, the length scale of the fluctuations can reach several hundreds of nanometers, impeding single-scattering measurements for usual fluids. This problem can be solved by using helium as a fluid. Figure 1 shows that, for helium droplets of diameter 200 nm, the mean free path remains larger than one millimetre even for an extrapolated volume fraction of 50%, allowing conventional light scattering measurements on a millimetre thick sample. This would not be possible for, e.g., water, where the mean free path for a similar distribution of droplets would be 200 times smaller. We have taken advantage of this specificity of helium to address several fundamental problems in the field using optical means.
The processes of condensation and evaporation are usually characterised by sorption isotherms, which measure the adsorbed amount of fluid as a function of increasing (for condensation) or decreasing (for evaporation) pressure. In the case where the dense phase of the fluid wets the substrate, one observes the reversible adsorption of a thin film at low vapour pressure, followed by capillary condensation, a rather abrupt filling at a pressure of order, but smaller, than the saturated vapour pressure. The later process is hysteretic, emptying occurring at a lower pressure than filling. A central question is the origin of this hysteresis. Different explanations invoke the metastability of the gas-like phaseBallEvansEL87 , changes in the shape of menisci between condensation and evaporationSaamColePRB75 , collective effects for networks of connected pores such as VycorMason88 , and, more recently, the energetic and geometric disorder of the porous mediaKierlik01 . A characteristic feature of the two last explanations is that condensation and evaporation differ in a fundamental way, which is the influence of nucleation. Unlike condensation, which can proceed from the adsorbed film, evaporation requires the nucleation of vapour in the dense phase, which involves an activation energy. If this process cannot occur, a pore cannot empty as long as its neighbours remain filled, so that desorption should take place through a collective percolation process starting from the surfaces of the sample.
These different explanations for hysteresis predict different shapes for the hysteresis loop. For example, the percolation mechanism should manifest through a sharp kink in the desorption isotherm at the percolation thresholdMason88 , followed by a nearly vertical portion, as observed in Vycor and other materials. Also, for weak enough disorder, the disorder-based mechanism predicts a change of shape, from smooth to steep, of the adsorption isotherm as the temperature is decreased below a critical valueKierlik01 . Still, measuring the shape of the loop only is ambiguous, and optical measurements allow to test more precisely the different mechanismes proposed. This is beautifully illustrated by the work of Page et al, who studied the condensation and evaporation of hexane in Vycor using light scattering222Note that, in this experiment, results were limited to pressures very close to the percolation threshold. For smaller pressures, multiple scattering was so large that no light was transmitted, in agreement with the discussion at the beginning of §3.1., and found long-range correlations in the vapour distribution, characteristic of a percolation process, close to the kink of the desorption isothermPagePRE95 . However, up to now, there were no systematic study of the correlation between the shape of the isotherms, and the distribution of fluid inside a porous medium, both at the microscopic and macroscopic levels. This is the aim of our experiments. In the following, we will illustrate the potential of our technique by several examples.
3.2 Experimental

We study different porous glasses, silica aerogels and Vycor, using an optical cryostat with optical ports 45∘ apart. The sample cell, 20 mm in diameter and 4 mm thick, has two sapphire windows, allowing observation under different scattering angles. Sorption isotherms are measured between 4.2 K and the critical bulk temperature (5.2 K), as described in Lambert04 and Cross07 . Simultaneously, the distribution of helium inside the sample is determined by light scattering measurements. To that aim, the sample is illuminated by a thin He-Ne laser sheet under a 45∘ incidence with respect to its faces, and imaged at different angles (45∘, 90∘, and 135∘) using CCD cameras, as illustrated on figure 12.
3.3 Evidence for a disorder-driven transition in silica aerogels
Recent numerical studiesKierlik01 ; Sarkisov02 , based on a mean-field density functional theory, suggest that hysteresis could result from the disorder of the porous media. They predict that a disorder-driven transition could occur as a function of disorder or temperature, similar to that occurring in the Random Field Ising Model at zero temperature Sethna . This out-of-equilibrium phase transition implies a change of shape, from smooth to steep, of the condensation branch of the hysteresis loop, when the porosity is increased at a constant temperature or, alternatively, when the temperature is decreased below some critical value, at a constant porosityDetcheverryE03 .

We have recently provided the first evidence for this transition in a base-catalyzed silica aerogelBonnet08 . In this sample (denominated B100), the silica forms a complex arrangement of interconnected strands, resulting in a large porosity (95%) and an associated weak disorder. For this porosity, the recent theoretical studies, performed on aerogels numerically synthesised by Diffusion Limited Cluster AggregationDetcheverryE03 , predict the occurrence of a disorder-driven transition. As shown by figure 13, the adsorption isotherms become steeper at low temperatures, which is indeed in agreement with the scenario of a disorder-driven transition, and cannot be explained by the usual description of the capillary condensation. The corresponding optical observations are shown in figure 14. At low adsorbed fraction (%), the scattered intensity increases uniformly, corresponding to the development of liquid domains on a microscopic scale (up to typically 200 nm, from the absolute value of the scattered intensity and its angular dependence). Above %, the behavior depends on temperature. For the low temperature points (corresponding to the steep isotherms), the injected helium completely fills some regions of the aerogel, making them dark. The size of these dark regions increases up to the point where the whole aerogel is filled. In contrast, at temperatures where the isotherm is smooth, the condensation proceeds in an homogeneous way. As discussed in detail in ref.Bonnet08 , these observations are consistent with the occurrence of a disorder-driven phase transition.
3.4 Absence of long-range correlations during desorption
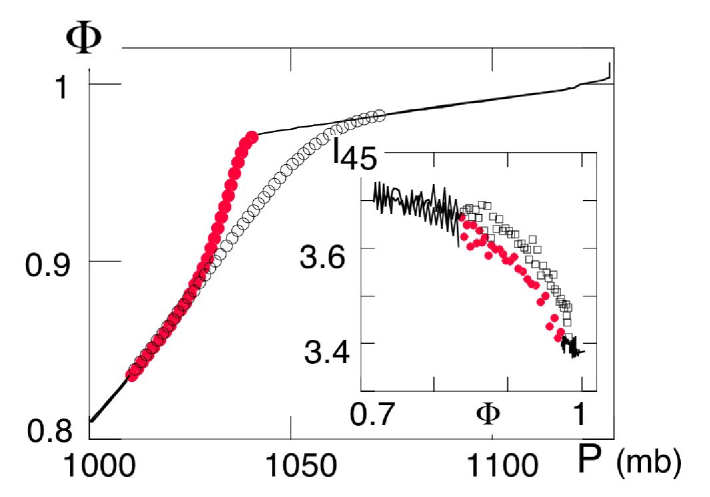

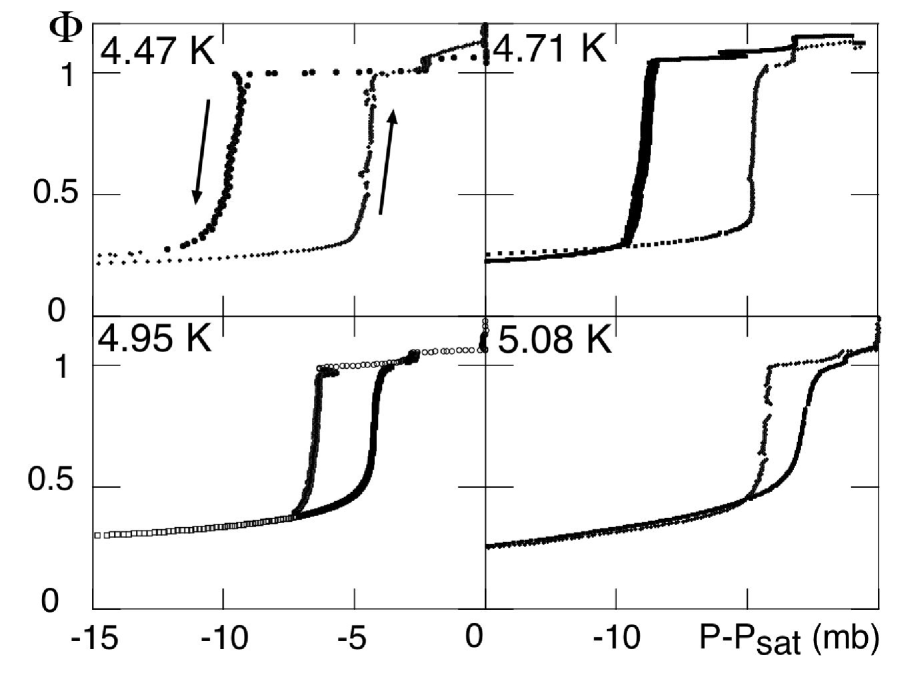
We have also studied the behavior during desorptionBonnet08b . In order to compare to the experiment of Page et al, we have studied a sample of Vycor. At the lowest temperature presently achievable with our set-up (4.3 K), the desorption isotherm does not have an initial vertical portion (figure 15), in contrast with the situation at lower temperaturesBrewer62 . The scattered intensity decreases monotonously from the empty state to the filled state. This means that, unlike in aerogels, the initial adsorption of the film decreases, instead of increases, the scattered intensity. This is related to the difference in porosities. For the aerogels, the silica concentration is small (several %). Adding more silica or a film of helium on the surface of the filaments increases the scattered field. In contrast, for Vycor, the silica concentration is large (70%), so that one might see the scattering as originating from the cavities. Reducing the cavity size decreases the scattered signal, and so does the addition of an helium film. More surprizingly, the scattered signal never exceeds its value in the empty state, even along the hysteresis loop where it is slightly larger for adsorption than for desorption (inset of figure 15). This implies that no microdomains are formed on the scale of the hundred of nanometers. Moreover, there is no evidence for the long-range correlations during desorption which would sign a percolation process. On the other hand, the kink in the desorption isotherm is not a sharp one, so that our Vycor experiment does not rule out the usual hypothesis of a correlation between the desorption mechanism and the shape of the desorption isotherm.
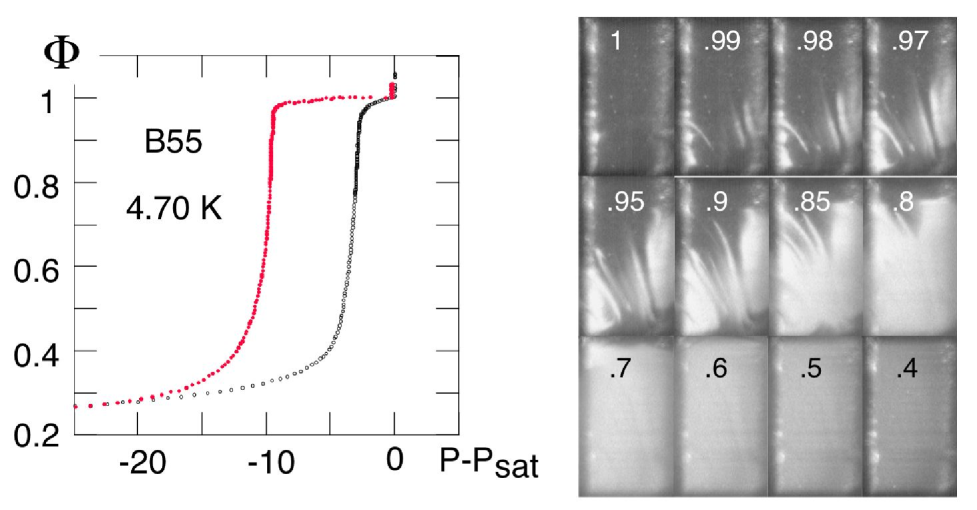
What about aerogels? In this case, the desorption iso-therms present a vertical portion for all temperatures (figure 13). The same holds for the two other aerogels described in ref.Bonnet08 , which have different microstructures and porosities. Based on the above hypothesis, one would conclude that a percolation process is at play. Figure 16 shows pictures of the desorption process for the previous sample. When the adsorbed fraction starts to decrease (corresponding to the kink in the isotherms), bright regions appear, demonstrating the apparition of vapour “bubbles” at the microscopic scale. In the initial stage of emptying, these regions are located close to the surfaces of the aerogel, (i.e. near the bright lines marking the back and front surfaces, and on the bottom part of the aerogel). The same conclusions apply to the other aerogels. For example, figure 17 shows the desorption process for a base-catalyzed sample of porosity 97.5% (B55). Desorption initially occurs along some “fingers”, some of which distinctly originate from the aerogel surfaces. This points to a specific role of surface during the desorption process, seemingly consistent with the percolation scenario.
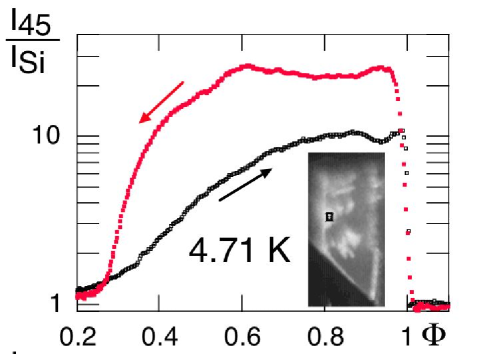
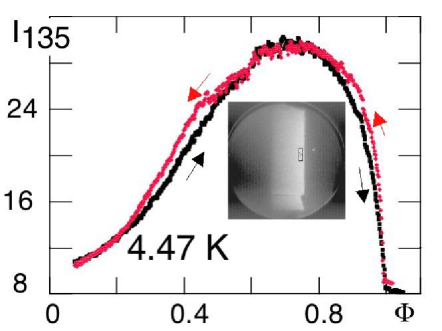
In this scenario, one expects a large increase of scattering with respect to the case of condensation, as observed for hexane in VycorPagePRE95 . However, for all three samples studied, we found no evidence for such an increase. This is illustrated by figures 18 and 19. Figure 18 shows, for the base-catalyzed sample B100, the intensity scattered at 45∘ from a point close to the surface, where the bright regions first appear during desorption. At a given average adsorbed fraction, the signal during evaporation is somewhat larger than during condensation, but by a factor less than 3, which can be explainedBonnet08b by a modest increase in size (typically 40%) of the correlated domains. The case of the neutrally-catalysed sample (N102) is even more spectacular. Despite a sharp kink in the desorption isotherm, the optical signal shown in figure 19 is nearly reversible as a function of . The same results hold for all temperatures, and for B55, which means that, for all three aerogels, desorption does not involve much longer length scales than adsorption333This contrasts with the results of neutron scattering studies for aqueous gelsLi94 . However, the length scales probed in that case did not exceed a few tens of nm, an order of magnitude smaller than those we probe.. To our knowledge, these results are the first evidence that the kink in the desorption isotherm does not necessarily follow from a percolation process.

3.5 Testing the occurrence of nucleation
The absence of long-range correlations for B100 contrasts with the predictions of the mean-field density functional approach. Numerical calculations of the structure factor for a base-catalysed aerogel of porosity 87% predict that the scattering during desorption should be much larger than during adsorptionDetcheverryE06 . A possible explanation would be that, in the real aerogel, thermal activation, which is neglected in the numerical studies, could allow to overcome the nucleation barrier. If this were true, one should observe the apparition of vapour “bubbles”, hence of bright regions, in the bulk of the sample. For testing this issue, a single slice of the sample is not enough. For example, the bright “fingers” which appear in the middle of the laser sheet in figure 17 could be connected to the surfaces outside of the sheet plane. Detecting the occurrence of nucleation thus requires to reconstruct the whole 3D sample. This is possible by scanning the laser sheet parallel to itself and capturing the resulting images. In this way, one obtains a stack of parallel slices of the sample, which can be reconstructed using the freeware ImageJ ImageJ . Figure 20 shows B55, soon after the beginning of desorption. Several small bright regions can be identified as non-connected to the surfaces. If confirmed, this result will be an evidence for nucleation. Light scattering could then be used to study how the nucleation mechanism depends on the temperature and the microstructure of samples.
4 Conclusions
In this paper, we have shown how the weak optical contrast of helium droplets or bubbles allows to perform quantitative light scattering measurements on diphasic systems at large volumic fractions. We have exploited this property to study optically the atomisation of liquid helium and the gas-liquid phase transition in porous media. The original results obtained so far illustrate the richness of blending low temperature and soft matter physics, and will be a motivation to pursue this approach further.
5 Acknowledgments
We thank B. Cross, L. Guyon, T. Lambert, and E. Di Muoio for having contributed to our earlier results, and R. van Weelderen and P. Lebrun for useful discussions. We are grateful to CERN and ANR-06-BLAN-0098 for having respectively supported the Cryoloop and aerogels experiments.
References
- (1) P.N. den Outer, T.M. Nieuwenhuizen, A. Lagendijk, J. Opt. Soc. Am. A 10, 1209 (1993)
- (2) G. Maret, P.E. Wolf, Zeitschrift für Physik B65, 409 (1987)
- (3) D.J. Pine, D.A. Weitz, P.M. Chaikin, E. Herbolzheimer, Phys. Rev. Lett. 60, 1134 (1988)
- (4) M. Heckmeier, G. Maret, Europhys. Lett. 34, 257 (1996)
- (5) M. Heckmeier, G. Maret, Progr. Colloid Polym. Sci. 104, 12 (1997)
- (6) W. van Megen, T.C. Mortensen, S.R. Williams, J. Muller, Phys.Rev. E 58, 6073 (1998)
- (7) P.N. Segré, W. van Megen, P.N. Pusey, K. Schätzel, W. Peters, J. Mod. Opt. 42, 1929 (1995)
- (8) J.V. Maher, W.I. Goldburg, D.W. Pohl, M. Lanz, Phys. Rev. Lett. 53, 60 (1984)
- (9) S.B. Dierker, P. Wiltzius, Phys. Rev. Lett. 66, 1185 (1991)
- (10) B.J. Frisken, F. Ferri, D.S. Cannell, Phys. Rev. E 51, 5922 (1995)
- (11) R. McCarty, V. Arp, Adv. in Cryog. Eng. 35, 1465 (1990)
- (12) H. van de Hulst, Light scattering by small particules (John Wiley and Sons, New York (Dover paperback reprint, 1981), 1957)
- (13) S. van Sciver, Handbook of Cryogenic Engineering (Taylor and Francis, Philadelphia (USA), 1998)
- (14) M. Iino, M. Suzuki, A.J. Ikushima, J. Low Temp. Phys. 61, 155 (1985)
- (15) P. Roussel, A. Girard, B. Jager, B. Rousset, P. Bonnay, in Proceedings of the Cryogenic Engineering Conference-CEC, Keystone, 2005 AIP Conference Proceedings 823, 1420 (2006)
- (16) E. Di Muoio, B. Jager, L. Puech, B. Rousset, P. Thibault, R. van Weelderen, P.E. Wolf, in Proceedings of the Cryogenic Engineering Conference-CEC, Madison, 2001, Adv. in Cryo. Eng. 47 b, 1675 (2002)
- (17) S. Paras, A. Karabelas, Int. J. Multiphase Flow 17, 455 (1991)
- (18) Y. Ladam, P.E. Wolf, P. Thibault, L. Puech, Eur.Phys. J. A. P. 14, 137 (2001)
- (19) H. van de Hulst, Multiple Light Scattering, Vol. 2 (Academic Press, New York, 1980)
- (20) L.G. Henyey, J.L. Greenstein, Astrophys. J. 93, 70 (1941)
- (21) H. Van de Hulst, Reviews in Modern Astronomy 9, 1 (1996)
- (22) S. Perraud, Ph.D. thesis, Université Joseph-Fourier, Grenoble, 2007
- (23) S. Perraud, B. Rousset, P. Thibault, L. Puech, R. van Weelderen, P.E. Wolf (to be published)
- (24) E. Guyon, J.P. Hulin, L. Petit, Hydrodynamique physique (InterEditions-Editions du CNRS, 1991)
- (25) M. Ishii, M. Grolmes, AIChE Journal 21, 308 (1975)
- (26) L. Williams, L. Dykhno, T. Hanratty, Int. J. Multiphase Flow 22, 1 (1996)
- (27) L. Pan, T. Hanratty, Int. J. Multiphase Flow 28, 385 (2002)
- (28) M. Simmons, T. Hanratty, Int. J. Multiphase Flow 27, 861 (1998)
- (29) L.D. Gelb, K.E. Gubbins, R. Radhakrishnan, M. Sliwinska-Bartkowiac, Rep. Prog. Phys. 62, 1573 (1999)
- (30) P. Ball, R. Evans, Europhys. Lett. 4, 715 (1987)
- (31) W.F. Saam, M.W. Cole, Phys. Rev. B 11, 1086 (1975)
- (32) G. Mason, Proc. R. Soc. Lond. 415, 453 (1988)
- (33) E. Kierlik, P.A. Monson, M.L. Rosinberg, L. Sarkisov, G. Tarjus, Phys. Rev. Lett. 87, 055701 (2001)
- (34) J.H. Page, J. Liu, B. Abeles, E. Herbolzheimer, H.W. Deckman, D.A. Weitz, Phys. Rev. E 52, 2763 (1995)
- (35) F. Bonnet, T. Lambert, B. Cross, L. Guyon, F. Despetis, L. Puech, P.E. Wolf, Europhys. Lett. 82, 56003 (2008)
- (36) T. Lambert, C. Gabay, L. Puech, P.E. Wolf, J. Low Temp. Phys. 134, 293 (2004)
- (37) B. Cross, L. Puech, P.E. Wolf, J. Low Temp. Phys. 148, 903 (2007)
- (38) L. Sarkisov, P. Monson, Phys. Rev. E 65, 011202 (2001)
- (39) J.P. Sethna, K. Dahmen, S. Kartha, J.A. Krumhansl, B.W. Roberts, J.D. Shore, Phys. Rev. Lett. 70, 3347 (1993)
- (40) F. Detcheverry, E. Kierlik, M.L. Rosinberg, G. Tarjus, Phys. Rev. E 68, 061504 (2003)
- (41) F. Bonnet, T. Lambert, B. Cross, L. Guyon, F. Despetis, L. Puech, P.E. Wolf (to be published)
- (42) D.F. Brewer, D.C. Champeney, Proc. Phys. Soc. 79, 855 (1962)
- (43) J.C. Li, D.K. Ross, L.D. Howe, K.L. Stefanopoulos, J.P.A. Fairclough, R. Heenan, K. Ibel, Phys. Rev. B 49, 5911 (1994)
- (44) F. Detcheverry, E. Kierlik, M.L. Rosinberg, G. Tarjus, Phys. Rev. E 73, 041511 (2006)
- (45) ImageJ, http://rsb.info.nih.gov/ij/