Scientific Paper Summarization Using Citation Summary Networks
Abstract
Quickly moving to a new area of research is painful for researchers due to the vast amount of scientific literature in each field of study. One possible way to overcome this problem is to summarize a scientific topic. In this paper, we propose a model of summarizing a single article, which can be further used to summarize an entire topic. Our model is based on analyzing others’ viewpoint of the target article’s contributions and the study of its citation summary network using a clustering approach.
1 Introduction
It is quite common for researchers to have to quickly move into a new area of research. For instance, someone trained in text generation may want to learn about parsing and someone who knows summarization well, may need to learn about question answering. In our work, we try to make this transition as painless as possible by automatically generating summaries of an entire research topic. This enables a researcher to find the chronological order and the progress in that particular field of study. An ideal such system will receive a topic of research, as the user query, and will return a summary of related work on that topic. In this paper, we take the first step toward building such a system.
Studies have shown that different citations to the same article often focus on different aspects of that article, while none alone may cover a full description of its entire contributions. Hence, the set of citation summaries, can be a good resource to understand the main contributions of a paper and how that paper affects others. The citation summary of an article (), as defined in [Elkiss et al., 2008], is a the set of citing sentences pointing to that article. Thus, this source contains information about from others’ point of view. Part of a sample citation summary is as follows:
-
In the context of DPs, this edge based factorization method was proposed by (Eisner, 1996).
-
Eisner (1996) gave a generative model with a cubic parsing algorithm based on an edge factorization of trees.
-
Eisner (Eisner, 1996) proposed an parsing algorithm for PDG.
-
If the parse has to be projective, Eisner’s bottom-up-span algorithm (Eisner, 1996) can be used for the search.
The problem of summarizing a whole scientific topic, in its simpler form, may reduce to summarizing one particular article. A citation summary can be a good resource to make a summary of a target paper. Then using each paper’s summary and some knowledge of the citation network, we’ll be able to generate a summary of an entire topic. Analyzing citation networks is an important component of this goal, and has been widely studied before [Newman, 2001].
Our main contribution in this paper is to use citation summaries and network analysis techniques to produce a summary of a single scientific article as a framework for future research on topic summarization. Given that the citation summary of any article usually has more than a few sentences, the main challenge of this task is to find a subset of these sentences that will lead to a better and shorter summary.
1.1 Related Work
Although there has been work on analyzing citation and collaboration networks [Teufel et al., 2006, Newman, 2001] and scientific article summarization [Teufel and Moens, 2002], to the knowledge of the author there is no previous work that study the text of the citation summaries to produce a summary. [Bradshaw, 2003, Bradshaw, 2002] get benefit from citations to determine the content of articles and introduce “Reference Directed Indexing” to improve the results of a search engine.
In other work, [Nanba et al., 2004b, Nanba et al., 2004a] analyze citation sentences and automatically categorize citations into three groups using 160 pre-defined phrase-based rules. This categorization is then used to build a tool for survey generation. [Nanba and Okumura, 1999] also discuss the same citation categorization to support a system for writing a survey. [Nanba and Okumura, 1999, Nanba et al., 2004b] report that co-citation implies similarity by showing that the textual similarity of co-cited papers is proportional to the proximity of their citations in the citing article.
Previous work has shown the importance of the citation summaries in understanding what a paper says. The citation summary of an article is the set of sentences in other articles which cite . [Elkiss et al., 2008] performed a large-scale study on citation summaries and their importance. They conducted several experiments on a set of articles from the free PubMed Central (PMC) repository111 http://www.pubmedcentral.gov. Results from this experiment confirmed that the “Self Cohesion” [Elkiss et al., 2008] of a citation summary of an article is consistently higher than the that of its abstract.
| Cluster | Nodes | Edges | ||
|---|---|---|---|---|
| DP | 167 | 323 | ||
| PBMT | 186 | 516 | ||
| Summ | 839 | 1425 | ||
| QA | 238 | 202 | ||
| TE | 56 | 44 |
[Elkiss et al., 2008] also conclude that citation summaries are more focused than abstracts, and that they contain additional information that does not appear in abstracts. [Kupiec et al., 1995] use the abstracts of scientific articles as a target summary, where they use 188 Engineering Information summaries that are mostly indicative in nature. Abstracts tend to summarize the document’s topics well, however, they don’t include much use of metadata. [Kan et al., 2002] use annotated bibliographies to cover certain aspects of summarization and suggest guidelines that summaries should also include metadata and critical document features as well as the prominent content-based features.
Siddharthan and Teufel describe a new task to decide the scientific attribution of an article [Siddharthan and Teufel, 2007] and show high human agreement as well as an improvement in the performance of Argumentative Zoning [Teufel, 2005]. Argumentative Zoning is a rhetorical classification task, in which sentences are labeled as one of Own, Other, Background, Textual, Aim, Basis, Contrast according to their role in the author’s argument. These all show the importance of citation summaries and the vast area for new work to analyze them to produce a summary for a given topic.
| ACL-ID | Title | Year | CS Size | |
|---|---|---|---|---|
| DP | C96-1058 | Three New Probabilistic Models For Dependency Parsing: An Exploration | 1996 | 66 |
| P97-1003 | Three Generative, Lexicalized Models For Statistical Parsing | 1997 | 55 | |
| P99-1065 | A Statistical Parser For Czech | 1999 | 54 | |
| P05-1013 | Pseudo-Projective Dependency Parsing | 2005 | 40 | |
| P05-1012 | On-line Large-Margin Training Of Dependency Parsers | 2005 | 71 | |
| PBMT | N03-1017 | Statistical Phrase-Based Translation | 2003 | 180 |
| W03-0301 | An Evaluation Exercise For Word Alignment | 2003 | 14 | |
| J04-4002 | The Alignment Template Approach To Statistical Machine Translation | 2004 | 50 | |
| N04-1033 | Improvements In Phrase-Based Statistical Machine Translation | 2004 | 24 | |
| P05-1033 | A Hierarchical Phrase-Based Model For Statistical Machine Translation | 2005 | 65 | |
| Summ | A00-1043 | Sentence Reduction For Automatic Text Summarization | 2000 | 19 |
| A00-2024 | Cut And Paste Based Text Summarization | 2000 | 20 | |
| C00-1072 | The Automated Acquisition Of Topic Signatures For Text Summarization | 2000 | 19 | |
| W00-0403 | Centroid-Based Summarization Of Multiple Documents: Sentence Extraction, … | 2000 | 31 | |
| W03-0510 | The Potential And Limitations Of Automatic Sentence Extraction For Summarization | 2003 | 15 | |
| QA | A00-1023 | A Question Answering System Supported By Information Extraction | 2000 | 13 |
| W00-0603 | A Rule-Based Question Answering System For Reading Comprehension Tests | 2002 | 19 | |
| P02-1006 | Learning Surface Text Patterns For A Question Answering System | 2002 | 74 | |
| D03-1017 | Towards Answering Opinion Questions: Separating Facts From Opinions … | 2003 | 42 | |
| P03-1001 | Offline Strategies For Online Question Answering: Answering Questions Before They Are Asked | 2003 | 27 | |
| TE | D04-9907 | Scaling Web-Based Acquisition Of Entailment Relations | 2004 | 12 |
| H05-1047 | A Semantic Approach To Recognizing Textual Entailment | 2005 | 8 | |
| H05-1079 | Recognising Textual Entailment With Logical Inference | 2005 | 9 | |
| W05-1203 | Measuring The Semantic Similarity Of Texts | 2005 | 17 | |
| P05-1014 | The Distributional Inclusion Hypotheses And Lexical Entailment | 2005 | 10 |
2 Data
The ACL Anthology is a collection of papers from the Computational Linguistics journal, and proceedings from ACL conferences and workshops and includes almost papers. To produce the ACL Anthology Network (AAN), [Joseph and Radev, 2007] manually performed some preprocessing tasks including parsing references and building the network metadata, the citation, and the author collaboration networks.
The full AAN includes all citation and collaboration data within the ACL papers, with the citation network consisting of nodes and directed edges.
2.1 Clusters
We built our corpus by extracting small clusters from the AAN data. Each cluster includes papers with a specific phrase in the title or content. We used a very simple approach to collect papers of a cluster, which are likely to be talking about the same topic. Each cluster consists of a set of articles, in which the topic phrase is matched within the title or the content of papers in AAN. In particular, the five clusters that we collected this way, are: Dependency Parsing (DP), Phrased Based Machine Translation (PBMT), Text Summarization (Summ), Question Answering (QA), and Textual Entailment (TE). Table 1 shows the number of articles and citations in each cluster. For the evaluation purpose we chose five articles from each cluster. Table 2 shows the title, year, and citation summary size for the 5 papers chosen from each cluster. The citation summary size of a paper is the size of the set of citation sentences that cite that paper.
3 Analysis
3.1 Fact Distribution
We started with an annotation task on 25 papers, listed in Table 2, and asked a number of annotators to read the citation summary of each paper and extract a list of the main contributions of that paper. Each item on the list is a non-overlapping contribution (fact) perceived by reading the citation summary. We asked the annotators to focus on the citation summary to do the task and not on their background on this topic.
As our next step we manually created the union of the shared and similar facts by different annotators to make a list of facts for each paper. This fact list made it possible to review all sentences in the citation summary to see which facts each sentence contained. There were also some unshared facts, facts that only appear in one annotator’s result, which we ignored for this paper.
Table 3 shows the shared and unshared facts extracted by four annotators for P99-1065.
| Fact | Occurrences | |
|---|---|---|
| Shared | : “Czech DP” | 10 |
| : “lexical rules” | 6 | |
| : “POS/ tag classification” | 6 | |
| : “constituency parsing” | 5 | |
| : “Punctuation” | 2 | |
| : “Reordering Technique” | 2 | |
| : “Flat Rules” | 2 | |
| Unshared | “Dependency conversion” | |
| “80% UAS” | ||
| “97.0% F-measure” | ||
| “Generative model” | ||
| ‘Relabel coordinated phrases” | ||
| ‘Projective trees” | ||
| “Markovization” |
The manual annotation of P99-1065 shows that the fact “Czech DP” appears in 10 sentences out of all 54 sentences in the citation summary. This shows the importance of this fact, and that “Dependency Parsing of Czech” is one of the main contributions of this paper. Table 3 also shows the number of times each shared fact appears in P99-1065’s citation summary sorted by occurrence.
After scanning through all sentences in the citation summary, we can come up with a fact distribution matrix for an article. The rows of this matrix represent sentences in the citation summary and the columns show facts. A value in this matrix means that the sentence covers the fact. The matrix shows the fact distribution of P99-1065. IDs in each row show the citing article’s ACL ID, and the sentence number in the citation summary. These matrices, created using annotations, are particularly useful in the evaluation process.
3.2 Similarity Measures
We want to build a network with citing sentences as nodes and similarities of two sentences as edge weights. We’d like this network to have a nice community structure, whereby each cluster corresponds to a fact. So, a similarity measure in which we are interested is the one which results in high values for pairs of sentences that cover the same facts. On the other hand, it should return a low value for pairs that do not share a common contribution of the target article.
The following shows two sample sentences from P99-1065 that cover the same fact and we want the chosen similarity measure to return a high value for them:
-
So, Collins et al (1999) proposed a tag classification for parsing the Czech treebank.
-
The Czech parser of Collins et al (1999) was run on a different data set… .
Conversely, we’d like the similarity of the two following sentences that cover no shared facts, to be quite low:
-
Collins (1999) explicitly added features to his parser to improve punctuation dependency parsing accuracy.
-
The trees are then transformed into Penn Treebank style constituencies- using the technique described in (Collins et al, 1999).
We used P99-1065 as the training sample, on which similarity metrics were trained, and left the others for the test. To evaluate a similarity measure for our purpose we use a simple approach. For each measure, we sorted the similarity values of all pairs of sentences in P99-1065’s citation summary in a descending order. Then we simply counted the number of pairs that cover the same fact (out of such fact sharing pairs) in the top , and highly similar ones out of total pairs. Table 4 shows the number of fact sharing pairs among the top highest similar pairs.
| Measure | Top | Top | Top |
|---|---|---|---|
| tf-idf (General) | |||
| tf-idf (AAN) | |||
| LCSS | |||
| tf | |||
| tf2gen | |||
| tf-idf (DP) | |||
| Levenshtein |
Table 4 shows how cosine similarity that uses a tf-idf measure outperforms the others. We tried three different policies for computing IDF values to compute cosine similarity: a general IDF, an AAN-specific IDF where IDF values are calculated only using the documents of AAN, and finally DP-specific IDF in which we only used all-DP data set. Table 4 also shows the results for an asymmetric similarity measure, generation probability [Erkan, 2006] as well as two string edit distances: the longest common substring and the Levenshtein distance [Levenshtein, 1966].
4 Methodology
In this section we discuss our graph clustering method for article summarization, as well as other baseline methods used for comparisons.
4.1 Network-Based Clustering
The Citation Summary Network of an article is a network in which each sentence in the citation summary of is a node. This network is a complete undirected weighted graph where the weight of an edge between two nodes shows the similarity of the two corresponding sentences of those nodes.
The similarity that we use, as described in section 3.2, is such that sentences with the same facts have high similarity values. In other words, strong edges in the citation summary network are likely to indicate a shared fact between two sentences.
A graph clustering method tries to cluster the nodes of a graph in a way that the average intra-cluster similarity is maximum and the average inter-cluster similarity is minimum. To find the communities in the citation summary network we use [Clauset et al., 2004], a hierarchical agglomeration algorithm which works by greedily optimizing the modularity in a linear running time for sparse graphs.
To evaluate how well the clustering method works, we calculated the purity for the clusters found of each paper. Purity [Manning et al., 2008] is a method in which each cluster is assigned to the class with the majority vote in the cluster, and then the accuracy of this assignment is measured by dividing the number of correctly assigned documents by . More formally:
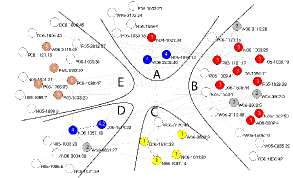
where is the set of clusters and is the set of classes. is interpreted as the set of documents in and as the set of documents in . For each evaluated article, Table 5 shows the number of real facts (), the number of clusters () and for each evaluated article. Figure 1 shows the clustering result for J04-4002, in which each color (number) shows a real fact, while the boundaries and capital labels show the clustering result.
| ACL-ID | #Facts | #Clusters | ||
|---|---|---|---|---|
| DP | C96-1058 | |||
| P97-1003 | ||||
| P99-1065 | ||||
| P05-1013 | ||||
| P05-1012 | ||||
| PBMT | N03-1017 | |||
| W03-0301 | ||||
| J04-4002 | ||||
| N04-1033 | ||||
| P05-1033 | ||||
| Summ | A00-1043 | |||
| A00-2024 | ||||
| C00-1072 | ||||
| W00-0403 | ||||
| W03-0510 | ||||
| QA | A00-1023 | |||
| W00-0603 | ||||
| P02-1006 | ||||
| D03-1017 | ||||
| P03-1001 | ||||
| TE | D04-9907 | |||
| H05-1047 | ||||
| H05-1079 | ||||
| W05-1203 | ||||
| P05-1014 |
| ID | Sentence |
| C-RR | |
| W05-1505:9 | 3 Constituency Parsing for Dependency Trees A pragmatic justification for using constituency- based parser in order |
| to predict dependency struc- tures is that currently the best Czech dependency- tree parser is a constituency-based parser (Collins et al, 1999; Zeman, 2004). | |
| W04-2407:27 | However, since most previous studies instead use the mean attachment score per word (Eisner, 1996; Collins et al, 1999), we will give this measure as well. |
| J03-4003:33 | 3 We find lexical heads in Penn Treebank data using the rules described in Appendix A of Collins (1999). |
| H05-1066:51 | Furthermore, we can also see that the MST parsers perform favorably compared to the more powerful |
| lexicalized phrase-structure parsers, such as those presented by Collins et al (1999) and Zeman (2004) that use expensive O(n5) parsing al- gorithms. | |
| E06-1011:21 | 5.2 Czech Results For the Czech data, we used the predefined train- ing, development and testing split |
| of the Prague Dependency Treebank (Hajiˇc et al, 2001), and the automatically generated POS tags supplied with the data, | |
| which we reduce to the POS tag set from Collins et al (1999). | |
| C-Lexrank | |
| P05-1012:16 | The Czech parser of Collins et al (1999) was run on a different data set and most other dependency parsers are evaluated using English. |
| W04-2407:26 | More precisely, parsing accuracy is measured by the attachment score, which is |
| a standard measure used in studies of dependency parsing (Eisner, 1996; Collins et al, 1999). | |
| W05-1505:14 | In an attempt to extend a constituency-based pars- ing model to train on dependency trees, |
| Collins transforms the PDT dependency trees into con- stituency trees (Collins et al, 1999). | |
| P06-1033:31 | More specifi- cally for PDT, Collins et al (1999) relabel coordi- nated phrases after converting dependency struc- tures to phrase |
| structures, and Zeman (2004) uses a kind of pattern matching, based on frequencies of the parts-of-speech of conjuncts and conjunc- tions. | |
| P05-1012:17 | In par- ticular, we used the method of Collins et al (1999) to simplify part-of-speech tags since |
| the rich tags used by Czech would have led to a large but rarely seen set of POS features. | |
4.1.1 Sentence Extraction
Once the graph is clustered and communities are formed, to build a summary we extract sentences from the clusters. We tried these two different simple methods:
-
•
Cluster Round-Robin (C-RR)
We start with the largest cluster, and extract sentences in the order they appear in each cluster. So we extract first, the first sentences from each cluster, then the second ones, and so on, until we reach the summary length limit . Previously, we mentioned that facts with higher weights appear in greater number of sentences, and clustering aims to cluster such fact-sharing sentences in the same communities. Thus, starting with the largest community is important to ensure that the system summary first covers the facts that have higher frequencies and therefore higher weights. -
•
Cluster Lexrank (C-lexrank)
The second method we used was Lexrank [Erkan and Radev, 2004] inside each cluster. In other words, for each cluster we made a lexical network of the sentences in that cluster () . Using Lexrank we can find the most central sentences in as salient sentences of to include in the main summary. We simply choose, for each cluster , the most salient sentence of , and if we have not reached the summary length limit, we do that for the second most salient sentences of each cluster, and so on. The way of ordering clusters is again by decreasing size.
Table 6 shows the two system summaries generated with C-RR and C-lexrank methods for P99-1065. The sentences in the table appear as they were extracted automatically from the text files of papers, containing sentence fragments and malformations occurring while doing the automatic segmentation.
4.2 Baseline Methods
We also conducted experiments with two baseline approaches. To produce the citation summary we used Mead’s [Radev et al., 2004] Random Summary and Lexrank [Erkan and Radev, 2004] on the entire citation summary network as baseline techniques. Lexrank is proved to work well in multi-document summarization [Erkan and Radev, 2004]. It first builds a lexical network, in which nodes are sentences and a weighted edge between two nodes shows the lexical similarity. Once this network is built, Lexrank performs a random walk to find the most central nodes in the graph and reports them as summary sentences.
5 Experimental Setup
5.1 Evaluation Method
Fact-based evaluation systems have been used in several past projects [Lin and Demner-Fushman, 2006, Marton and Radul, 2006], especially in the TREC question answering track. [Lin and Demner-Fushman, 2006] use stemmed unigram similarity of responses with nugget descriptions to produce the evaluation results, whereas [Marton and Radul, 2006] uses both human judgments and human descriptions to evaluate a response.
An ideal summary in our model is one that covers more facts and more important facts. Our definition for the properties of a “good” summary of a paper is one that is relatively short and consists of the main contributions of that paper. From this viewpoint, there are two criteria for our evaluation metric. First, summaries that contain more important facts are preferred over summaries that cover fewer relevant facts. Second, facts should not be equally weighted in this model, as some of them may show more important contributions of a paper, while others may not.
To evaluate our system, we use the pyramid evaluation method [Nenkova and Passonneau, 2004] at sentence level. Each fact in the citation summary of a paper is a summarization content unit (SCU) [Nenkova and Passonneau, 2004], and the fact distribution matrix, created by annotation, provides the information about the importance of each fact in the citation summary.
The score given by the pyramid method for a summary is a ratio of the sum of the weights of its facts to the sum of the weights of an optimal summary. This score ranges from 0 to 1, and high scores show the summary content contain more heavily weighted facts. We believe that if a fact appears in more sentences of the citation summary than another fact, it is more important, and thus should be assigned a higher weight. To weight the facts we build a pyramid, and each fact falls in a tier. Each tier shows the number of sentences a fact appears in. Thus, the number of tiers in the pyramid is equal to the citation summary size. If a fact appears in more sentences, it falls in a higher tier. So, if the fact appears times in the citation summary it is assigned to the tier .
The pyramid score formula that we use is computed as follows. Suppose the pyramid has tiers, , where tier on top and on the bottom. The weight of the facts in tier will be (i.e. they appeared in sentences). If denotes the number of facts in tier , and is the number of facts in the summary that appear in , then the total fact weight for the summary is . Additionally, the optimal pyramid score for a summary with facts, is
where . Subsequently, the pyramid score for a summary is calculated as .
5.2 Results and Discussion
Based on the described evaluation method we conducted a number of experiments to evaluate different summaries of a given length. In particular, we use a gold standard and a random summary to determine how good a system summary is. The gold standard is a summary of a given length that covers as many highly weighted facts as possible. To make a gold summary we start picking sentences that cover new and highly weighted facts, until the summary length limit is reached. On the other hand, in the random summary sentences are extracted from the citation summary in a random manner. We expect a good system summary to be closer to the gold than it is to the random one.
Table 7 shows the value of pyramid score , for the experiments on the set of 25 papers. A score of less than for a gold shows that there are more facts than can be covered with a set of sentences.
This table suggests that C-lexrank has a higher average score, , for the set of evaluated articles comparing C-RR and Lexrank.
As mentioned earlier in section 4.1.1, once the citation summary network is clustered in the C-RR method, the sentences from each cluster are chosen in a round robin fashion, which will not guarantee that a fact-bearing sentence is chosen.
This is because all sentences, whether they cover any facts or not, are assigned to some cluster anyway and such sentences might appear as the first sentence in a cluster. This will sometimes result in a low score, for which P05-1012 is a good example.
|
Article |
Gold |
Mead’s Random |
Lexrank |
C-RR |
C-lexrank |
|
| DP | C96-1058 | 1.00 | 0.27 | 0.73 | 0.73 | 0.73 |
| P97-1003 | 1.00 | 0.08 | 0.40 | 0.60 | 0.40 | |
| P99-1065 | 0.94 | 0.30 | 0.54 | 0.82 | 0.67 | |
| P05-1013 | 1.00 | 0.15 | 0.69 | 0.97 | 0.67 | |
| P05-1012 | 0.95 | 0.14 | 0.57 | 0.26 | 0.62 | |
| PBMT | N03-1017 | 0.96 | 0.26 | 0.36 | 0.61 | 0.64 |
| W03-0301 | 1.00 | 0.60 | 1.00 | 1.00 | 1.00 | |
| J04-4002 | 1.00 | 0.33 | 0.70 | 0.48 | 0.48 | |
| N04-1033 | 1.00 | 0.38 | 0.38 | 0.31 | 0.85 | |
| P05-1033 | 1.00 | 0.37 | 0.77 | 0.77 | 0.85 | |
| Summ | A00-1043 | 1.00 | 0.66 | 0.95 | 0.71 | 0.95 |
| A00-2024 | 1.00 | 0.26 | 0.86 | 0.73 | 0.60 | |
| C00-1072 | 1.00 | 0.85 | 0.85 | 0.93 | 0.93 | |
| W00-0403 | 1.00 | 0.55 | 0.81 | 0.41 | 0.70 | |
| W03-0510 | 1.00 | 0.58 | 1.00 | 0.83 | 0.83 | |
| QA | A00-1023 | 1.00 | 0.57 | 0.86 | 0.86 | 0.86 |
| W00-0603 | 1.00 | 0.33 | 0.53 | 0.53 | 0.60 | |
| P02-1006 | 1.00 | 0.49 | 0.92 | 0.49 | 0.87 | |
| D03-1017 | 1.00 | 0.00 | 0.53 | 0.26 | 0.85 | |
| P03-1001 | 1.00 | 0.12 | 0.29 | 0.59 | 0.59 | |
| TE | D04-9907 | 1.00 | 0.53 | 0.88 | 0.65 | 0.94 |
| H05-1047 | 1.00 | 0.83 | 0.66 | 0.83 | 1.00 | |
| H05-1079 | 1.00 | 0.67 | 0.78 | 0.89 | 0.56 | |
| W05-1203 | 1.00 | 0.50 | 0.71 | 1.00 | 0.71 | |
| P05-1014 | 1.00 | 0.44 | 1.00 | 0.89 | 0.78 | |
| Mean | 0.99 | 0.41 | 0.71 | 0.69 | 0.75 |
6 Conclusion and Future Work
In this work we use the citation summaries to understand the main contributions of articles. The citation summary size, in our experiments, ranges from a few sentences to a few hundred, of which we pick merely a few ( in our experiments) most important ones.
As a method of summarizing a scientific paper, we propose a clustering approach where communities in the citation summary’s lexical network are formed and sentences are extracted from separate clusters. Our experiments show how our clustering method outperforms one of the current state-of-art multi-document summarizing algorithms, Lexrank, on this particular problem.
A future improvement will be to use a reordering approach like Maximal Marginal Relevance (MMR) [Carbonell and Goldstein, 1998] to re-rank clustered documents within each cluster in order to reduce the redundancy in a final summary. Another possible approach is to assume the set of sentences in the citation summary as sentences talking about the same event, yet generated in different sources. Then one can apply the method inspired by [Barzilay et al., 1999] to identify common phrases across sentences and use language generation to form a more coherent summary. The ultimate goal, however, is to produce a topic summarizer system in which the query is a scientific topic and the output is a summary of all previous works in that topic, preferably sorted to preserve chronology and topicality.
7 Acknowledgments
The authors would like to thank Bonnie Dorr, Jimmy Lin, Saif Mohammad, Judith L. Klavans, Ben Shneiderman, and Aleks Aris from UMD, Bryan Gibson, Joshua Gerrish, Pradeep Muthukrishnan, Arzucan Özgür, Ahmed Hassan, and Thuy Vu from University of Michigan for annotations.
This paper is based upon work supported by the National Science Foundation grant ”iOPENER: A Flexible Framework to Support Rapid Learning in Unfamiliar Research Domains”, jointly awarded to U. of Michigan and U. of Maryland as IIS 0705832. Any opinions, findings, and conclusions or recommendations expressed in this paper are those of the authors and do not necessarily reflect the views of the National Science Foundation.
References
- [Barzilay et al., 1999] Barzilay, Regina, Kathleen R. McKeown, and Michael Elhadad. 1999. Information fusion in the context of multi-document summarization. In ACL’99, pages 550–557.
- [Bradshaw, 2002] Bradshaw, Shannon. 2002. Reference Directed Indexing: Indexing Scientific Literature in the Context of Its Use. Ph.D. thesis, Northwestern University.
- [Bradshaw, 2003] Bradshaw, Shannon. 2003. Reference directed indexing: Redeeming relevance for subject search in citation indexes. In Proceedings of the 7th European Conference on Research and Advanced Technology for Digital Libraries.
- [Carbonell and Goldstein, 1998] Carbonell, Jaime G. and Jade Goldstein. 1998. The use of MMR, diversity-based reranking for reordering documents and producing summaries. In SIGIR’98, pages 335–336.
- [Clauset et al., 2004] Clauset, Aaron, Mark E. J. Newman, and Cristopher Moore. 2004. Finding community structure in very large networks. Phys. Rev. E, 70(6):066111, Dec.
- [Elkiss et al., 2008] Elkiss, Aaron, Siwei Shen, Anthony Fader, Güneş Erkan, David States, and Dragomir R. Radev. 2008. Blind men and elephants: What do citation summaries tell us about a research article? Journal of the American Society for Information Science and Technology, 59(1):51–62.
- [Erkan and Radev, 2004] Erkan, Güneş and Dragomir R. Radev. 2004. Lexrank: Graph-based centrality as salience in text summarization. Journal of Artificial Intelligence Research (JAIR).
- [Erkan, 2006] Erkan, Güneş. 2006. Language model-based document clustering using random walks. In Proceedings of the HLT-NAACL conference, pages 479–486, New York City, USA, June. Association for Computational Linguistics.
- [Joseph and Radev, 2007] Joseph, Mark T. and Dragomir R. Radev. 2007. Citation analysis, centrality, and the ACL Anthology. Technical Report CSE-TR-535-07, University of Michigan. Department of Electrical Engineering and Computer Science.
- [Kan et al., 2002] Kan, Min-Yen, Judith L. Klavans, and Kathleen R. McKeown. 2002. Using the Annotated Bibliography as a Resource for Indicative Summarization. In Proceedings of LREC 2002, Las Palmas, Spain.
- [Kupiec et al., 1995] Kupiec, Julian, Jan Pedersen, and Francine Chen. 1995. A trainable document summarizer. In SIGIR ’95, pages 68–73, New York, NY, USA. ACM.
- [Levenshtein, 1966] Levenshtein, Vladimir I. 1966. Binary Codes Capable of Correcting Deletions, Insertions and Reversals. Soviet Physics Doklady, 10:707.
- [Lin and Demner-Fushman, 2006] Lin, Jimmy J. and Dina Demner-Fushman. 2006. Methods for automatically evaluating answers to complex questions. Information Retrieval, 9(5):565–587.
- [Manning et al., 2008] Manning, Christopher D., Prabhakar Raghavan, and Hinrich Schütze. 2008. Introduction to Information Retrieval. Cambridge University Press.
- [Marton and Radul, 2006] Marton, Gregory and Alexey Radul. 2006. Nuggeteer: Automatic nugget-based evaluation using descriptions and judgements. In Proceedings of NAACL/HLT.
- [Nanba and Okumura, 1999] Nanba, Hidetsugu and Manabu Okumura. 1999. Towards multi-paper summarization using reference information. In IJCAI1999, pages 926–931.
- [Nanba et al., 2004a] Nanba, Hidetsugu, Takeshi Abekawa, Manabu Okumura, and Suguru Saito. 2004a. Bilingual presri: Integration of multiple research paper databases. In Proceedings of RIAO 2004, pages 195–211, Avignon, France.
- [Nanba et al., 2004b] Nanba, Hidetsugu, Noriko Kando, and Manabu Okumura. 2004b. Classification of research papers using citation links and citation types: Towards automatic review article generation. In Proceedings of the 11th SIG Classification Research Workshop, pages 117–134, Chicago, USA.
- [Nenkova and Passonneau, 2004] Nenkova, Ani and Rebecca Passonneau. 2004. Evaluating content selection in summarization: The pyramid method. Proceedings of the HLT-NAACL conference.
- [Newman, 2001] Newman, Mark E. J. 2001. The structure of scientific collaboration networks. PNAS, 98(2):404–409.
- [Radev et al., 2004] Radev, Dragomir, Timothy Allison, Sasha Blair-Goldensohn, John Blitzer, Arda Çelebi, Stanko Dimitrov, Elliott Drabek, Ali Hakim, Wai Lam, Danyu Liu, Jahna Otterbacher, Hong Qi, Horacio Saggion, Simone Teufel, Michael Topper, Adam Winkel, and Zhu Zhang. 2004. MEAD - a platform for multidocument multilingual text summarization. In LREC 2004, Lisbon, Portugal, May.
- [Siddharthan and Teufel, 2007] Siddharthan, Advaith and Simone Teufel. 2007. Whose idea was this, and why does it matter? attributing scientific work to citations. In Proceedings of NAACL/HLT-07.
- [Teufel and Moens, 2002] Teufel, Simone and Marc Moens. 2002. Summarizing scientific articles: experiments with relevance and rhetorical status. Comput. Linguist., 28(4):409–445.
- [Teufel et al., 2006] Teufel, Simone, Advaith Siddharthan, and Dan Tidhar. 2006. Automatic classification of citation function. In Proceedings of the EMNLP, Sydney, Australia, July.
- [Teufel, 2005] Teufel, Simone. 2005. Argumentative Zoning for Improved Citation Indexing. Computing Attitude and Affect in Text: Theory and Applications, pages 159–170.