The Host Galaxy and Central Engine of the Dwarf AGN POX 5211affiliation: Based on observations made with the NASA/ESA Hubble Space Telescope, obtained at the Space Telescope Science Institute, which is operated by the Association of Universities for Research in Astronomy, Inc., under NASA contract NAS 5-26555. These observations are associated with program # 10239. 22affiliation: Based on observations obtained with XMM-Newton, an ESA science mission with instruments and contributions directly funded by ESA Member States and NASA.
Abstract
We present new multi-wavelength observations of the dwarf Seyfert 1 galaxy POX 52 in order to investigate the properties of the host galaxy and the active nucleus, and to examine the mass of its black hole, previously estimated to be . Hubble Space Telescope ACS/HRC images show that the host galaxy has a dwarf elliptical morphology ( mag, Sérsic index ) with no detected disk component or spiral structure, confirming previous results from ground-based imaging. X-ray observations from both Chandra and XMM-Newton show strong (factor of 2) variability over timescales as short as 500 s, as well as a dramatic decrease in the absorbing column density over a 9 month period. We attribute this change to a partial covering absorber, with a 94% covering fraction and cm-2, that moved out of the line of sight in between the XMM-Newton and Chandra observations. Combining these data with observations from the VLA, Spitzer, and archival data from 2MASS and GALEX, we examine the spectral energy distribution (SED) of the active nucleus. Its shape is broadly similar to typical radio-quiet quasar SEDs, despite the very low bolometric luminosity of ergs s-1. Finally, we compare black hole mass estimators including methods based on X-ray variability, and optical scaling relations using the broad H line width and AGN continuum luminosity, finding a range of black hole mass from all methods to be , with an Eddington ratio of .
Subject headings:
galaxies: individual (POX 52) — galaxies: active — galaxies: dwarf — galaxies: nuclei — galaxies: Seyfert — X-rays: galaxies1. Introduction
Stellar and gas dynamical studies have proven to be the most secure method of measuring the masses of supermassive black holes in nearby galaxies, and black holes with masses of – have now been detected in a few dozen galaxies (see Ferrarese & Ford 2005 for a recent review). With just a few exceptions, however, stellar-dynamical and gas-dynamical techniques for black hole mass measurement cannot be applied to Seyfert galaxies and quasars, because most luminous active galaxies are too distant for their black hole’s gravitational sphere of influence to be resolved. Most black hole mass estimates in broad-lined active galactic nuclei (AGNs) are based on indirect methods that rely on scaling relations resulting from reverberation-mapping data (Kaspi et al., 2000; Bentz et al., 2006). Using these methods, it has recently become possible to search for active galaxies having extremely low-mass black holes, in order to extend our understanding of black hole demographics to objects having black hole masses of .
The best nearby example of a black hole in the mass range is that in the dwarf Seyfert 1 galaxy NGC 4395 (Filippenko & Sargent, 1989; Filippenko & Ho, 2003). NGC 4395 is an essentially bulgeless, late-type dwarf galaxy with type 1 Seyfert characteristics such as broad emission lines (Filippenko & Sargent, 1989; Filippenko et al., 1993) and rapid X-ray variability (Iwasawa et al., 2000; Shih et al., 2003; Moran et al., 2005). Located at a distance of only Mpc (Thim et al., 2004), it is an excellent target for multiwavelength observations despite the tiny luminosity of its central engine ( ergs s-1; Moran et al. 1999). A recent ultraviolet (UV) reverberation-mapping measurement found (Peterson et al., 2005). Greene & Ho (2004, 2007b) searched the Sloan Digital Sky Survey (SDSS) archives to find AGNs with low-mass black holes and have found numerous examples of Seyfert 1 galaxies with , which we will refer to as the GH sample. However, most of the SDSS objects found by Greene & Ho are much more distant than NGC 4395, making detailed studies of their nuclei and host galaxies more difficult. Although the GH sample does contain examples of AGNs in low-mass disk galaxies (see also Dong et al., 2007), NGC 4395 remains an exceptional case due to its extreme late-type morphology as well as its proximity.
POX 52 (catalog ), also known as G1200-2038 or PGC 038055 ( Mpc for km s-1 Mpc-1), is an interesting counterpart to NGC 4395. It was originally discovered in an objective prism study by Kunth et al. (1987), who classified it as a dwarf disk galaxy with a Seyfert 2 nucleus, but noted the presence of a weak broad component of the H line. Barth et al. (2004) re-observed POX 52, classifying it as a type 1 AGN based on clear detections of broad H and H and noting that its optical emission-line spectrum is nearly identical to that of NGC 4395. Both NGC 4395 and POX 52 can be classified as narrow-line Seyfert 1 (NLS1) galaxies, since they satisfy the defining criterion of having FWHM(H) km s-1. NLS1 galaxies are often, but not always, characterized by strong Fe II emission and relatively weak [O III] emission when compared to H along with steep soft ( keV) spectral slopes and rapid variability in the X-ray (Osterbrock & Pogge, 1985; Boller et al., 1996). NGC 4395 and POX 52 are therefore somewhat atypical NLS1 galaxies in that they have very high-excitation spectra with large [O III]/H ratios and very weak Fe II emission.
Using the virial scaling relation calibrated by Kaspi et al. (2000), Barth et al. estimated a black hole mass of , making this one of the least massive black holes identified in any AGN. This mass is consistent with the mass expected based on the relation (extrapolated to small ) for the measured stellar velocity dispersion km s-1. They also estimated the bolometric luminosity ( ergs s-1) and the Eddington ratio (/ ) for POX 52. Thus, although POX 52 and NGC 4395 have very similar black hole masses and emission-line spectra that are nearly identical in appearance, the AGN in POX 52 is times more luminous than that in NGC 4395, which has an estimated / (Peterson et al., 2005). Barth et al. (2004) used ground-based images to study the morphology of POX 52 and found that the host galaxy was best fit with a Sérsic model with an index of , effective radius of , and absolute magnitude . Combined with measured from the spectrum, these results show POX 52 to fall near the dwarf elliptical sequence (Geha et al., 2003) in the fundamental plane projections of Burstein et al. (1997), making it the first example of a dwarf elliptical to host a Seyfert nucleus. Although the past few years have seen a large increase in the number of known AGNs with low-mass black holes, POX 52 remains a valuable target for further study, because of its relatively small distance and the fact that it is a less luminous and presumably less massive galaxy than the majority of the host galaxies in the GH SDSS sample.
Among nearby dwarf ellipticals, there is little evidence for the presence of central black holes. The closest well-studied example is NGC 205 in the Local Group, and stellar-dynamical observations with the Hubble Space Telescope (HST) have set an upper limit to the black hole mass of (Valluri et al., 2005), which is below the mass expected from a simple extrapolation of the relation. For dwarf elliptical galaxies outside the Local Group, stellar-dynamical observations lack the spatial resolution needed to detect black holes, and AGN surveys are the best available alternative for black hole searches. A double nucleus in one Virgo dwarf elliptical galaxy has been interpreted as morphological evidence for a stellar disk in orbit around a central black hole (Debattista et al., 2006), but aside from NGC 205 there are essentially no direct observational constraints on the black hole occupation fraction in dwarf elliptical galaxies. POX 52 represents a unique opportunity to study, in depth, the unambiguous presence of a low-mass central black hole in a nearby dwarf elliptical galaxy.
Here, we present new multiwavelength observations of POX 52, including the first targeted HST and X-ray observations of this unusual object. HST images are used to examine the host galaxy morphology; our results confirm the previous conclusions that the galaxy is consistent with a dwarf elliptical morphology with a Sérsic index of . We describe X-ray observations obtained with both the Chandra and XMM-Newton X-ray Observatories in order to study the temporal and spectral properties of the active nucleus, and to constrain its bolometric luminosity and black hole mass. We also include observations from the Very Large Array (VLA) and Spitzer Infrared Spectrometer (IRS), as well as archival data from 2MASS and GALEX, in order to investigate the spectral energy distribution (SED) of POX 52 over a wide range in frequency. We use recently updated versions of the broad-line virial scaling relations to obtain new estimates of the mass of the black hole, and in combination with the multiwavelength SED we determine the bolometric luminosity and Eddington ratio for the AGN. In addition to the HST data presented here, we were also awarded time as part of the same project to obtain ultraviolet and optical spectra of POX 52 with the Space Telescope Imaging Spectrograph (STIS), but STIS failed before the observations were scheduled to be taken.
2. Optical Observations
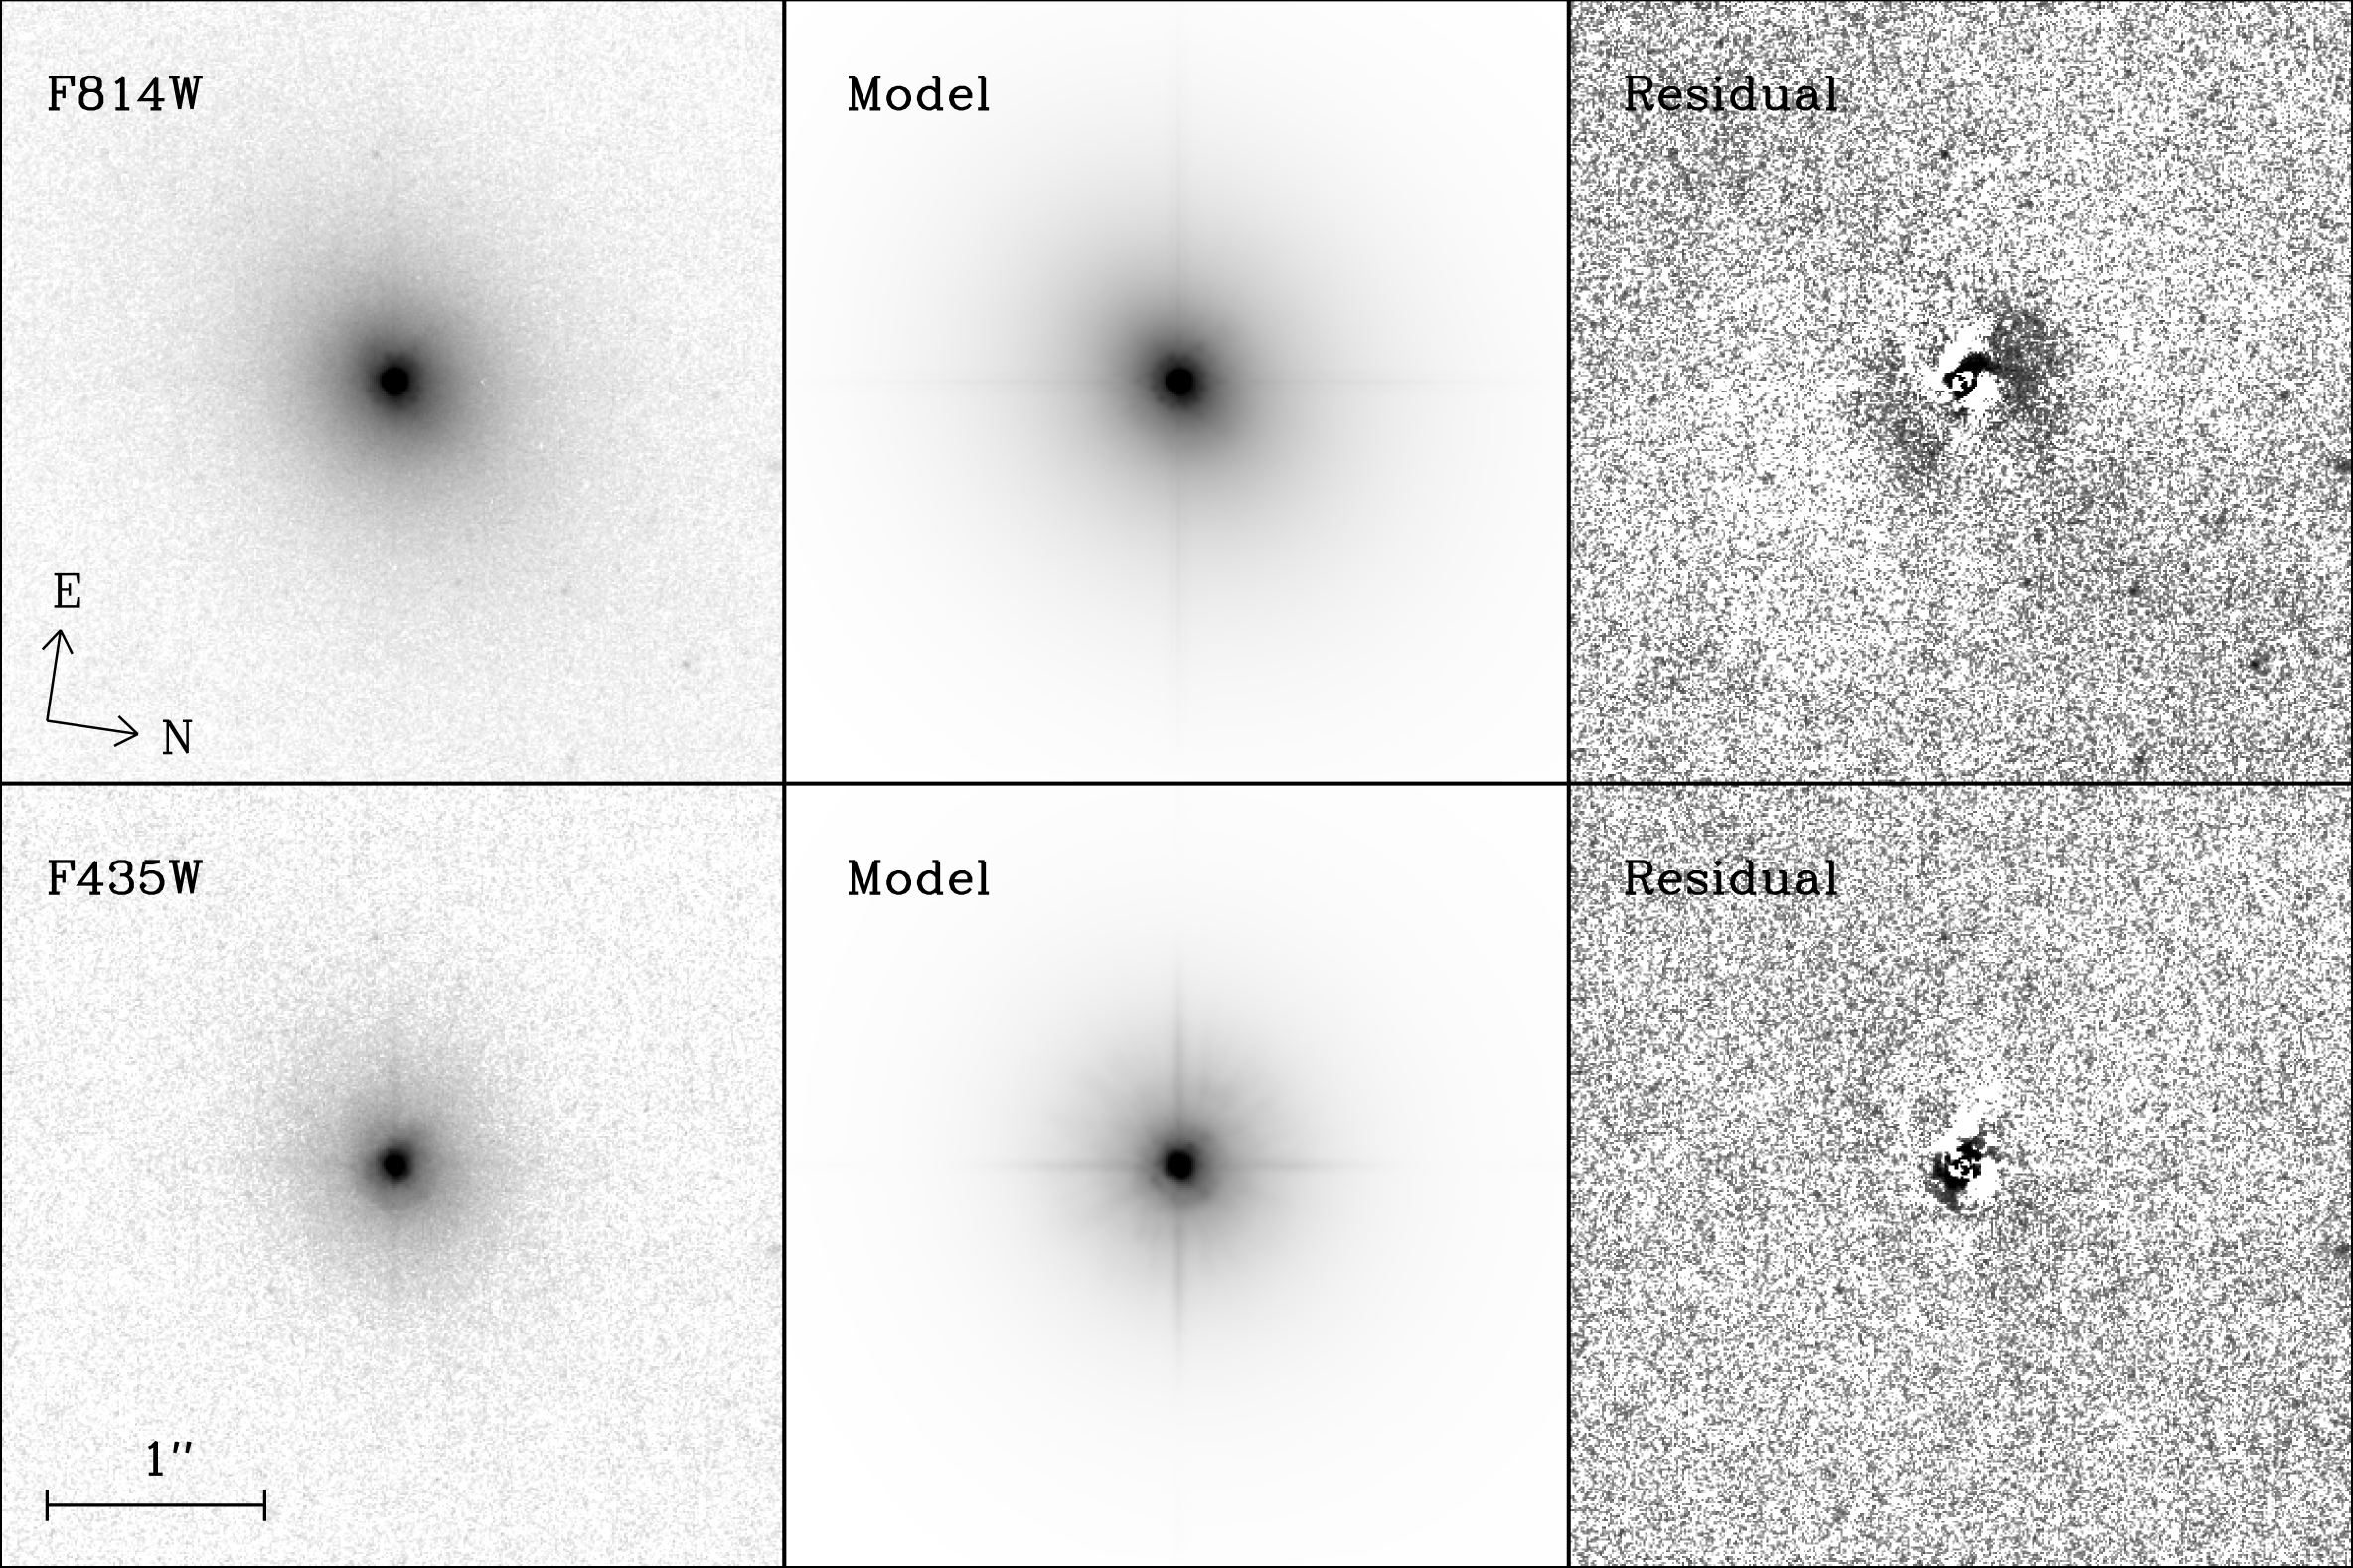
Observations of POX 52 were made on 2004 November 18 UT with HST using the High Resolution Camera (HRC) on ACS. Four images of 590 s each were taken through the F814W (I-band) missing (catalog ) (catalog ADS/Sa.HST#J8YB10PQQ)[ADS/Sa.HST#J8YB10010] filter and four images of 622 s each were taken through the F435W (B-band) missing (catalog ) (catalog ADS/Sa.HST#J8YB10PVQ)[ADS/Sa.HST#J8YB10020] filter. These images were dithered using a 4-point box pattern with 015 spacing to enable the removal of cosmic ray hits and bad pixels. An additional 100 s image was taken in each filter in the event that the nucleus saturated in the longer exposures, though this saturation did not occur in any image. The images for each filter were combined using the Multidrizzle task in PyRAF (version 1.3) to remove cosmic ray hits and to correct for the ACS geometric distortion, and the output images were not sky subtracted or rotated during this processing. These HST images (Figure 1) show POX 52 as a bright point source centered in a smooth host galaxy with no obvious signs of spiral structure in either filter.
The two-dimensional fitting program GALFIT (version 2.1d, Peng et al. 2002) was used to model the host galaxy morphology. The central point source in the center of the host galaxy was modeled by a point spread function (PSF) image, and the host galaxy itself was modeled by a Sérsic component, or combination of Sérsic components. Since the sky background was not subtracted in the image processing, a sky component was also used within each galaxy model. All magnitudes are in the Vegamag system calculated using the zeropoints calibrated for HRC111http://www.stsci.edu/hst/acs/analysis/zeropoints, which are 25.188 for F435W and 24.861 for F814W, and corrected for Galactic extinction using the IRAF package synphot for mag (Schlegel et al., 1998).
2.1. PSF Modeling
The PSF image used in the GALFIT modeling can either be created synthetically from a program such as Tiny Tim (Krist, 1993) or cropped from a data image using the same detector and filter set as the object being modeled. Both methods were tested in order to determine the most appropriate PSF for our analysis. We began by creating a synthetic PSF for each filter using Tiny Tim. We centered the PSF in the same position as the point source in our galaxy images in order to properly reproduce the geometric changes involved in the Multidrizzle process. These PSF images were then Multidrizzled in the same manner as the object data, since the Tiny Tim PSFs created for HRC include the geometric distortions in raw HRC images, and therefore must be subject to the same corrections to undistort the images. In order to evaluate how well the Tiny Tim PSF compares to the PSF of a star observed with HRC, we searched the archive for unsaturated images of HST standard stars observed in the F814W and F435W filters, finding three that matched our criteria: G191-B2B (catalog ), GD153 (catalog ), and GD71 (catalog ). Table 1 lists the observation dates and exposure times of these three white dwarf stars, in which they were located near the center of the CCD. The specific observations were chosen to bracket the POX 52 observation in order to minimize any changes to the PSF over time, with the average observation occurring 6 months from that of POX 52. All of the PSF star images were processed through Multidrizzle in the same manner as our POX 52 data with the exception that the standard star images were sky-subtracted during the Multidrizzle process in order to be used as input PSF images with GALFIT.
| Star | (mag) | Obs. Date (UT) | Exposure Time (s) | |
|---|---|---|---|---|
| F435W | F814W | |||
| G191-B2B | 11.78 | 2003 Aug 30 | 3.2 | 4.0 |
| 2003 Nov 8 | 4.0 | 14.0 | ||
| 2005 Feb 28 | 4.0 | 10.0 | ||
| GD153 | 13.40 | 2004 Feb 15 | 14.4 | 40.0 |
| 2005 May 19 | 14.4 | 30.0 | ||
| GD71 | 13.06 | 2004 Feb 3 | 12.0 | 35.0 |
| 2006 Nov 20 | 11.0 | 26.0 | ||
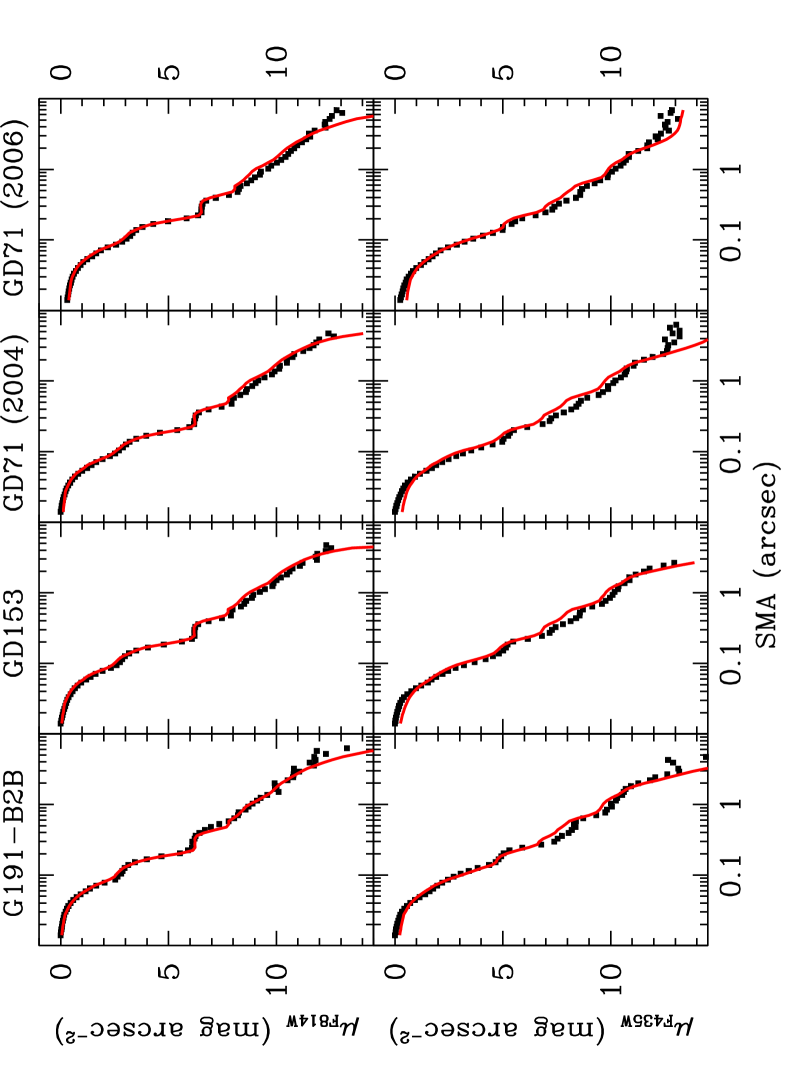
In order to determine how well Tiny Tim models the stellar PSF, we used the Tiny Tim model as the input PSF in GALFIT and fit each of the standard stars in both of the observed filters. Not only can we examine how the shape of the PSF changes for different stars (due to color and/or CCD location), but the existence of multiple observations of each of these stars in the HST archive allows us to determine the extent of changes to the PSF over time. Figure 2 shows radial profile plots made using the IRAF task ellipse for the star images compared to the GALFIT model using the Tiny Tim PSFs. The three left panels are profiles from the three different stars found in the HST archive. One can see how the shape of the PSF’s central peak can vary depending on the star used. The two observations of GD71 were taken about a year and a half apart. There is not a large change in the PSF shape during this time period, but small differences are apparent. The differences in profile shapes are more apparent in the F435W filter, showing Tiny Tim has more difficulty modeling a PSF in this filter. The Tiny Tim F435W PSF tends to have a flatter inner core, leaving a mag arcsec-2 residual out to . In the ACS/HRC camera about of the PSF flux at long wavelengths ( Å) scatters into a halo surrounding the PSF core making PSF modeling more difficult in red passbands (Sirianni et al, 1998), such as the F814W filter. The halo radius increases with wavelength, and Tiny Tim attempts to model its wavelength-dependent structure. Despite the red halo (seen as the bump at in Figure 2) and the variations seen between the stellar PSFs, Tiny Tim did a reasonable job modeling each of the standard stars in the F814W filter, with few significant deviations between the shape of the Tiny Tim PSF and that of the observed star. Since the Tiny Tim PSFs reasonably fit the central regions of the observed stars in both filters and have the advantage of being noise-free, we selected the corresponding Tiny Tim PSF to use in the GALFIT modeling of POX 52.
2.2. AGN and Host Galaxy Modeling
We fit the F814W HRC image of POX 52 over a arcsec2 ( pixel) region with a simple model consisting of an AGN point source and a single Sérsic component, where all parameters (including position and magnitude for both the point source and Sérsic components and effective radius, Sérsic index, axis ratio, and position angle for the Sérsic component) were allowed to vary. Figure 3 shows a radial profile plot of the best fit from GALFIT with a Sérsic index of 4.3 and a reduced of 15.0 for 241,068 degrees of freedom (dof). The top panels of Figure 1 show the F814W HST image (left panel) and the GALFIT model (middle panel) with , and an effective radius of 108, or 490 pc. The residuals after subtracting the model from the galaxy image are shown in the far right panel. The strong residuals in the center of the image are mostly confined to the PSF-dominated region at and are likely to be the result of PSF mismatch, but the weaker residuals seen further out from the PSF-dominated region of the galaxy could indicate small-scale structure in the host galaxy. We added a second Sérsic component to the model in an attempt to minimize the residuals, but it made little difference in the overall fit. The additional Sérsic component closely followed that of the PSF component, leaving the original Sérsic component to trace the host galaxy as before. The relative gain in the overall fit did not justify the need for a two Sérsic component model, and, therefore, we select the PSF+Sérsic model as the best fit the F814W images. Parameters for this fit and the F435W fits can be seen in Table 2.

The F435W data proved to be more difficult to model. The galaxy image was initially fit using the simple PSF+Sérsic model as above (Figure 4, left panel), but this resulted in an unexpectedly high Sérsic index of (the default maximum value for the Sérsic index used by GALFIT) and a poor fit compared with the F814W model results. In order to get a more reasonable result, we added a second Sérsic component to the model, allowing the parameters for both components to vary freely. In the resulting model fit, the first Sérsic component has a high central surface brightness that traces the central region of the galaxy out to , resembling the PSF component but with a slightly broader profile, while the second Sérsic component has a much lower surface brightness that models the majority of the host galaxy from outward. This outermost Sérsic component has an index of , similar to the result of the F814W fit.
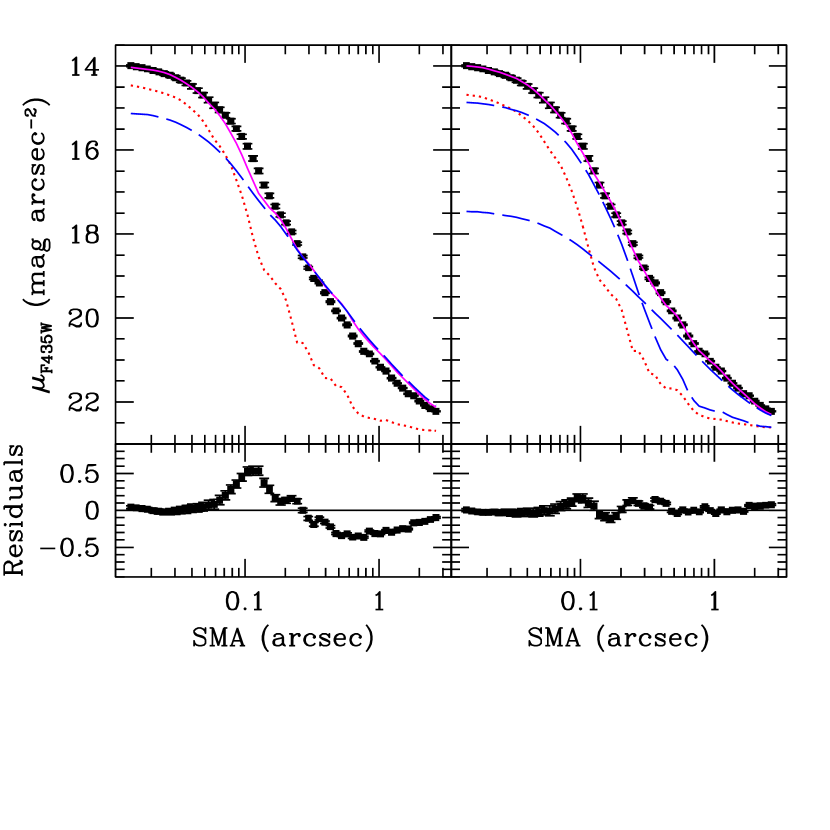
The effective radius of the host galaxy, as described by the outer Sérsic component in the best-fit (PSF+Sérsic+Sérsic) model, is slightly larger than in the F814W filter with pc. The reduced is also larger than in the F814W filter (26.2 compared to 15.0, even including the second Sérsic component in the F435W model), and the PSF component has an unexpectedly low central surface brightness, as seen in the radial profile plot (Figure 4, right panel).
The inner Sérsic component consists of some combination of AGN and host galaxy light, and it is difficult to disentangle the relative contributions. The magnitude of the PSF component describes a lower limit to the magnitude of the AGN of . We estimate an upper limit by repeatedly fitting the galaxy with a PSF+Sérsic model with a fixed PSF magnitude, increasing the magnitude each time until it was bright enough to account for the majority of the light in the very center of the galaxy, while allowing the single Sérsic component to vary freely as before. This results in an AGN magnitude of , which puts the AGN magnitude in the F435W filter in the range of mag. We adopt the magnitude of the outermost Sérsic component as a lower limit to the host galaxy brightness, in the F435W filter and combine the magnitudes of both Sérsic components to determine the upper limit, . This results in a host galaxy magnitude range of mag.
| Band | Component | Mag | (arcsec/pc) | ||
|---|---|---|---|---|---|
| F814W | 15.0 | PSF | 17.5 | ||
| Sérsic | 16.2 | 4.3 | 1.08/490 | ||
| F435W | 31.6 | PSF | 19.0 | ||
| - Single Sérsic | Sérsic | 16.8 | 20.0 | 5.87/2700 | |
| F435W | 26.2 | PSF | 19.2 | ||
| - Double Sérsic | Sérsic 1 | 18.4 | 1.4 | 0.060/27 | |
| Sérsic 2 | 18.2 | 4.4 | 1.22/550 |
In order to further confirm our choice of PSF, we refit the galaxy images with both the PSF+Sérsic model and the PSF+Sérsic+Sérsic model using each of the stellar PSFs. In each of the fits, regardless of the star used or the filter the image was taken in, the PSF component drastically under-represented the central point source light contribution. This verified that the fits in which the noise-free Tiny Tim PSF was used produced the best overall results.
Our GALFIT results show that the host galaxy of POX 52 has a Sérsic index in both the F814W and F435W filters making it more centrally concentrated than a typical dwarf elliptical galaxy with (Binggeli & Jerjen, 1998). In a study of host galaxies containing similar low-mass AGN, Greene et al. (2008) selected 19 galaxies from the GH sample for HST imaging in order to better determine their host galaxy morphology. From this HST imaging, they find that 60% of the sample are disk-dominated galaxies, while the remainder are compact systems with host morphology similar to POX 52. These compact galaxies have steep Sérsic indices in the range of and reside near dwarf ellipticals from the Geha et al. (2002), Gavazzi et al. (2005), and Matković & Guzmán (2005) samples in the fundamental plane. Although many of the galaxies in the Greene et al. HST sample are quite similar to POX 52 in terms of Sérsic index and overall host galaxy morphology, POX 52 ( in the F435W filter) remains less luminous than the average galaxy in the GH sample by mag (Greene et al., 2008).


| Chandra | XMM-Newton | |
|---|---|---|
| statistic | 183 (210 PHA bins, 205 dof) | 111 (104 PHA bins, 97 dof) |
| Photon Index | ||
| Disk (keV) | ||
| Foreground ( cm-2) | ||
| Partial Covering ( cm-2) | ||
| Partial Covering Fraction (%) | ||
| (0.5–10 keV) ( ergs cm-2 s-1) | ||
| (0.5–10 keV) ( ergs s-1) |
Note. — All model parameters were fit over a 0.5–10.0 keV energy range and we present observed flux and unabsorbed luminosity for both observations. For XMM-Newton, the spectra from both the EPIC-pn and MOS cameras were fit simultaneously.
3. X-Ray Observations
3.1. Chandra
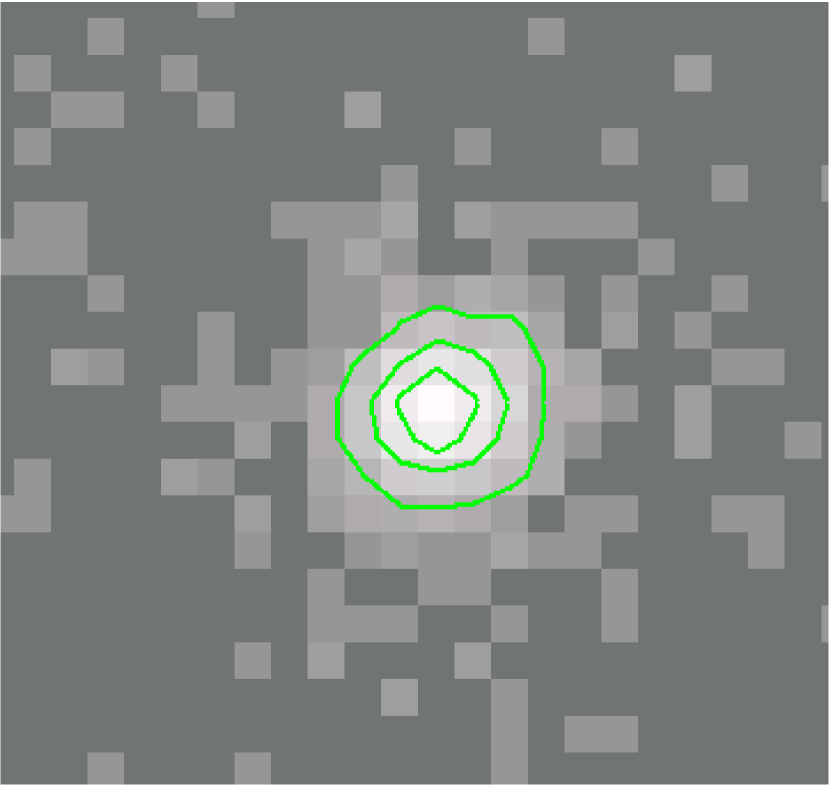
We first describe the Chandra observation since the source exhibited less spectral complexity in the Chandra data than in the earlier XMM-Newton observation. X-ray observations of POX 52 (catalog ADS/Sa.CXO#obs/5736) were carried out using the Advanced CCD Imaging Spectrometer (ACIS) instrument on the Chandra X-ray Observatory for a total of 25 ks on 2006 April 18 UT. The level 2 event file was restricted to the keV energy range, and there were no periods of high background found. POX 52 was observed to be consistent with a point source object, such that the FWHM of the PSF was , the 70% and 90% encircled energy radii were and pixels, respectively222This is consistent with Chandra PSF analysis. For more information, see http://cxc.harvard.edu/proposer/POG/html/ACIS.html#tth_sEc6.6, and the source showed no extended emission (Figure 5). Source events were extracted using a circular region of radius 10 pixels () centered on POX 52. The source was too close to the edge of the CCD to use an annulus as the background region, therefore, a circular background region was extracted away on the same chip with a radius of . There were approximately counts s-1 pixel-2 within this background region, giving a background-subtracted average source count rate of counts s-1. Due to the low source count rate, pile-up was not an issue. Data were analyzed using standard tasks, such as dmextract and psextract in CIAO (version 3.4/4.01; CALDB, version 3.4.0) and spectral models in XSPEC (version 12.3.0t).
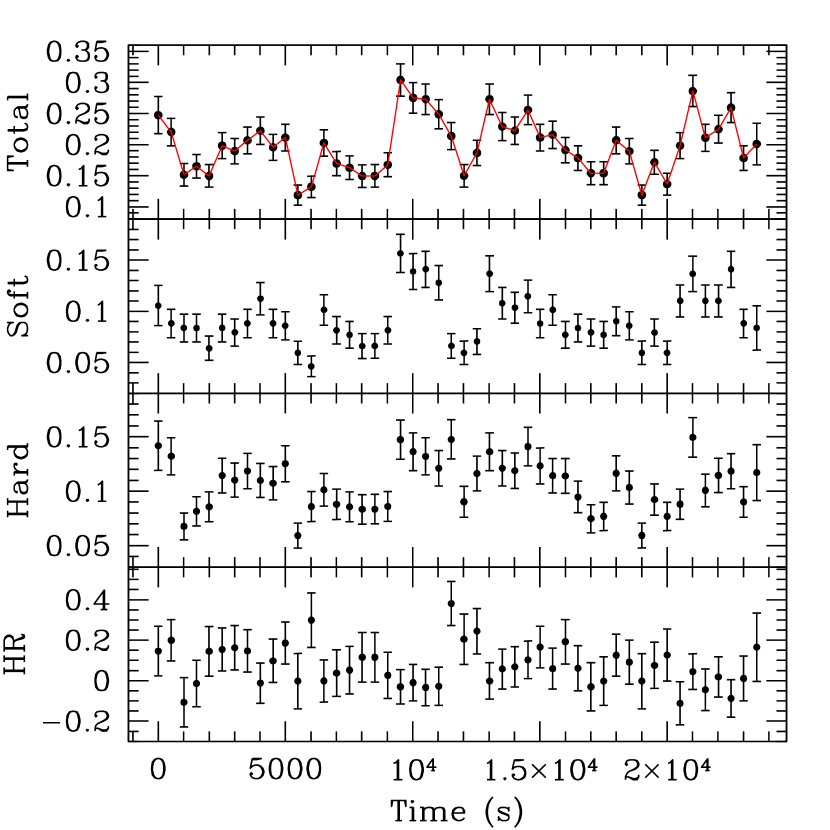
All light curves were created using time bins of 500 s and split into , , and keV energy ranges. These are denoted as the “full,” “soft,” and “hard” bands, respectively. The full-band light curve (Figure 6, top panel) shows strong (factor of 2) variability over short ( s) timescales. Also shown in Figure 6 are the light curves for the soft band, hard band, and the hardness ratio, . There seems to be no significant correlation between hardness ratio and the flux from the full band as seen in the right panel of Figure 6 and is confirmed by the results of a Spearman rank correlation test. The correlation coefficient was , which describes a weak anti-correlation, with a significance of 0.27 that is essentially insignificant.
The ACIS spectrum was first fit over the range keV with a simple absorbed power law, allowing all parameters to vary freely and optimized using the Cash (1979) statistic rather than . The statistic is a better goodness-of-fit parameter when fitting low signal-to-noise ratio spectra. The absorbed power law poorly fit the soft end of the observed spectrum, requiring another component to help model the excess of soft energies properly. We added a disk blackbody component to the model (phabs*[powerlaw + diskbb]), which resulted in an acceptable fit to the observed x-ray spectrum (Figure 7). The best-fitting model had a photon index of , and a disk blackbody temperature of keV. The absorbing column density was cm-2, only slightly in excess of the predicted foreground column of cm-2 based on Galactic H I maps (Dickey & Lockman, 1990; Kalberla et al., 2005), as determined by the HEASARC online calculator333http://heasarc.gsfc.nasa.gov/cgi-bin/Tools/w3nh/w3nh.pl.
In place of the thermal disk blackbody, we tested fitting the spectrum with other thermal components plus the absorbed power law component, specifically the thermal bremsstrahlung model and the Raymond-Smith (Raymond & Smith, 1977) plasma model. The bremsstrahlung model, with all parameters allowed to vary freely, produced a poor fit that strongly under-predicted the soft X-ray end of the spectrum by orders of magnitude. The Raymond-Smith model produced a reasonable fit to the data, similar to the fit when the disk blackbody was used, with a statistic of 182, nearly identical to the result for the combined absorbed power law and disk blackbody model (). However, this model uses 4 free parameters (3 when the redshift is frozen) to fit the data compared to the 2 parameters used in disk blackbody model. Due to this difference, we select the combined absorbed power law and disk blackbody as our best-fit model for simplicity.
There is possible evidence for an Fe K emission line seen in a single bin of energy keV in the residuals of our best-fit model. We added a Gaussian component to our model in order to determine constraints on the line energy and width. Allowing both the line energy and line width to vary freely, but fixing all other model parameters to our previous best-fit values, XSPEC modeled the line centroid at keV with a line width ranging from keV and an equivalent width (EW) of keV. The large EW may be explained by the X-ray Baldwin effect (see Page et al. 2004, Jiang et al. 2007), but we cannot draw any firm conclusions, since the detection is marginal, at best. Nandra et al. (2007) analyzed XMM-Newton spectra of 26 Seyfert galaxies (mostly Seyfert 1) and compiled measurements of the Fe K line. In this sample, the Fe K energies ranged from 5.28 keV to 6.78 keV, with a range of equivalent widths of keV. Both the measured line energy and EW of the Fe K from POX 52 are within the range of values measured by Nandra et al., although the EW is at the high end of the values sampled. The large errors on these measurements make this a weak detection at best, and deeper observations are needed to obtain a definitive detection of the line.


3.2. XMM-Newton
XMM-Newton observed POX 52 on 2005 July 8-9 UT for a total exposure time of 100 ks on each of the 3 EPIC instruments: pn, MOS1, and MOS2. All data were reduced using the Science Analysis System (SAS, version 7.0.0) and XSPEC following the guidelines of the SAS Cookbook and SAS ABC-Guide. For all EPIC instruments, the source was extracted in a circular region with a radius of , and due to the proximity of the source to the edge of the CCD in the EPIC-pn camera, the background was extracted from a circular region free of sources, located away from the source with a radius of . Only events corresponding to patterns (single or double pixel events) were used for the pn event file and patterns (single, double, triple and quadruple pixel events) for the MOS event files. All event files were restricted to an energy range of keV to better compare with the Chandra data. For all three instruments, events were excluded that occurred next to the edges of the CCD or next to bad pixels. Again, the source count rate was low enough to neglect effects due to pile-up.
Again using 500 s time bins, a light curve (Figure 8) was created using the entirety of the pn dataset. However, the first half of the observation contained two large background flares and due to this contamination, only the second half of the observation (Figure 8, right panel) was used in the spectral analysis (where the total counts in the background region are of the source counts). Examination of the second half of the observation shows a similar amplitude of variability to the Chandra observations, but over slightly longer ( s) timescales.
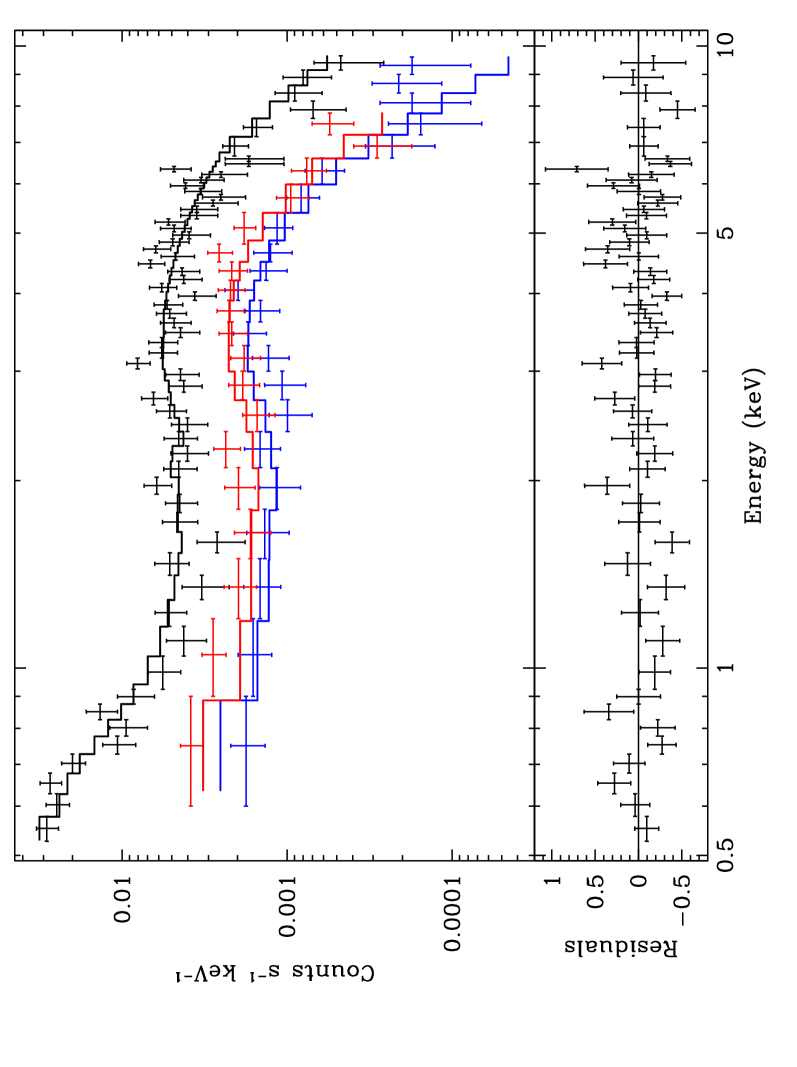
Observations of POX 52 with XMM-Newton yielded a significantly lower flux than the subsequent Chandra data. Figure 9 shows the spectra from both the pn and MOS cameras. There is a hint of a detection of a narrow Fe K emission line near 6.4 keV (contained in the bin centered at 6.375 keV with a width of 0.125 keV), as can be seen in the EPIC-pn residuals (Figure 9, lower panel). A simple absorbed power law and a combined absorbed power law plus disk blackbody both proved to be poor fits, even when the same parameter values were used from the Chandra fit, under-predicting the spectral shape by orders of magnitude below keV.
The XMM-Newton spectrum is harder than in the Chandra observation and requires more absorption to fit the spectral shape. Adding a partial covering component to the model (phabs*pcfabs*[powerlaw + diskbb]) improved the fit significantly. We fit the data using this model, allowing all parameters to vary freely. The photon index and blackbody temperature of this model are consistent within the errors with values derived from the Chandra data. The major difference is the need for much higher levels of absorption. The absorbing column density is three times that needed to model the Chandra data and the model adds a partial covering absorbing column density of with a partial covering fraction of . Since the partial covering fraction is very high, we tested forcing the fraction to 100% or simply using one larger absorbing column density, but both scenarios tended to over-absorb the power law in the soft X-ray end. The unabsorbed luminosity calculated for the XMM-Newton observation is within the 1 uncertainty of the Chandra unabsorbed luminosity, which suggests that the properties of the central engine itself did not change significantly between these two observations. The factor of 4 flux difference between the two X-ray observations is then explained by the additional absorption needed to fit the XMM-Newton spectra.

4. Ultraviolet Observations
4.1. XMM-Newton Optical Monitor
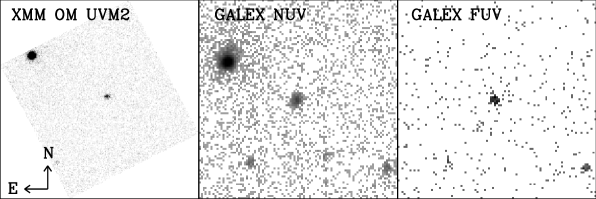
The Optical Monitor (OM) on XMM-Newton took a series of 72 images simultaneously with the X-ray observation, using the UVM2 filter, which is centered at 2310 Å, extending from Å (FWHM of the PSF pixels). Each of these images had an exposure time of 1 ks. The images were processed using the XMM-Newton SAS routine omichain to output calibrated photometric data via aperture photometry. Out of 72 images, POX 52 was easily detected in 60 images by the source detection algorithm in omichain and can be seen as the central object in Figure 10. Five additional images were reprocessed with omprep, omdetect, ommag, ommodmap, and ommat separately in order detect POX 52 by varying the detection threshold. For the remaining 7 images, the omichain routine was unable to detect or measure the source count rate due to high background count rates, and these images were discarded.
We used the photometric results of omichain to construct a UV light curve, shown in Figure 11. The measured flux was corrected for Galactic extinction by using the Schlegel et al. (1998) reddening maps and averaging the Cardelli et al. (1989) extinction law over the OM passband resulting in mag for the UVM2 filter. The mean flux density over the set of observations is Å ergs cm-2 s-1 Hz-1. Inspection of the light curve shows that the source is not highly variable in the UV. Only 25% of the individual points differ from the mean flux level by more than , and only 3/64 (or 5%) of the points differ from the mean flux by more than ; there are no outliers. The observed variability is therefore generally consistent with the expected level of variations from photon-counting statistics for a constant source. To further quantify any possible variability, we calculated the normalized excess variance of the light curve, following the prescription described by Nandra et al. (1997a):
| (1) |
where denotes the count rate of the -th point in the light curve, is its uncertainty, is the mean of the values over the entire light curve, and is the number of points in the light curve. The resulting excess variance is very small and actually has a negative value: . This result confirms that there is no evidence for significant variability in the UV light curve. The negative value of implies the error bars on the measurements are most likely slightly overestimated by the SAS processing and detection algorithm.
4.2. GALEX
As part of the GALEX All-sky Imaging Survey (AIS), POX 52 was imaged simultaneously in the near-UV (NUV) and far-UV (FUV) bands on 2006 February 9 UT for a total of 114 s. The NUV and FUV bands span the ranges Å and Å, respectively, with effective wavelengths of 2271 Å and 1528 Å. The FWHM of the PSF for the NUV filter is ( pixels) and for the FUV filter is ( pixels). Figure 10 shows both NUV and FUV images of POX 52 alongside one taken with the OM on XMM-Newton. Galactic extinction was calculated using the same method as for the OM, resulting in mag and mag. These were then used to correct the fluxes of POX 52 taken from the AIS catalog, resulting in a NUV flux density of Å ergs cm-2 s-1 Hz-1 and a FUV flux density of Å ergs cm-2 s-1 Hz-1. The NUV band of GALEX surrounds the UVM2 filter on the OM, giving us the opportunity to check for long-term variability in the UV. The flux densities calculated from both instruments are consistent within the uncertainty range, meaning we see no significant change in UV luminosity in the 7 months between the separate observations.
In order to estimate the UV host galaxy contribution, we take the observed range of NUV and FUV colors of Virgo dwarf elliptical galaxies from Boselli et al. (2005) and compute possible NUV and FUV flux densities based on the previous measurement of mag for POX 52 from Barth et al. (2004). This results in a estimated host galaxy magnitude in the range of NUV mag (AB) and FUV mag (AB), which we convert to a host galaxy NUV flux density of Å ergs cm-2 s-1 Hz-1 and a FUV flux density of Å ergs cm-2 s-1 Hz-1 for POX 52. We take the average flux density value in each of these bands to correct for host galaxy contamination and find corrected AGN flux densities of Å ergs cm-2 s-1 Hz-1 and Å ergs cm-2 s-1 Hz-1 for the NUV and FUV, respectively. Correcting the OM measurement in a similar manner results in a negligible change to the flux density. We note that, even for the highest estimate of host galaxy UV flux, the source is still very AGN dominated in the UV.
5. Radio Observations
POX 52 was observed for one hour on 2004 October 10 UT with the VLA in A configuration (Thompson et al., 1980), as part of a larger program to observe low-mass active galaxies from Greene & Ho (2004; see Greene et al. 2006). Observations were carried out at 4.860 GHz (6 cm; C band) with a bandwidth of 50 MHz for each of two intermediate frequencies separated by 50 MHz. For purposes of phase calibration, observations of the target were alternated every 3-5 minutes with observations of a bright radio source (PKS J1159-2148, located away). Our overall flux scale is tied to 3C 48, with an assumed flux density of 5.4 Jy, and uncertainties in the absolute fluxes of the phase calibrators, estimated to be , dominate the flux scale uncertainties.
After removal of corrupted records, flux and phase calibration were performed within AIPS (Greisen, 2003). We then Fourier transformed the observed visibilities to create an image of intensity on the sky, using a pixel scale of and a resulting synthesized beam of . We find no confusing sources within the primary beam (′), and so, because deconvolution algorithms such as CLEAN may change the noise statistics in a source-free image, we have calculated the upper limit of mJy directly from the direct Fourier transform. This upper limit represents the measured noise limit in the uncleaned map of mJy and corresponds to a radio power of and a radio-loudness parameter () for POX 52 of , where a radio-loud object is usually defined to have (Kellermann et al., 1989).
These values are consistent with the majority of the other GH sample sources studied by Greene et al. (2006). Out of 19 objects studied, Greene et al. only significantly detected one object, with upper limits to the radio power of the other 18 objects around . The high upper limits for the GH objects relative to POX 52 are due to the larger distances to the GH sample. The upper limits on the radio-loudness parameter may be a better comparison between POX 52 and the GH objects, which range from to for the GH sample, but the majority of these objects are well below the cutoff that usually describes a radio-loud object. Stacking the GH sample results in , giving a stricter upper limit to the radio-loudness of the sample as a whole.
6. Infrared Observations
6.1. Spitzer Space Telescope
POX 52 was observed on 2006 July 24 UT with the Spitzer Infrared Spectrograph (IRS) (Houck et al., 2004) as part of a sample of low-mass Seyfert galaxies (Program ID: 30119). The analysis of the entire sample, including measurements of emission lines and continuum shape, will be presented in a later paper, but we include the POX 52 spectrum here in order to supplement our multiwavelength coverage of this object. It was observed in the Short-Low and Long-Low slit modes, which correspond to a total wavelength range of m. Exposure times were s each in the SL1 and SL2 settings, and s each in the LL1 and LL2 settings. Data were processed prior to download with IRS Pipeline Processing version 15.3.0. Data were first cleaned using the IDL routine IRSCLEAN (v. 1.9), and the images were then coadded following the procedure in the Infrared Spectrograph Data Handbook444http://ssc.spitzer.caltech.edu/irs/dh/ (v. 3.1). The spectrum from each slit was extracted and calibrated using SPICE (v. 2.1.2). For each slit, the two nod positions were subtracted from each other in order to sky subtract the resulting data. Spectra from each of the four slits were combined and any overlapping data from adjacent wavebands were averaged together in the final product. Data from the LL slit was multiplied by a factor of 1.4 in order to properly match data from the SL slit. Figure 12 shows the combined spectrum with the most prominent emission lines identified, including [Ne II] m, [Ne III] m, [Ne V] m, [O IV] m, [S III] m, [S IV] m, [Si II] m, and PAH features at 6.2 m, 7.7 m, and 11.3 m.
The IRS spectra of POX 52 shows possible weak silicate absorption near m seen in some Seyfert 1 galaxies, but more commonly associated with Seyfert 2 galaxies (Hao et al., 2007). Assuming a power law fit over the m range with , POX 52 shows a steeper spectral slope than many Seyfert 1 galaxies (Buchanan et al., 2006). The spectral slope from m of is significantly flatter than suggesting the best continuum fit to be a broken power law, which is often seen in Seyfert 1 spectra (Weedman et al., 2005). The presence of PAH features and the observed red continuum (seen as the steep slope) suggests possible star formation in the host galaxy, however, we defer any further analysis to the later paper on the full Spitzer sample.

6.2. 2MASS Point Source Catalog
Near-infrared magnitudes were taken from the 2MASS Point Source Catalog (Skrutskie et al., 2006) in the (15.7 mag), (15.0 mag), and (14.5 mag) bands to be included along with our other data in the SED (Figure 15). These magnitudes include flux from the host galaxy as well as the AGN. In order to correct for this we used averaged and color indices derived from photometry of 10 dwarf ellipticals in the Virgo Cluster (James, 1994). Our GALFIT estimate of the -band (corrected from the F435W ACS/HRC filter to the standard Johnson filter using the IRAF routine calcphot) was used in order to estimate the contribution from the host galaxy. The host galaxy contributions were then subtracted from the 2MASS magnitudes, resulting in the following AGN point source magnitude estimates: mag. The errors were calculated based on the range of and colors for dwarf elliptical galaxies derived from James (1994).
7. Discussion
7.1. Host Galaxy Structure
Barth et al. (2004) previously classified POX 52 as a dwarf elliptical based on its morphology, their measurements of , , and , and the location of POX 52 in the “-space” projections (Bender et al., 1992; Burstein et al., 1997) of the fundamental plane. These parameters combine stellar velocity dispersion, surface brightness, and effective radius together in such a way, which correspond to the physical parameters of stellar mass and mass-to-light ratio, that a clear split can be seen among giant ellipticals, dwarf ellipticals, dwarf spheroidals, and globular clusters. In these projections, POX 52 falls nearest the Virgo dwarf elliptical galaxies from Geha et al. (2003), and is offset only slightly toward a higher surface brightness and a lower mass-to-light ratio. Our new HST observations do little to change the location of POX 52 in these projections, as the surface brightness and effective radius found in this paper are consistent with the previous values.
The addition of similar objects from the GH sample, based on new HST imaging (Greene et al., 2008), to these fundamental plane relations suggests that they are more centrally concentrated than typical dwarf ellipticals. However, in plots of vs. and vs. , they reside in between the distributions of dwarf ellipticals and classical ellipticals, as a possibly intermediate population. These galaxies clearly have properties that are in common with both populations, but they follow the distribution of dwarf ellipticals when kinematic data are combined with photometric data in the “-space” projections and therefore, we conclude that POX 52 and similar objects are most closely related to dwarf ellipticals, although they remain unusual for having unexpectedly highly Sérsic indices.
We note a difference in terminology between what some authors call a dwarf elliptical galaxy (Binggeli & Jerjen, 1998; Geha et al., 2002) and a different designation, spheroidals, in order to distinguish the typically less centrally concentrated objects from low-luminosity versions of classical ellipticals (Kormendy, 1985). In this paper, we refer to these galaxies as dwarf ellipticals for consistency with the nomenclature adopted in our earlier paper (Barth et al., 2004).
From our GALFIT decompositions, we can conclude that the host galaxy is well fit in both of the observed filters by a Sérsic profile with and at . The structure of the inner region of the host galaxy remains complicated due to the second Sérsic component needed to provide a reasonable fit in the F435W filter. We noted earlier that the inner Sérsic component seems to be compensating mostly for the PSF mismatch, but its broader profile suggests the possibility of a spatially compact, blue component, such as a nuclear star cluster. Looking at the color of POX 52 with and without the inner Sérsic component included, we can bracket the range of possible colors of the host galaxy. Excluding the inner Sérsic component, we find for the host galaxy, which is similar to fiducial values () for S0/Sab galaxies found in Fukugita et al. (1995) and from synphot calculations () with the Kinney et al. (1996) S0/Sab galaxy templates. If we assume that the compact component is entirely due to starlight, the resulting color of is bluer than both the Fukugita et al. (1995) fiducial value for Im galaxies ()and all of the starburst galaxy templates () from Kinney et al. (1996). Therefore, we conclude that the inner Sérsic component in the F435W image must contain a substantial amount of light from the AGN point source. However, we cannot determine the exact fractions of AGN and starlight in this component. This leaves a wide range of possible colors for the host galaxy.
7.2. X-ray Spectral Properties
X-ray spectral variability is not an unusual occurrence in an AGN, but is normally manifested in small changes in the spectral slope or in the width or amplitude of an emission line. Strong variability in the absorbing column density is more rare, but is often attributed to partial covering. In this scenario, there exists a patchy absorber surrounding the AGN made up of many smaller gas clouds orbiting the central engine with close to Keplerian velocities. The variations seen in column density are therefore related to the number of clouds along the line of sight. This has become a common model to use when a change in the spectral slope on the soft end is observed, as has been seen in several NLS1 galaxies, including IRAS 13224-3809 (Boller et al., 2003; Gallo et al., 2004a), RX J2217.9-5941 (Grupe et al., 2004a), Mrk 335 (Grupe et al., 2007), Mrk 1239 (Grupe et al., 2004b), and 1H 0707-495 (Gallo et al., 2004b).
The bright NLS1 Mrk 335 has recently experienced a change in absorption very similar to what we observe in POX 52. Mrk 335 has regularly been studied in the X-rays since 1971 with no dramatic changes in flux until 2007, when Grupe et al. (2007) measured a factor of 30 decrease in flux compared to all previous observations. When the spectra were modeled, Grupe et al. were unable to obtain a good fit with scaled-down versions of previously used models and found that adding a partial covering model to an absorbed power law with a high partial covering fraction of , much like that of POX 52, enabled an acceptable fit. When corrected for this additional absorption, the change in intrinsic luminosity is only a factor of when compared to earlier observations. Grupe et al. note that a partial covering model can also reasonably fit their 2006 data with a lower partial covering fraction of , but does not result in the best fit for their 2000 data. This suggests the partial covering absorber was moving into the line of sight as early as 2006.
Assuming the sizes of these discrete absorbing clouds do not vary much from one source to another, and that the accretion disks and surrounding X-ray-emitting regions of less massive black holes like POX 52 are, in fact, scaled-down versions of those associated with their more massive counterparts, one would expect the X-ray absorbing region to be less voluminous and therefore contain fewer absorbing clouds. Furthermore, if the differences in column density are attributed to the number of clouds instead of the size of clouds, it is possible that an X-ray-emitting region surrounding a black hole the size of POX 52 would have a higher likelihood of being observed with almost no absorbing clouds in the line of sight than for a more massive source due to the differences in the number of clouds associated with each source. The black hole in POX 52 is orders of magnitude less massive than that in Mrk 335 (Peterson et al., 1998, 2004; Vestergaard & Peterson, 2006) and moved from an unabsorbed state to the partial covering state in less than 9 months, whereas the change in absorbing column in Mrk 335 occurred over years (Grupe et al., 2007). These observations give upper limits to the timescales of absorption variability based on the partial covering scenario.
Barth et al. (2004) examined the ROSAT all-sky survey image of the position of POX 52 with an exposure time of s. Although there was no prominent source at the position of POX 52, Barth et al. showed there were two counts above the background rate within a circular aperture of radius equal to FWHM of the PSF of the detector, for a detection. With this in mind, we used the WebPIMMS555http://heasarc.nasa.gov/Tools/w3pimms.html online calculator to determine what state POX 52 might have been in when this observation was taken. Inputting our best-fit models from XMM-Newton and Chandra, we find that the unabsorbed state would have resulted in a keV ROSAT detection in the range of counts, and the absorbed state would have produced counts during the observation. From this we conclude that the ROSAT flux is consistent with the XMM-Newton absorbed state, or possibly a lower luminosity state. Further observations would help determine the more common X-ray state of POX 52 and better constrain the timescales of this variability.
We see no change in the intrinsic power law spectral slope of between these two observations. This is somewhat unusual given the large amount of both short-term ( s) and long-term ( s) variability that characterizes many NLS1 galaxies, including POX 52. For example, POX 52’s most similar companion, NGC 4395 has been shown to have strong variations not only in flux (factor of 2 over 5 months, O’Neill et al. 2006), but also in spectral slope ( over 2 years, Moran et al. 2005). A keV spectral slope of 0.6 is unusually low for either a Seyfert 1 galaxy or a NLS1 galaxy; a slope of is far more common for Seyfert 1, NLS1 galaxies, and quasars (Crummy et al., 2006; Leighly, 1999b; Piconcelli et al., 2005). The temperature of the blackbody component, used to model the soft excess seen in many NLS1 galaxies, also remained unchanged for POX 52 between the two observations, with a temperature of keV that is within the normal range ( keV) seen in NLS1 galaxies (Leighly, 1999b). When NLS1 spectra with soft excesses are fit with a model consisting of only a power law or absorbed power law component, the result is a steep spectral slope of (Boller et al., 1996), as opposed to the more common NLS1 spectral slope of .
In comparison, the similar low-mass GH sample objects observed with Chandra also have slightly different X-ray properties (Greene & Ho, 2007a). These 10 objects were observed for 5 ks each, resulting in only 5 objects with enough counts to allow for spectral fitting, and even this could only be done in the keV range. A soft photon index was derived from the hardness ratios for each object, giving a range of for the sample which brackets the keV photon index for POX 52. The GH sample objects show no signs of either a soft excess or intrinsic absorption. The observations did not allow for study of short-term variability due to low count rates.
Miniutti et al. (2008) re-observed four of these GH objects with XMM-Newton for 20 - 30 ks, in order to obtain a high enough signal-to-noise ratio for spectral fitting. These objects have remarkably similar spectra in the keV range to the Chandra spectrum of POX 52, and fits with power law plus disk blackbody models produce photon indices in the range of and temperatures keV. Although the blackbody temperature of the soft excess is similar to what is seen in both the Chandra and XMM-Newton observations of POX 52, the hard photon index of these GH objects is, on average, slightly harder than what has been observed in POX 52. These objects are an order of magnitude more luminous in the X-ray than POX 52, and contain black holes with masses around an order or magnitude larger than POX 52 (Greene & Ho, 2007b).

7.2.1 Power Spectral Density
AGNs are highly variable in X-rays and with good data sampling, one can study the frequency dependence of these variations by computing the power spectrum density (PSD), which is a measure of the amount of variability at a given frequency. The PSDs of AGNs and Seyferts are often fit with a combination of two power laws with a slope of at the high-frequency end and then breaking to a slope of at the low-frequency end. The frequency at which this change occurs is known as the break frequency, , and appears to correlate inversely with black hole mass (Markowitz et al., 2003).
Since the Chandra data have a higher signal-to-noise ratio than the XMM-Newton data and more closely represent the intrinsic state of the central engine without the heavy obscuration seen with XMM-Newton, we chose to carry out the PSD analysis on the Chandra dataset. We start by creating a light curve using 100 s time bins covering the keV energy range. The Xronos (v5.21) tool powspec (v1.0) was used to create the PSD from the light curve and can be seen in Figure 13 binned by a factor of 5 in frequency in order to increase the signal-to-noise ratio. There may be a possible flattening of the PSD from low frequencies and a break to a steeper slope at Hz. However, the PSD is easily fit with a single power law with a best-fit slope of and a for 8 dof. This fit is good enough that a broken power law fit is not justified. To test whether any constraints on could be derived, we attempted to fit a broken power law to the data. Unfortunately, all attempts at fitting the data while allowing parameters to vary freely produced either a break frequency outside the range of our data or a broken power law with no break, and the result is that both power law models had identical slopes. Arbitrarily forcing a specific break frequency produced fits to the data with low-frequency slopes of and high-frequency slopes of , neither of which approximate the expected slopes of and seen in most AGNs and Seyferts. From this we conclude that if is actually within the range detectable from our data, that our PSD is of such low quality that we are unable to measure it, or alternatively, lies at a frequency higher than Hz.
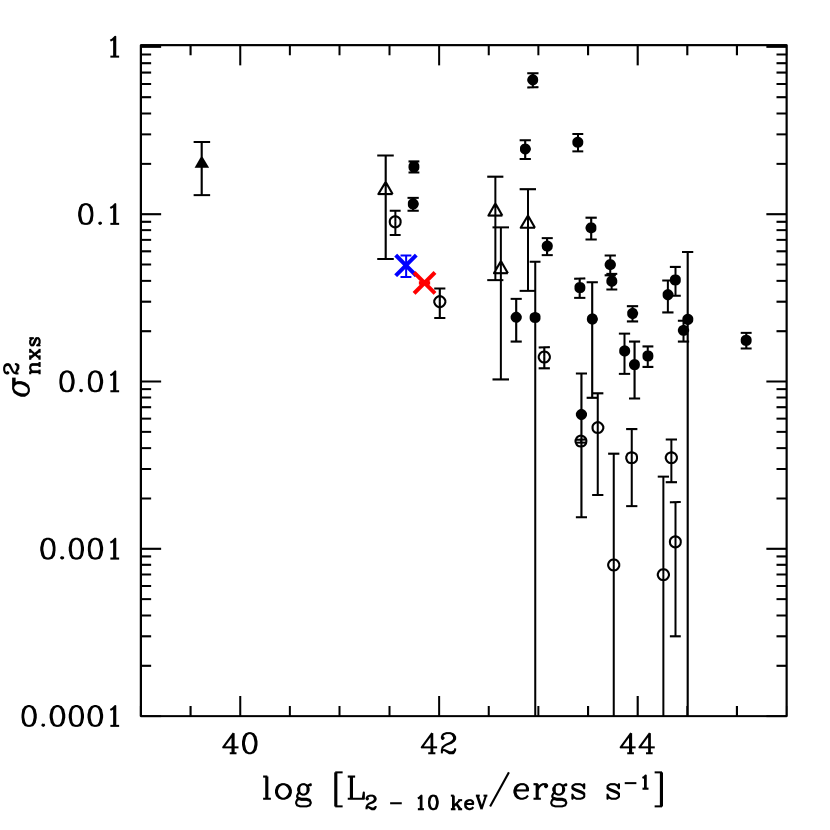
Even without an accurate measurement of , we can still gain information from the relationship between excess variance and . There seems to be a noticeable split between the distribution of for NLS1 and classical Seyfert 1 galaxies, with the excess variance of the NLS1 galaxies consistently larger than that of the Seyfert 1 galaxies at a given luminosity (Leighly, 1999a). To test this for the low-mass case of POX 52, we calculate the excess variance from the entirety of the usable light curve for both our XMM-Newton (second half of the observation, ks) and Chandra ( ks) data, using 500 s and 100 s bins, respectively and plot the results against the keV unabsorbed luminosity, along with NLS1 data from Leighly (1999a, b), Seyfert 1 data from Nandra et al. (1997a, b), and GH object data from Miniutti et al. (2008) in Figure 14. From this analysis, we find the excess variance of the two observations to be quite similar, and , despite the substantial additional absorber present in the XMM-Newton observation. This suggests that in the case of POX 52, the variability seen in the XMM-Newton observation is due to intrinsic variability and not due to fluctuations in the partial covering or the absorbing column density.
7.3. Spectral Energy Distribution
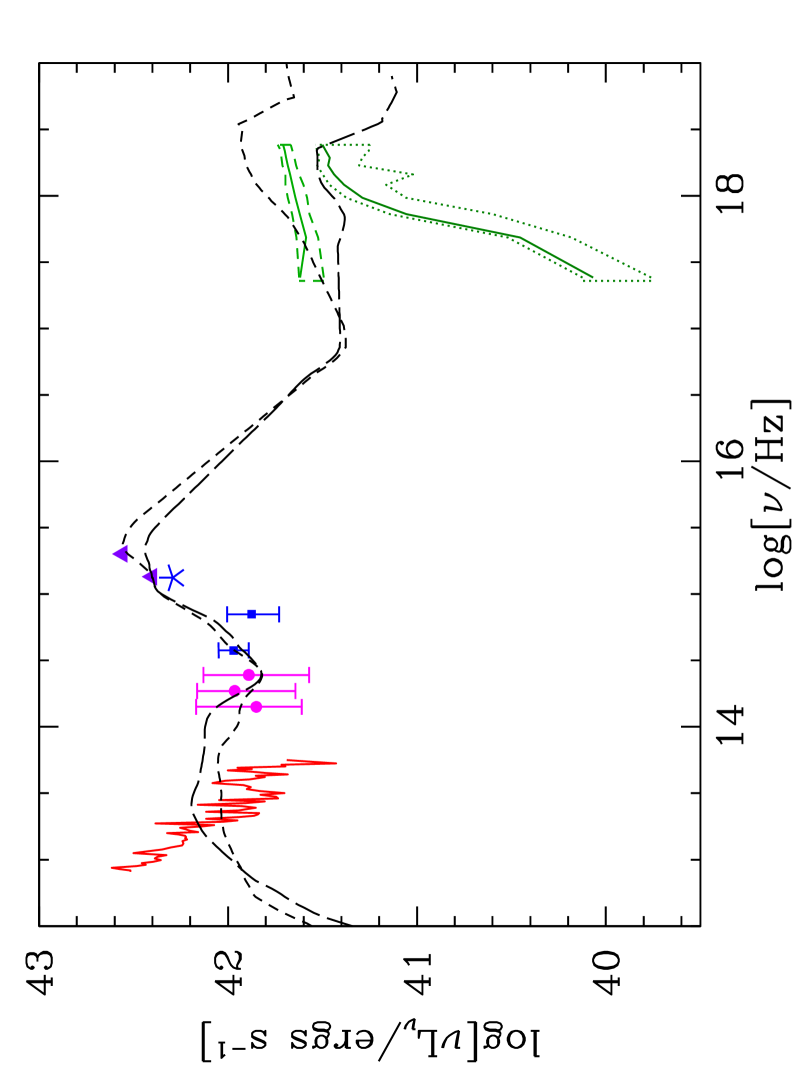
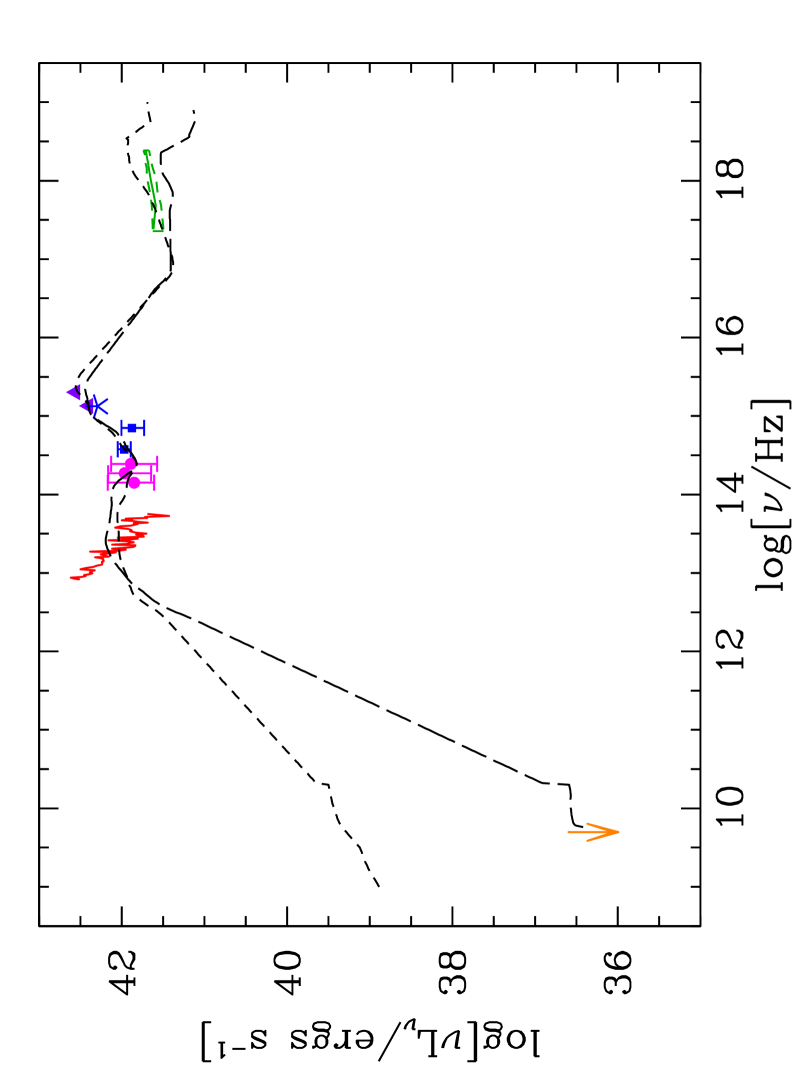
We combine all of our data and present one of the most complete SEDs (Figure 15, Table 4) of a low-mass AGN to date, covering the radio to the X-ray. For comparison, we include the templates of Elvis et al. (1994) from Palomar-Green (PG) quasars (Schmidt & Green, 1983), normalized to the flux of our NUV GALEX data point. The data from our observations closely match those of the radio-quiet (RQ) template for the majority of the frequency range shown. The Chandra data show POX 52 as X-ray bright compared to the RQ template and we again note that the XMM-Newton data represent a period of high absorption, not a decrease or change in the flux of the central object itself. It should also be noted that the observations are non-simultaneous and could therefore represent POX 52 in various states of emission, so care should be taken in examining the SED and comparing fluxes from different observations.
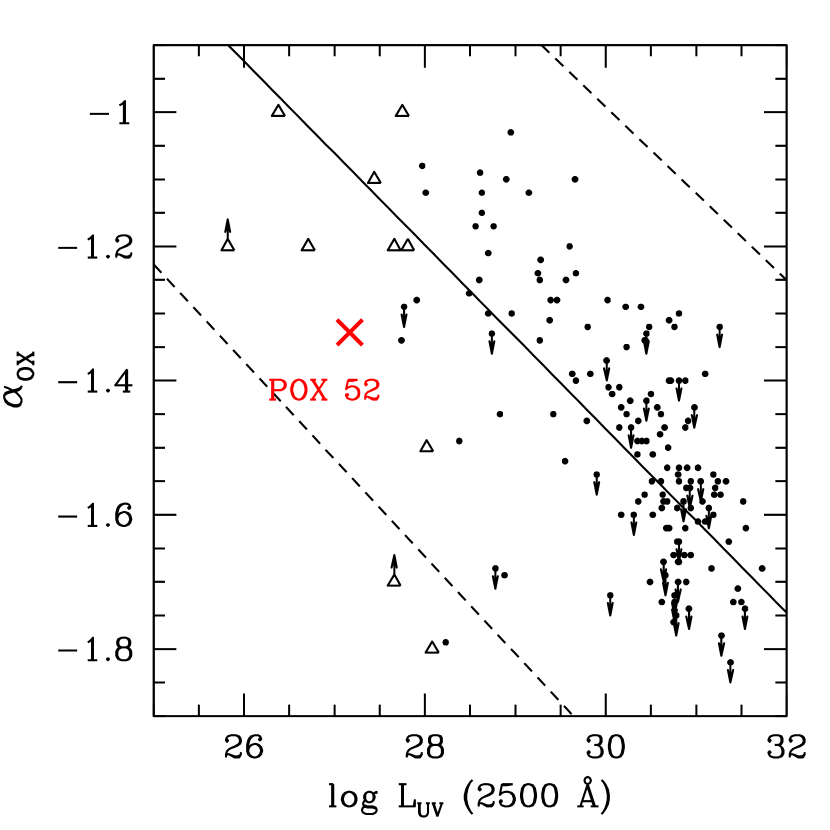
We approximate the shape of the SED near the OM observations as a power law with and extract a UV luminosity at Å of ergs s-1 Hz-1. Combining this with the 2 keV unabsorbed luminosity derived from the simultaneous observations with the EPIC cameras on XMM-Newton, we can calculate , the slope of a hypothetical power law connecting the UV to the X-ray666If a power law of the form is assumed, is then defined by keVÅ. (Tananbaum et al., 1979). We find , and this value does not change upon substitution of the Chandra 2 keV unabsorbed luminosity. Strateva et al. (2005) studied in a sample of 228 optically selected AGNs and found that decreased with increasing luminosity. This correlation has been updated by Steffen et al. (2006) to include higher redshift objects, resulting in , where is the luminosity of the object measured at Å. We plot the data from Strateva et al. along with that of POX 52 and similar intermediate-mass black holes from Greene & Ho (2007a) in Figure 16, showing that POX 52 falls among its intermediate-mass counterparts and within the errors of the extrapolated correlation between and UV luminosity calibrated for more luminous type 1 AGNs from Steffen et al.
| Rest Wavelength | log [/ergs s-1] | Source |
|---|---|---|
| or Energy | ||
| 6 cm | 36.127 | VLA |
| 36 m | 42.58 | Spitzer IRS |
| 30 m | 42.39 | Spitzer IRS |
| 20 m | 42.22 | Spitzer IRS |
| 10 m | 41.75 | Spitzer IRS |
| 6 m | 41.70 | Spitzer IRS |
| 2.12 m | 41.85 | 2MASS |
| 1.61 m | 41.97 | 2MASS |
| 1.22 m | 41.89 | 2MASS |
| 7966 Å | 41.97 | HST F814W |
| 4257 Å | 41.88 | HST F435W |
| 2260 Å | 42.29 | XMM-Newton OM |
| 2222 Å | 42.40 | GALEX NUV |
| 1495 Å | 42.56 | GALEX FUV |
| 1.0 keV | 41.62 | Chandra |
| 2.0 keV | 41.59 | Chandra |
| 10.0 keV | 41.71 | Chandra |
Using the Elvis et al. (1994) UV bolometric correction, we estimate ergs s-1 from the OM observations. Repeating this with the Elvis et al. -band correction and the HST measurement, results in ergs s-1, which is a factor of smaller than that of the UV data. Both of these estimates are based on observations of POX 52 in a single band, constituting a single point each on the SED. Using the templates derived by Elvis et al. (1994), shown on the SED, we estimate the using all of the data collected. With the templates normalized to match the GALEX NUV luminosity of POX 52, the radio-quiet template matches most data points at frequencies less than Hz, including the upper limit in the radio. We integrate the radio-quiet template from 6 cm to 1 keV and the Chandra data from 1 keV to 10 keV and estimate the bolometric luminosity based on the full extent of our data to be (SED) ergs s-1, which is consistent with the value estimated from the UV correction. We take this value as our best estimate of .
7.4. Black Hole Mass
For Seyfert 1 galaxies and quasars, there exists a correlation between the radius of the broad-line region () and the luminosity of the optical non-stellar continuum (most often measured at 5100Å), . Kaspi et al. (2000) derived this relationship based on their observations of 17 reverberation-mapped PG quasars combined with the results of 17 lower-luminosity AGNs with reverberation data. This relationship was recently updated by Bentz et al. (2006) by taking into account the host galaxy starlight contamination. Using this relation in tandem with the virial relation, , one can estimate the mass of a black hole with a single spectrum. However, the normalization and slope in the radius-luminosity relation, and the value of the normalization factor in the virial relation, which depends on the geometry and kinematics of the broad line region, are still subject to considerable uncertainty. In addition, different permutations of this relation not only use different emission lines for the line width measurement , but they also measure in different ways, either using the FWHM or the line dispersion (). Onken et al. (2004) calibrated the average normalization factor, by assuming all AGNs follow the same relation as quiescent galaxies.
We rely on the previous measurement of the H line width from a high-resolution Keck spectrum by Barth et al. (2004). They fit the broad H line with a Gaussian model and found km s-1. The conversion from FWHM to for a Gaussian fit is FWHM.
Using the radius-luminosity relation of Kaspi et al. (2000) and the broad H line width of km s-1 discussed above, Barth et al. (2004) previously estimated the black hole mass of POX 52 to be . We start our new calculation of black hole mass using the combined revisions of Bentz et al. and Onken et al., and our new HST measurements, such that
| (2) |
We note that our HST imaging is non-simultaneous with the previous Keck spectrum from Barth et al., and therefore potentially introduces some error in the calculation due to source variability. The extinction-corrected point source absolute magnitude calculated from the GALFIT decomposition is . For comparison, we also calculate the extinction-corrected absolute magnitude needed to maximize the PSF contribution to the galaxy, . These two magnitudes correspond to a range of Å ergs s-1. Using km s-1 from Barth et al. (2004), we calculate lt. days and .
As noted earlier, there are many different recipes to estimate black hole mass that rely on different versions of the radius-luminosity and virial mass relations. McGill et al. (2008) recently compiled a list of some of the most common versions and we use their formulations to explore the range of possible values in POX 52. We eliminate those relations in which the slope of the radius-luminosity relation is , which contradicts the updated measurement of Bentz et al. (2006) and are left with three alternate relations (equations 8, 10 and 13 of McGill et al.). We use the same parameters above from our HST measurements and the from Barth et al. (2004), and find a range of black hole masses of for POX 52, with an average of . This then extends our total range of possible black hole mass to , increasing the evidence that POX 52 contains an intermediate-mass black hole. This mass range is due to the scatter in using slightly different relations in the calculation of , but the systematic scatter in using any single relation is dex (Onken et al., 2004; Vestergaard & Peterson, 2006).
7.4.1 Black Hole Mass Estimates from X-ray Variability
Both and excess variance have been shown to be roughly correlated with black hole mass (Papadakis, 2004). We investigate both of these methods in order to independently confirm our mass estimates from optical data. We first estimate the expected from the properties of the AGN. Markowitz et al. (2003) fit a simple relation with measured in days, , in which is solely dependent on black hole mass. This relation seems to hold quite well for normal Seyfert 1 galaxies, but it underestimates black hole masses calculated from for NLS1 galaxies, which have been known to have shorter break timescales (and therefore higher break frequencies) than classical Seyfert 1 galaxies with similar black hole masses (Papadakis, 2004). In order to try to account for this disparity, McHardy et al. (2006) incorporated bolometric luminosity in the - relation, in an effort to account for the higher accretion rates seen in NLS1 galaxies compared to the average Seyfert 1. Taking the inverse of , where is known as the break timescale, McHardy et al. found the best fit in the -- plane for their sample of Seyfert 1, NLS1, and Galactic black holes to be , where is measured in days, is measured in units of , and is measured in units of ergs s-1. We use our average estimate of black hole mass and bolometric luminosity to calculate the corresponding from each of these relations and find Hz using the Markowitz et al. prescription and Hz using the McHardy et al. prescription. Since our PSD analysis was unable to determine , we note that estimated from the Markowitz et al. relation occurs near the visual break seen in Figure 13, and estimated from the McHardy et al. relation occurs at the high-frequency end of this same plot.
Other recent work has explored alternative methods to correlate the variability in observations too short for PSD analysis with black hole mass. Nikołajuk et al. (2004, 2006) calibrated the relationship between the excess variance of the variability in a given observation and the mass of the black hole. The excess variance must be sampled from the high-frequency end of the PSD, above where the shape of the PSD is described by . The cornerstone of this method is the assumption that the amplitude of the PSD at multiplied by is constant for all objects and independent of black hole mass, i.e. . This has been shown to be roughly accurate for a handful of objects studied to date (Markowitz et al., 2003; McHardy et al., 2004; Papadakis, 2004). Since the excess variance is simply the integral of the PSD, it can then be related to and consequently . This technique has only been tested on a few low-mass black holes in other AGNs, namely NGC 4395 and the NLS1 NGC 4051.
Without a measurement of for POX 52, we cannot determine that we are sampling the appropriate section of the PSD, and therefore, we continue on with the caveat that the mass estimates calculated using this method are tenuous at best. The Chandra observation had a higher signal-to-noise ratio than the XMM-Newton and therefore had a better chance at producing a reasonable result. We are unable to probe timescales shorter than the break timescale predicted by the McHardy et al. (2006) relation, s, so we continue with this method using the simpler Markowitz et al. (2003) relation which gives a wide range of break timescales ( s) corresponding to our full range. We tested the method using time bins of 100 s and 500 s and noted no significant difference between the two, except for the fact that using a smaller time bin allows us to divide the observation into a larger number of segments and therefore probe lower break timescales. We calculated black hole masses using segment lengths of s with 100 s time bins and segments of length, s with 500 s time bins, resulting in an average black hole mass of , where the errors represent the range of calculated for various . If the break frequency of POX 52 is Hz or lower, then we are able to probe the region above this frequency and calculate a black hole mass of . But if the break frequency is higher, near the Hz predicted by the McHardy et al. (2006) relation, we are unable to explore the region of interest in frequency space and our black hole mass calculations are inconclusive.
7.5. Accretion Luminosity
Using the range of black hole masses we have estimated here, the Eddington luminosity of POX 52 is in the range ergs s-1. Taking the bolometric luminosity calculated from the SED, we find an estimate of the Eddington ratio of / .
NLS1 galaxies have been shown to have higher Eddington ratios on average than their Seyfert 1 counterparts, usually with for NLS1 galaxies compared to for a normal Seyfert 1 (Xu et al., 2007). However, there are a few objects, e.g. NGC 4395, that strongly contradict this dichotomy. Despite nearly identical spectra in the optical, POX 52 has an Eddington ratio that is more than two orders of magnitude larger than the / for NGC 4395 (Peterson et al., 2005), demonstrating that there must be substantial differences between the central engines of these prototypical low-mass AGNs. An Eddington ratio of suggests POX 52 is not as highly accreting as many NLS1 galaxies and may represent an intermediate object in the continuum between NLS1 and Seyfert 1 galaxies.
The unabsorbed spectral slope () of POX 52 remained relatively unchanged between X-ray observations, suggesting little change in the intrinsic continuum emission. Shemmer et al. (2006) studied the correlation between X-ray spectral slope and accretion rate (/) for AGNs up to , increasing the luminosity range to more than 3 orders of magnitude, almost twice as large as previous studies (e.g. Porquet et al. 2004, Wang et al. 2004, Bian 2005). Despite having a much lower mass than any of sources used in the Shemmer et al. study ( ), POX 52 falls among the majority of objects in the sample when plotting versus /, making it consistent with this correlation, and suggests this relationship is independent of black hole mass. With and / , POX 52 falls in the overlapping region of the apparent distribution split between NLS1 (, / ) and Seyfert 1 (, / ) galaxies. It is important to note that bolometric luminosity is most often estimated from a single-band using a bolometric correction (as done in Shemmer et al.), and that there might be significantly more scatter or bias in these relations because of these corrections. However, since for POX 52 is calculated using a compilation of datasets over a wide range of wavelengths, it lends itself to a more secure calculation of the accretion luminosity of this object.
7.6. Black Hole – Host Galaxy Correlations
Relationships connecting the black hole mass with host galaxy properties, such as velocity dispersion, bulge mass, and bulge luminosity can be useful in predicting the mass of a black hole of many objects from single photometric or spectroscopic observations. Determining the slope and amount of scatter in these correlations, specifically in the low-mass and high-mass ends of the black hole mass spectrum, can help us learn how black holes and host galaxies, evolve together in time (e.g. di Matteo et al. 2005).
If we extrapolate the relation of Tremaine et al. (2002) down to km s-1 (Barth et al., 2004), we find a black hole mass of , which is consistent with the average black hole mass calculated from the mass estimators described above. We use the F435W magnitude of the outermost Sérsic component in order to estimate an absolute -band magnitude for the host galaxy of . Extrapolating the Marconi & Hunt (2003) relation down to a lower luminosity, we find a predicted of , which is a factor of higher than current estimates. The updated version of the Marconi & Hunt (2003) relation from Graham (2007) predicts a black hole mass of , which is a factor of larger than estimated here.
The measured host galaxy color places a constraint on the age (and thereby mass-to-light ratio) of the galaxy stellar populations. The code kcorrect (Blanton & Roweis, 2007) fits a combination of templates with a range of star formation histories, metallicities, and reddening values and returns the stellar mass [assuming a Chabrier (2003) initial mass function]. Using either the HST measurements presented here, or the measurements from Barth et al. (2004), we find a stellar mass of . If we extrapolate the Häring & Rix (2004) relation to the host galaxy mass of POX 52, the bulge mass implies a black hole mass of , a factor of larger than our current estimate.
The compact systems investigated in Greene et al. (2008) follow the same trends. For the relation, the black hole masses are on average two orders of magnitude less massive than their host galaxy luminosities would predict and are similarly an order of magnitude less massive than their host galaxy masses would predict. The divergent and relations in these galaxies as compared to elliptical galaxies may be an outcome of their different formation histories, as reflected in their different fundamental plane locations, which still leaves the possibility that the relation represents a tighter empirical correlation in this low-mass regime. The relation seems to more accurately reflect the properties of lower mass black holes and their host galaxies (Barth et al., 2005), whereas the and relations both overestimate the black hole mass by factors of .
There has been recent work suggesting a correlation between black hole mass and Sérsic index for elliptical galaxies or the bulges of disk galaxies, for the purpose of predicting black hole masses in other objects (Graham & Driver, 2007). The measured Sérsic index and mass make POX 52 a strong outlier in this relation, which previously only included objects with . For , the mass predicted by this relation is , approximately 3 orders of magnitude larger than all other mass estimates of POX 52 suggest. The inclusion of more objects like POX 52 and those in the GH sample demonstrate that there cannot be a single, tight correlation applicable across the entire mass spectrum of galaxies.
Recent HST imaging surveys have found evidence for a transition in the population of central star-cluster nuclei in early-type galaxies, such that galaxies more luminous than mag, or more massive than a few , tend to lack resolved central nuclei, while lower-luminosity early-type galaxies are more likely to be nucleated (Wehner & Harris, 2006; Ferrarese et al., 2006; Côté et al., 2006). These groups further found that the black holes in luminous ellipticals and the stellar nuclei in lower-mass galaxies followed the same relationship between central object mass and host galaxy mass. They suggested that formation of a central massive object might be a universal property of early-type galaxies, but that the central object would be either a massive black hole or a central star cluster, depending on the host galaxy mass. It has already been demonstrated that NGC 4395 has both an AGN and a nuclear star cluster (Matthews et al., 1999) and our GALFIT decompositions suggest the possibility that POX 52 might as well. Observations such as these provide further motivation to test for the presence of central black holes in dwarf ellipticals through dynamical searches or AGN surveys, and POX 52 is a unique object in this context, given its low stellar luminosity ( mag) and the unambiguous presence of a central black hole.
8. Summary and Conclusions
New HST observations have confirmed POX 52 to be a dwarf elliptical galaxy, with a Sérsic index of , , and . These parameters, along with the previously measured stellar velocity dispersion from Barth et al. (2004), show POX 52 to reside near the dwarf elliptical family in the fundamental plane. POX 52 was the first AGN found to reside in a dwarf elliptical galaxy, but more recent studies of low-mass AGNs and their host galaxies have found a number of similar objects (Greene et al., 2008).
We see strong variability over s timescales with both Chandra and XMM-Newton and a substantial change in the absorbing column density due to partial covering over a 9 month time period. Data from the Optical Monitor on XMM-Newton showed no significant variability in the UV over short s timescales. We see no variability within the errors in the 7 month period between the OM and GALEX NUV observations, but this does allow variations of % on the uncertainty level. The Spitzer spectrum shows evidence of possible star-formation due to the PAH features and red continuum, but that analysis is deferred to a later paper.
Including data from the VLA, Spitzer, GALEX, and 2MASS, we compile an extensive SED that shows POX 52 to be consistent with the radio-quiet template of more massive quasars and estimate a bolometric luminosity of ergs s-1 by incorporating all of the available data. Using a variety of mass estimators, we find a range of black hole mass . We find that we are unable to determine the break frequency from the Chandra PSD, either due to a low signal-to-noise ratio or insufficient temporal sampling. If Hz, then our mass estimate from the X-ray excess variance of is consistent with the optical mass estimates. Otherwise, new X-ray observations of POX 52 in an unabsorbed state with the larger effective area of XMM-Newton would be needed in order to determine and estimate the black hole mass with this method.
We have shown POX 52 to have an SED consistent with a scaled-down version of more massive type 1 quasars and that it is in a different accretion state than NGC 4395, as seen in the two orders of magnitude disparity between Eddington ratios. The number of low-mass AGNs known is increasing with new results from large AGN surveys, such as Greene & Ho (2004, 2007b), but POX 52 remains unique in that it is one of the nearest and best studied of the low-mass AGNs.
References
- Barth et al. (2004) Barth, A. J., Ho, L. C., Rutledge, R. E., & Sargent, W. L. W. 2004, ApJ, 607, 90
- Barth et al. (2005) Barth, A. J., Greene, J. E., & Ho, L. C. 2005, ApJ, 619, L151
- Bender et al. (1992) Bender, R., Burstein, D., & Faber, S. M. 1992, ApJ, 399, 462
- Bentz et al. (2006) Bentz, M. C., Peterson, B. M., Pogge, R. W., Vestergaard, M., & Onken, C. A. 2006, ApJ, 644, 133
- Bernardi et al. (2003) Bernardi, M., et al. 2003, AJ, 125, 1866
- Bian (2005) Bian, W.-H. 2005, Chinese Journal of Astronomy and Astrophysics Supplement, 5, 289
- Binggeli & Jerjen (1998) Binggeli, B., & Jerjen, H. 1998, A&A, 333, 17
- Blanton & Roweis (2007) Blanton, M. R., & Roweis, S. 2007, AJ, 133, 734
- Boller et al. (1996) Boller, T., Brandt, W. N., & Fink, H. 1996, A&A, 305, 53
- Boller et al. (2003) Boller, T., Tanaka, Y., Fabian, A., Brandt, W. N., Gallo, L., Anabuki, N., Haba, Y., & Vaughan, S. 2003, MNRAS, 343, L89
- Boselli et al. (2005) Boselli, A., et al. 2005, ApJ, 629, L29
- Buchanan et al. (2006) Buchanan, C. L., Gallimore, J. F., O’Dea, C. P., Baum, S. A., Axon, D. J., Robinson, A., Elitzur, M., & Elvis, M. 2006, AJ, 132, 401
- Burstein et al. (1997) Burstein, D., Bender, R., Faber, S., & Nolthenius, R. 1997, AJ, 114, 1365
- Cardelli et al. (1989) Cardelli, J. A., Clayton, G. C., & Mathis, J. S. 1989, ApJ, 345, 245
- Cash (1979) Cash, W. 1979, ApJ, 228, 939
- Chabrier (2003) Chabrier, G. 2003, ApJ, 586, L133
- Côté et al. (2006) Côté, P., et al. 2006, ApJS, 165, 57
- Crummy et al. (2006) Crummy, J., Fabian, A. C., Gallo, L., & Ross, R. R. 2006, MNRAS, 365, 1067
- Debattista et al. (2006) Debattista, V. P., Ferreras, I., Pasquali, A., Seth, A., De Rijcke, S., & Morelli, L. 2006, ApJ, 651, L97
- Dickey & Lockman (1990) Dickey, J. M., & Lockman, F. J. 1990, ARA&A, 28, 215
- Di Matteo et al. (2005) Di Matteo, T., Springel, V., & Hernquist, L. 2005, Nature, 433, 604
- Dong et al. (2007) Dong, X., et al. 2007, ApJ, 657, 700
- Elvis et al. (1994) Elvis, M., et al. 1994, ApJS, 95, 1
- Ferrarese et al. (2006) Ferrarese, L., et al. 2006, ApJ, 644, L21
- Ferrarese & Ford (2005) Ferrarese, L., & Ford, H. 2005, Space Science Reviews, 116, 523
- Filippenko & Ho (2003) Filippenko, A. V., & Ho, L. C. 2003, ApJ, 588, L13
- Filippenko et al. (1993) Filippenko, A. V., Ho, L. C., & Sargent, W. L. W. 1993, ApJ, 410, L75
- Filippenko & Sargent (1989) Filippenko, A. V., & Sargent, W. L. W. 1989, ApJ, 342, L11
- Fukugita et al. (1995) Fukugita, M., Shimasaku, K., & Ichikawa, T. 1995, PASP, 107, 945
- Gallo et al. (2004a) Gallo, L. C., Boller, T., Tanaka, Y., Fabian, A. C., Brandt, W. N., Welsh, W. F., Anabuki, N., & Haba, Y. 2004a, MNRAS, 347, 269
- Gallo et al. (2004b) Gallo, L. C., Tanaka, Y., Boller, T., Fabian, A. C., Vaughan, S., & Brandt, W. N. 2004b, MNRAS, 353, 1064
- Gavazzi et al. (2005) Gavazzi, G., Donati, A., Cucciati, O., Sabatini, S., Boselli, A., Davies, J., & Zibetti, S. 2005, A&A, 430, 411
- Geha et al. (2002) Geha, M., Guhathakurta, P., & van der Marel, R. P. 2002, AJ, 124, 3073
- Geha et al. (2003) Geha, M., Guhathakurta, P., & van der Marel, R. P. 2003, AJ, 126, 1794
- Graham (2007) Graham, A. W. 2007, MNRAS, 379, 711
- Graham & Driver (2007) Graham, A. W., & Driver, S. P. 2007, ApJ, 655, 77
- Greene & Ho (2004) Greene, J. E., & Ho, L. C. 2004, ApJ, 610, 722
- Greene & Ho (2007a) Greene, J. E., & Ho, L. C. 2007a, ApJ, 656, 84
- Greene & Ho (2007b) Greene, J. E., & Ho, L. C. 2007b, ApJ, 670, 92
- Greene et al. (2008) Greene, J. E., Ho, L. C., & Barth, A. J. 2008, ApJ, submitted
- Greene et al. (2006) Greene, J. E., Ho, L. C., & Ulvestad, J. S. 2006, ApJ, 636, 56
- Greisen (2003) Greisen, E. W. 2003, Astrophysics and Space Science Library, 285, 109
- Grupe et al. (2007) Grupe, D., Komossa, S., & Gallo, L. C. 2007, ApJ, 668, L111
- Grupe et al. (2004a) Grupe, D., Leighly, K. M., Burwitz, V., Predehl, P., & Mathur, S. 2004a, AJ, 128, 1524
- Grupe et al. (2004b) Grupe, D., Mathur, S., & Komossa, S. 2004b, AJ, 127, 3161
- Hao et al. (2007) Hao, L., Weedman, D. W., Spoon, H. W. W., Marshall, J. A., Levenson, N. A., Elitzur, M., & Houck, J. R. 2007, in The Central Engine of Active Galactic Nuclei, ed. L. C. Ho & J.-M. Wang (San Francisco: ASP), 574
- Häring & Rix (2004) Häring, N., & Rix, H.-W. 2004, ApJ, 604, L89
- Houck et al. (2004) Houck, J. R., et al. 2004, ApJS, 154, 18
- Iwasawa et al. (2000) Iwasawa, K., Fabian, A. C., Almaini, O., Lira, P., Lawrence, A., Hayashida, K., & Inoue, H. 2000, MNRAS, 318, 879
- James (1994) James, P. A. 1994, MNRAS, 269, 176
- Jiang et al. (2007) Jiang, P., Wang, J.-X., & Wang, T.-G. 2007, in The Central Engine of Active Galactic Nuclei, ed. L. C. Ho & J.-M. Wang (San Francisco: ASP), 143
- Kalberla et al. (2005) Kalberla, P. M. W., Burton, W. B., Hartmann, D., Arnal, E. M., Bajaja, E., Morras, R., Pöppel, W. G. L. 2005, A&A, 440, 775
- Kaspi et al. (2000) Kaspi, S., Smith, P. S., Netzer, H., Maoz, D., Jannuzi, B. T., & Giveon, U. 2000, ApJ, 533, 631
- Kellermann et al. (1989) Kellermann, K. I., Sramek, R., Schmidt, M., Shaffer, D. B., & Green, R. 1989, AJ, 98, 1195
- Kinney et al. (1996) Kinney, A. L., Calzetti, D., Bohlin, R. C., McQuade, K., Storchi-Bergmann, T., & Schmitt, H. R. 1996, ApJ, 467, 38
- Kormendy (1985) Kormendy, J. 1985, ApJ, 295, 73
- Krist (1993) Krist, J. 1993, in Astronomical Data Analysis Software and Systems II, ed. R. J. Hanisch, R. J. V. Brissenden, & Jeannette Barnes (San Francisco: ASP), 536
- Kunth et al. (1987) Kunth, D., Sargent, W. L. W., & Bothun, G. D. 1987, AJ, 93, 29
- Leighly (1999a) Leighly, K. M. 1999a, ApJS, 125, 297
- Leighly (1999b) Leighly, K. M. 1999b, ApJS, 125, 317
- Marconi & Hunt (2003) Marconi, A., & Hunt, L. K. 2003, ApJ, 589, L21
- Markowitz et al. (2003) Markowitz, A., et al. 2003, ApJ, 593, 96
- Matković & Guzmán (2005) Matković, A., & Guzmán, R. 2005, MNRAS, 362, 289
- Matthews et al. (1999) Matthews, L. D., et al. 1999, AJ, 118, 208
- McGill et al. (2008) McGill, K. L., Woo, J.-H., Treu, T., & Malkan, M. A. 2008, ApJ, 673, 703
- McHardy et al. (2006) McHardy, I. M., Koerding, E., Knigge, C., Uttley, P., & Fender, R. P. 2006, Nature, 444, 730
- McHardy et al. (2004) McHardy, I. M., Papadakis, I. E., Uttley, P., Page, M. J., & Mason, K. O. 2004, MNRAS, 348, 783
- Miniutti et al. (2008) Miniutti, G., Ponti, G., Greene, J. E., Ho, L. C., Fabian, A. C., & Iwasawa, K., 2008, MNRAS, submitted
- Moran et al. (2005) Moran, E. C., Eracleous, M., Leighly, K. M., Chartas, G., Filippenko, A. V., Ho, L. C., & Blanco, P. R. 2005, AJ, 129, 2108
- Moran et al. (1999) Moran, E. C., Filippenko, A. V., Ho, L. C., Shields, J. C., Belloni, T., Comastri, A., Snowden, S. L., & Sramek, R. A. 1999, PASP, 111, 801
- Nandra et al. (1997a) Nandra, K., George, I. M., Mushotzky, R. F., Turner, T. J., & Yaqoob, T. 1997a, ApJ, 476, 70
- Nandra et al. (1997b) Nandra, K., George, I. M., Mushotzky, R. F., Turner, T. J., & Yaqoob, T. 1997b, ApJ, 477, 602
- Nandra et al. (2007) Nandra, K., O’Neill, P. M., George, I. M., & Reeves, J. N. 2007, MNRAS, 382, 194
- Nikołajuk et al. (2006) Nikołajuk, M., Czerny, B., Ziółkowski, J., & Gierliński, M. 2006, MNRAS, 370, 1534
- Nikołajuk et al. (2004) Nikołajuk, M., Papadakis, I. E., & Czerny, B. 2004, MNRAS, 350, L26
- O’Neill et al. (2006) O’Neill, P. M., et al. 2006, ApJ, 645, 160
- Onken et al. (2004) Onken, C. A., Ferrarese, L., Merritt, D., Peterson, B. M., Pogge, R. W., Vestergaard, M., & Wandel, A. 2004, ApJ, 615, 645
- Osterbrock & Pogge (1985) Osterbrock, D. E., & Pogge, R. W. 1985, ApJ, 297, 166
- Page et al. (2004) Page, K. L., O’Brien, P. T., Reeves, J. N., & Turner, M. J. L. 2004, MNRAS, 347, 316
- Papadakis (2004) Papadakis, I. E. 2004, MNRAS, 348, 207
- Peng et al. (2002) Peng, C. Y., Ho, L. C., Impey, C. D., & Rix, H.-W. 2002, AJ, 124, 266
- Peterson (2007) Peterson, B. M. 2007, in The Central Engine of Active Galactic Nuclei, ed. L. C. Ho & J.-M. Wang (San Francisco: ASP), 3
- Peterson et al. (2004) Peterson, B. M., et al. 2004, ApJ, 613, 682
- Peterson et al. (2005) Peterson, B. M., et al. 2005, ApJ, 632, 799
- Peterson et al. (1998) Peterson, B. M., Wanders, I., Bertram, R., Hunley, J. F., Pogge, R. W., & Wagner, R. M. 1998, ApJ, 501, 82
- Piconcelli et al. (2005) Piconcelli, E., Jimenez-Bailón, E., Guainazzi, M., Schartel, N., Rodríguez-Pascual, P. M., & Santos-Lleó, M. 2005, A&A, 432, 15
- Porquet et al. (2004) Porquet, D., Reeves, J. N., O’Brien, P., & Brinkmann, W. 2004, A&A, 422, 85
- Raymond & Smith (1977) Raymond, J. C., & Smith, B. W. 1977, ApJS, 35, 419
- Schlegel et al. (1998) Schlegel, D. J., Finkbeiner, D. P., & Davis, M. 1998, ApJ, 500, 525
- Schmidt & Green (1983) Schmidt, M., & Green, R. F. 1983, ApJ, 269, 352
- Shemmer et al. (2006) Shemmer, O., Brandt, W. N., Netzer, H., Maiolino, R., & Kaspi, S. 2006, ApJ, 646, L29
- Shih et al. (2003) Shih, D. C., Iwasawa, K., & Fabian, A. C. 2003, MNRAS, 341, 973
- Sirianni et al (1998) Sirianni, M., et al. 1998, Proc. SPIE, 3355, 608
- Skrutskie et al. (2006) Skrutskie, M. F., et al. 2006, AJ, 131, 1163
- Steffen et al. (2006) Steffen, A. T., Strateva, I., Brandt, W. N., Alexander, D. M., Koekemoer, A. M., Lehmer, B. D., Schneider, D. P., & Vignali, C. 2006, AJ, 131, 2826
- Strateva et al. (2005) Strateva, I. V., Brandt, W. N., Schneider, D. P., Vanden Berk, D. G., & Vignali, C. 2005, AJ, 130, 387
- Tananbaum et al. (1979) Tananbaum, H., et al. 1979, ApJ, 234, L9
- Thim et al. (2004) Thim, F., Hoessel, J. G., Saha, A., Claver, J., Dolphin, A., & Tammann, G. A. 2004, AJ, 127, 2322
- Thompson et al. (1980) Thompson, A. R., Clark, B. G., Wade, C. M., & Napier, P. J. 1980, ApJS, 44, 151
- Tremaine et al. (2002) Tremaine, S., et al. 2002, ApJ, 574, 740
- Valluri et al. (2005) Valluri, M., Ferrarese, L., Merritt, D., & Joseph, C. L. 2005, ApJ, 628, 137
- Vestergaard & Peterson (2006) Vestergaard, M., & Peterson, B. M. 2006, ApJ, 641, 689
- Wang et al. (2004) Wang, J.-M., Watarai, K.-Y., & Mineshige, S. 2004, ApJ, 607, L107
- Weedman et al. (2005) Weedman, D. W., et al. 2005, ApJ, 633, 706
- Wehner & Harris (2006) Wehner, E. H., & Harris, W. E. 2006, ApJ, 644, L17
- Xu et al. (2007) Xu, D., Komossa, S., Zhou, H., Wang, T., & Wei, J. 2007, ApJ, 670, 60