A Search for the Near-Infrared Counterpart to GCRT J1745300911affiliation: This paper includes data gathered with the 6.5 meter Magellan Telescopes located at Las Campanas Observatory, Chile. 22affiliation: Based on observations obtained at the Gemini Observatory, which is operated by the Association of Universities for Research in Astronomy, Inc., under a cooperative agreement with the NSF on behalf of the Gemini partnership: the National Science Foundation (United States), the Science and Technology Facilities Council (United Kingdom), the National Research Council (Canada), CONICYT (Chile), the Australian Research Council (Australia), Ministério da Ciência e Tecnologia (Brazil) and SECYT (Argentina).
Abstract
We present an optical/near-infrared search for a counterpart to the perplexing radio transient GCRT J17453009, a source located from the Galactic Center. Motivated by some similarities to radio bursts from nearby ultracool dwarfs, and by a distance upper limit of pc for the emission to not violate the K brightness temperature limit for incoherent radiation, we searched for a nearby star at the position of GCRT J17453009. We found only a single marginal candidate, limiting the presence of any late-type star to kpc (spectral types earlier than M9), pc (spectral types L and T0–T4), and pc (spectral types T4–T7), thus severely restricting the possible local counterparts to GCRT J17453009. We also exclude any white dwarf within kpc or a supergiant star out to the distance of the Galactic Center as possible counterparts. This implies that GCRT J17453009 likely requires a coherent emission process, although whether or not it reflects a new class of sources is unclear.
Subject headings:
galaxy: center — infrared: stars — radio continuum: general — stars: variables: other — stars: low-mass, brown dwarfs1. Introduction
A blind search program using the Very Large Array (VLA) at 330 MHz (cm), made possible by new wide-field radio imaging techniques, has resulted in the discovery of two radio transients near the Galactic Center. One of these, GCRT J17453009, exhibits dramatic 1-Jy outbursts that last about 10 min and have a recurrence interval of about 77 minutes (Hyman et al., 2005).
GCRT J17453009 exhibited 5 bursts at 330 MHz, each lasting about 10 minutes, at apparently regular intervals of 77.1 min during a 7-hour VLA observation in September 2002. After several non-detections during the summer of 2003, a single burst was detected during a short Giant Metrewave Radio Telescope (GMRT) observation in September 2003 (Hyman et al., 2006), confirming that it is recurrent. It has since also been faintly detected in an additional GMRT observations from 2004, where it had a very steep nonthermal radio spectrum across the MHz bandpass (Hyman et al., 2007). It is at Galactic coordinates , , so it may be as close as 180 pc to the Galactic Center (GC), though the distance of GCRT J17453009 from the Earth is completely unknown. If it is at a distance pc from Earth, then the radio flux density combined with the rapid (min) decay of the bursts constrains its brightness temperature to exceed the K limit for incoherent synchrotron radiation (Readhead, 1994) and thus is very likely a coherent emitter. The positional coincidence with the GC, along with the greatly increasing source density near the Center, suggests it is at a distance of about 8 kpc, but this could be a selection effect because all the fields searched for transients in this program were in that direction. Consequently, it is very important to rule out local classes of sources as possible explanations.
Among the many possibilities discussed for the origin of GCRT J17453009, several involved low-mass stars or substellar objects (brown dwarfs, or BDs), which we generically call ultracool dwarfs. These were initially rejected as being unlikely or inconsistent with the observations (Hyman et al., 2005). However, additional observations are required to strengthen the case against the ultracool dwarfs and to confirm that the radio source is indeed a new type of source. Alternative models have also been proposed, ranging from a nulling pulsar (Kulkarni & Phinney, 2005), a double pulsar (Turolla, Possenti, & Treves, 2005), a transient white dwarf (WD) pulsar (Zhang & Gil, 2005), to a precessing radio pulsar (Zhu & Xu, 2006), but these will largely be constrained through other observations.
A number of BDs and late-type stars have now been detected at GHz frequencies, in many cases despite the absence of flaring optical or X-ray emission that would accompany radio emission from normal stars (see Berger 2006 for a review). These objects exhibit a range of nonthermal flaring behaviors, from strong, narrowband, fully polarized, bursting emission with frequency drifts (Burgasser & Putman, 2005), to periodic bursts suggestive of pulsar-like beaming (Hallinan et al., 2007), to order-of-magnitude variations spanning years (Antonova et al., 2007). In particular, the behavior found by Hallinan et al. (2007) for the M9 dwarf TVLM 51346546 is reminiscent of GCRT J17453009: bright bursts of coherent emission that follow the 2 hr rotation of the star. Although the bursts are orders of magnitude weaker than those seen for GCRT J17453009, the observations differ by an order of magnitude in wavelength, and there are no current limits on the radio behavior of ultracool dwarfs at meter wavelengths.
We then have two independent but complementary motivations for searching for a counterpart to GCRT J17453009 in the near-infrared (near-IR) and optical bands. First, we wish to see if there is any possible counterpart closer than pc: otherwise, we must conclude that the emission from GCRT J17453009 is coherent. Second, given the similarity between it and TVLM 51346546, we wish to see if GCRT J17453009 is associated with a nearby ultracool dwarf, although such an object could be more distant than pc as they can emit coherently. A single ultracool dwarf in the error circle of GCRT J17453009 would be strong evidence that it is the counterpart, even in the absence of a precise position, as one expects such object in a field (Reid et al. 1999; Caballero, Burgasser, & Klement 2008). We concentrated on the near-IR for several reasons: (1) if the source is at the distance of the Galactic Center, the average -band extinction, , at this position is approximately 2–3 magnitudes, corresponding to a visual extinction of 20 magnitudes (see e.g., Dutra et al. 2003); (2) if the source is a relatively nearby late-type star, it would be intrinsically red; and (3) the field towards the GC is very crowded, and near-IR observations often have better seeing than bluer bands. We augmented the traditional near-IR bands () with -band to aid in color discrimination (see below).
The structure of this paper is as follows. First, to aid the analysis that follows, we update our determination of the radio position of GCRT J17453009 in § 2. We then describe our optical and near-infrared data in § 3. The primary analysis is in § 4, where we attempt to constrain any ultracool dwarf counterpart to GCRT J17453009. Following this, in § 5 we also examine what constraints on other types of counterparts we can determine from our data. Finally, we give our conclusions in § 6.
2. An Updated Radio Position
Before we search for counterparts at other wavelengths, we need to use the most accurate position possible for GCRT J17453009, and we must correct for the significant ionospheric refraction prevalent at low frequencies. We therefore present a revised analysis of the radio position of GCRT J17453009. This position was obtained by registering the 330-MHz 2003 and 2004 GMRT images with respect to the revised 6- and 20-cm source positions determined by White, Becker, & Helfand (2005) in their reanalysis of the Galactic plane radio survey (GPRS) of 586 compact sources (Zoonematkermani et al., 1990; Helfand et al., 1992; Becker et al., 1994). Our previous reports on GCRT J17453009 used either the initial GPRS survey or the much lower resolution NRAO VLA sky survey (Condon et al., 1998) to register the 330-MHz images.
We compared 13 and 19 sources within the primary beams of the 2003 and 2004 observations, respectively, with their 5- and 1.4-GHz (6- and 20-cm) counterparts. Five of the sources were detected at both 5 and 1.4 cm, and the average source positions were calculated for these. The 6 or 20 cm coordinates of the other 27 sources were shifted by one-half of the average difference ( in right ascension and in declination) we found between the 5- and 1.4-GHz positions of the five sources mentioned above and three others that were not detected at 330 MHz.
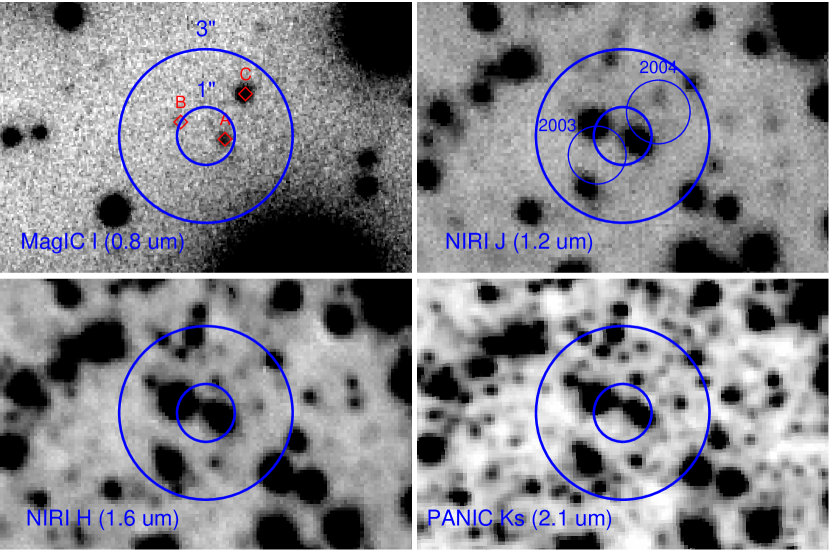
The position correction is determined to be in R.A. and in Dec. for the 2003 observation and in R.A. and in Dec. for the 2004 observation. The measured position of GCRT J17453009 was corrected by these differences at each of the two epochs. After correction, the two positions are consistent at roughly the 1 level, as shown in Figure 1. A weighted average of the two yields a position of (J2000) , , with a 1- uncertainty of on each coordinate. To be conservative and allow for astrometric frame uncertainties (which should be in each coordinate; see below), we use a position uncertainty in the near-IR of , and consider objects within 3- ( radius) of the position of GCRT J17453009.
| Date | Telescope | Instrument | Band | Exposure | Seeing |
|---|---|---|---|---|---|
| (sec) | (arcsec) | ||||
| 2005-Jul-12 | Magellan I/Baade | PANIC | (2.1 ) | 1800 | 0.4 |
| 2005-Jul-13 | (1.2 ) | 1920 | 0.8 | ||
| 2005-Jul-14 | (1.6 ) | 2460 | 0.7 | ||
| 2005-Jul-14 | Gemini North | NIRI | (1.2 ) | 840 | 0.5 |
| (1.6 ) | 840 | 0.5 | |||
| (2.1 ) | 780 | 0.4 | |||
| 2006-Jun-20 | Magellan II/Clay | MagIC | (0.8 ) | 3660 | 0.4 |
Note. — PANIC is Persson’s Auxiliary Nasmyth Infrared Camera on the 6.5-m Baade (Magellan I) telescope (Martini et al., 2004). NIRI is the Near-Infrared Imager on the 8-m Gemini North telescope (Hodapp et al., 2003). MagIC is the Raymond and Beverly Sackler Magellan Instant Camera on the 6.5-m Clay (Magellan II).
3. Optical and Infrared Observations & Reduction
We obtained near-infrared ( bands, covering wavelengths 1.2–2.1 ) photometric observations of GCRT J17453009 in the summer of 2005 with both PANIC on the Magellan I/Baade telescope and NIRI on the Gemini North telescope: see Table 1 for details. We also observed GCRT J17453009 in the -band (0.8 ) in 2006 with Magellan.
The near-infrared (PANIC and NIRI) reduction was similar for both instruments. For NIRI, there is an IRAF package to reduce the data available from the NIRI web site111See http://www.us-gemini.noao.edu/sciops/instruments/niri/NIRIIndex.html.. We proceeded through the steps of this package, flatfielding the data, subtracting the sky, shifting the images, and adding them together. For PANIC, we used our own routines in PyRAF, but the steps were similar.
We referenced the astrometry and photometry of the PANIC data to the Two Micron All Sky Survey (2MASS; Skrutskie et al. 2006). For the astrometry, we used 210 2MASS stars that we identified as not blended or badly saturated for and bands and 135 stars for -band, getting rms residuals of in each coordinate. The net uncertainty is in each coordinate, dominated by the uncertainty in the tie between 2MASS and the International Celestial Reference System (ICRS). We used fewer stars for photometry, since we avoided sources that showed any signs of saturation or significant non-linearity in the data. However, we still used stars in -band and stars in and bands. We estimate zero-point uncertainties of 0.1 mag for -band and 0.05 mag for and bands, with the larger uncertainty at -band from the smaller number of stars and the greater effects of saturation.
For the NIRI data, we used 116 2MASS stars for the astrometry, and obtained rms residuals of in each coordinate. For the photometry, we tried to reference it to 2MASS and found zero-point magnitudes reasonably close to those in the NIRI manual, but many of the 2MASS stars showed some signs of saturation and therefore we wanted to check with another method of calibration. We used an observation of the standard star FS 140. We corrected for the difference in airmass between the standard star observation and the observations of GCRT J17453009 using the extinction coefficients listed for the Keck telescope222See http://www.us-gemini.noao.edu/sciops/instruments/niri/standards/UKIRT-fs.html. (also on Mauna Kea), although these corrections were minor. There might have been some small variations in extinction due to clouds over the course of the night (from the Canada France Hawaii Telescope sky probe). Overall, the zero-point magnitudes from both methods agreed to within 0.1 mag, and measurements of stars from PANIC and NIRI agreed to within this limit as well. We therefore assign a zero-point uncertainty of 0.1 mag to all of the NIRI data.
For the -band data, we did standard reduction in IRAF by subtracting overscan regions, merging the data from four amplifiers, and flatfielding the data with twilight flats. We registered the astrometry to that of the PANIC -band image, using 248 stars that were not blended or badly saturated, and obtained rms residuals of in each coordinate. For photometry, we used observations of the standard fields L113-339 and NGC 6093 (Landolt, 1992; Stetson, 2000), and we estimate a zero-point uncertainty of 0.1 mag.
4. Search for an Ultracool Dwarf
When we consider seeing and depth, our best set of images in the near-IR are the NIRI images in and bands, and the PANIC -band image: unless otherwise noted, all references to , , and band images refer to those. We show the best near-IR images plus the -band image in Figure 1. The other near-IR data are mostly useful as a check, but we note that we see no variability in the sources within the error circle over the 1–2 day span between the observations.
Since the -band image shows by far the most objects and has the best seeing, we computed aperture photometry for all of the sources in that image using sextractor (Bertin & Arnouts, 1996). We then used those source positions to run sextractor on the , and images, generating a set of source photometry in four bands, which we supplemented with 2MASS photometry for the sources that were saturated on our images. We repeated this procedure but starting this time from the -band image: this picked up many fewer sources, but they sample a larger range in color space.
Overall, we found 3- limiting magnitudes for the -band images of 26, 21, 20, and 19, respectively. However, these limits apply over the images as a whole, and especially for the longer wavelengths are dominated by the effects of confusion. Therefore, we can detect sources that are considerably fainter than the quoted limit, although not in all regions.
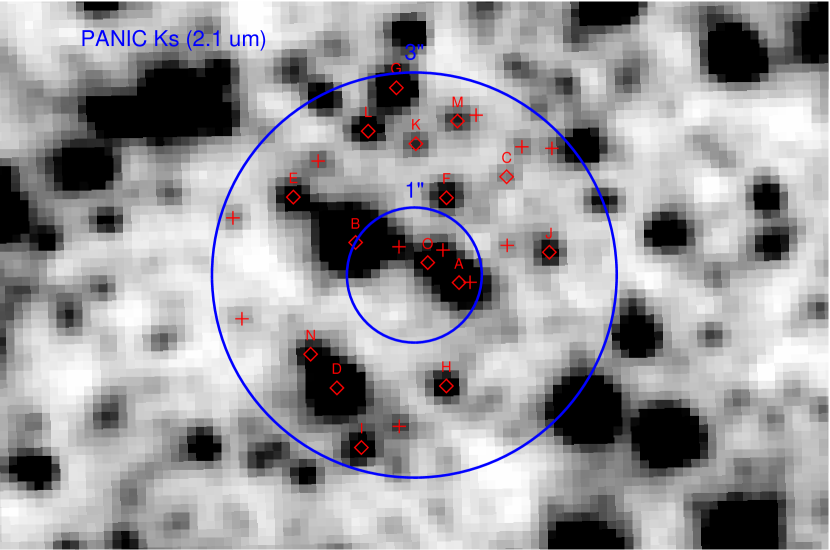
For the sources in the 3- error circle we were more careful about the photometry. We used PSF fitting routines from DAOPHOT (Stetson, 1987) within IRAF. For each band, we modeled the PSF from an ensemble of about 50 stars that were well separated from all neighbors and where our aperture photometry was not corrupted by any bad pixels or cosmic rays. We then iteratively fit the PSF models to the sources within the error circle, identifying the brighter objects, subtracting them, and then examining the residual image for any fainter neighbors. What is most striking about the images is the crowding at -band compared to the relatively empty field at -band: we detect at least sources in the former, compared to only 3 in the latter.
For the 15 objects with detections in at least two bands, we give the PSF photometry in Table 2 (also see Figure 2), where we have attempted to combine the photometry from the different images even though it is not always perfectly clear how to do so given the differences in seeing and brightness. For instance, in the -band image object A is relatively bright, but is surrounded by a number of nearby objects that are mag fainter. However, in the -band image all of those objects are blended together, and so we ascribe all of the flux to object A in that band. It is clear that we have detected sources fainter than the nominal limiting magnitudes given above. There may be some additional faint objects remaining in the -band image that we could have included, but none of these is detected in any other band, so they are of limited utility in our attempt to find a counterpart to GCRT J17453009.
To define the sort of object that we are searching for, we consider the results of Reid et al. (2001), Dahn et al. (2002), and Vrba et al. (2004). Together, these papers discuss the classification and absolute photometry of cool dwarf stars and BDs. They establish the broad-band colors as a function of spectral type for stars with spectral types ranging from late M through T (also see Caballero et al. 2008, which draws data from many of the same sources and gives distance limits similar to those presented here). In particular, Dahn et al. (2002) includes photometry in the bands. We note, though, that there may be difficulties in comparing our photometry with results from the literature, especially in the -band. That is because, as is discussed by Dahn et al. (2002), the majority of the flux from cool stars in that bandpass is at the very red edge, and therefore details of the filter cutoff and the detector response become quite important. When calibrated, as we did, with an ensemble of stars of a range of moderate spectral types, the calibration may have errors when applied to very red objects. We did not have sufficient calibration data to solve for color or extinction terms. We must therefore allow for additional zero-point uncertainties when examining potential BDs in the -band; this should be less than a few tenths of a magnitude for stars earlier than L5, but for later stars could even be mag (A. Burgasser, priv. communication). There are also differences between the near-IR filters used (CIT vs. 2MASS, usually), but those are generally smaller than our zero-point uncertainties and we have applied basic corrections for them (Carpenter, 2001; Dahn et al., 2002).
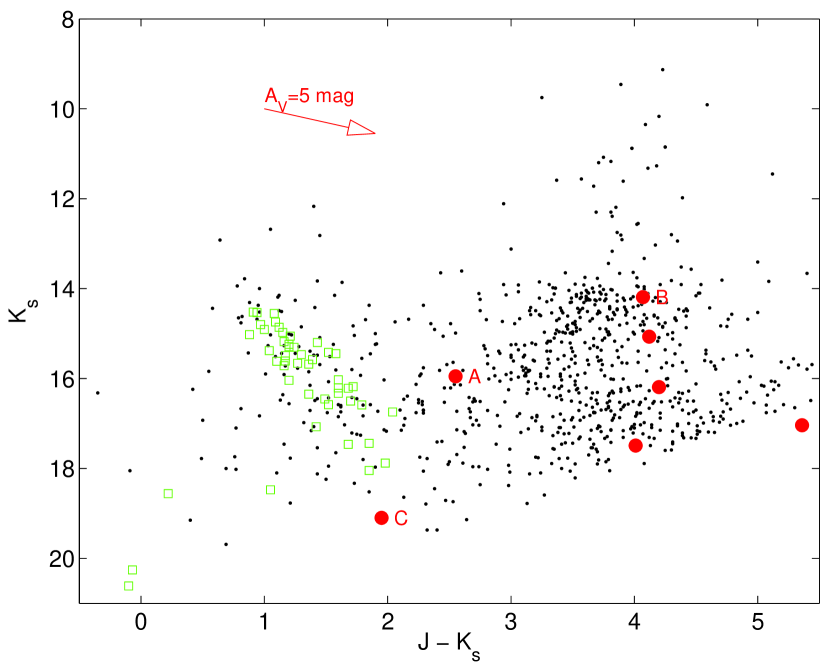
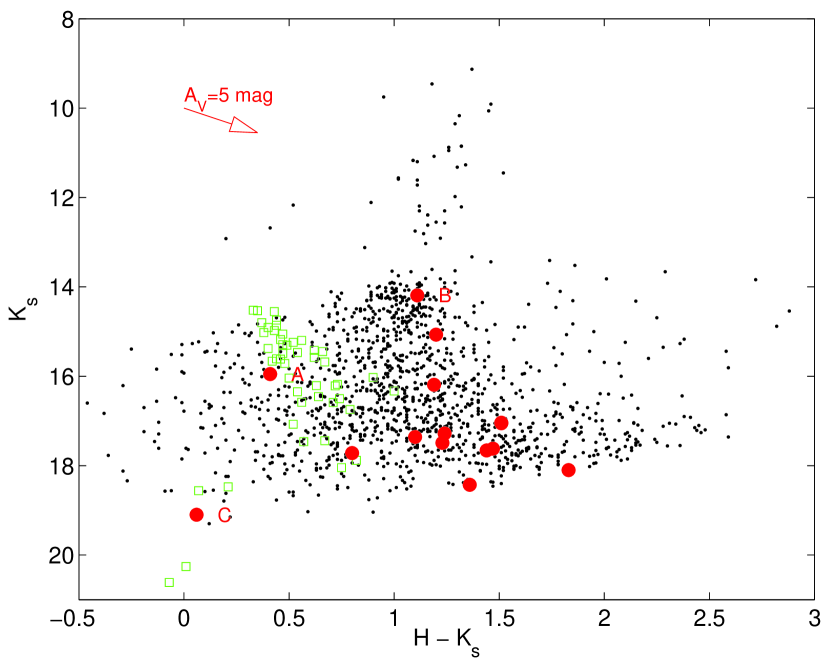
Objects with spectral types down to late L have absolute magnitudes of , absolute magnitudes of , and magnitudes of or so. The color for those objects ranges from at the bright end to at the faint end, while goes from 1 to 2 over the same range. For later-type stars, the absolute magnitude increases to about 16.5 at T9 ( increases to about 22 and increases to about 17), and the stars become redder in (up to about 5.5), but they become bluer in (to about 0). See Figure 3.
| ID | ||||||
|---|---|---|---|---|---|---|
| AaaThese objects are within of the radio position of GCRT J17453009. | 24.25(4) | 18.50(2) | 16.36(2) | 15.95(6) | ||
| B | 25.36(10) | 18.26(2) | 15.30(1) | 14.19(3) | ||
| C | 23.05(1) | 21.05(7) | 19.16(8) | 19.10(15) | ||
| D | 19.19(3) | 16.27(1) | 15.07(3) | |||
| E | 22.40(24) | 18.55(7) | 17.04(5) | |||
| F | 21.50(9) | 18.72(5) | 17.49(6) | |||
| G | 20.39(6) | 17.38(3) | 16.19(4) | |||
| H | 18.46(7) | 17.36(5) | ||||
| I | 18.56(5) | 17.05(6) | ||||
| J | 19.10(9) | 17.66(7) | ||||
| K | 19.79(8) | 18.43(6) | ||||
| L | 18.52(4) | 17.28(5) | ||||
| M | 19.93(10) | 18.10(5) | ||||
| N | 19.09(7) | 17.62(5) | ||||
| OaaThese objects are within of the radio position of GCRT J17453009. | 18.52(7) | 17.72(8) |
Note. — See Figure 2. The quantities in parentheses are 1- statistical uncertainties on the last digit only: there are additional zero-point uncertainties of 0.1 mag.
4.1. Implications of Non-detections
In searching for a nearby, ultracool counterpart to GCRT J17453009, we first treat all objects detected in the error circle as unrelated background stars (we will examine the validity of this assumption in § 4.2). This will enable us to make some general statements about the field and to derive some useful relations. We assume that any extinction will be minimal: at the distances of interest here (pc), we expect mag or so (based on Drimmel, Cabrera-Lavers, & López-Corredoira 2003), which translates to an extinction of mag at -band.
We will start our examination with the -band image: while there are calibration uncertainties, the depth of the image and the lack of crowding make it preferable. The PSF fitting and subtraction did not reveal any fainter objects in the error circle, and the background is regular enough that we are not dominated by confusion. Using the data from Dahn et al. (2002), we derive the absolute magnitude as a function of spectral type :
| (1) |
where for spectral type M7, 10 for spectral type L0, and goes up to 20 for spectral type T0; the dispersion is about 0.5 mag, and it is not valid for later spectral types. We use this with our -band detection threshold of to limit the spectral type as a function of distance that a non-detection in -band implies:
| (2) |
So for no detection in -band, we can exclude almost all M and L type objects out to pc. Even with the scatter on the relation and the calibration uncertainties, this should be a relatively robust result. More typical main-sequence stars (spectral types K and earlier) are excluded closer than about kpc (see discussion of object C in § 4.2).

Moving to -band, we still detect only 7 objects. Here the PSF subtraction did reveal fainter objects, and we have included them to the best of our ability. With an approximate upper limit of and the relation from Dahn et al. (2002): , we can again limit:
| (3) |
so the implications are similar. For later spectral types, we can use the comparable relation from Vrba et al. (2004) for T dwarfs, and we limit possible objects to later than T7 or so at pc and and later than T4 or so at pc (the relation is more complicated than the linear forms above, so we do not give a simple expression).
TVLM 51346546, the pulsating dwarf found by Hallinan et al. (2007), is of spectral type M9 () and at a distance of pc (Leggett et al., 2001). To have such an object be fainter than our -band limit would require a distance of kpc, although this will be somewhat of an over estimate, since for kpc the extinction will start to contribute. Assuming an average extinction in the -band of , we can still exclude an M9 star within kpc. The observed flux density from TVLM 51346546 peaks at a few mJy at frequencies of 4 and 8 GHz (8 and 4 cm). In comparison, bursts from GCRT J17453009 have peak flux densities of Jy at 330 MHz, although this has been observed to vary by a factor of (Hyman et al., 2007). Scaling TVLM 51346546 to 1 kpc we would expect peak flux densities of Jy at 5 GHz (6 cm); having the flux density be Jy at MHz would require an average spectral index of over more than a decade of frequency (where ), inconsistent with typical spectral indices observed from M dwarfs (0 to ; Güdel et al., 1993). Similar conclusions come from comparison with the L3.5 dwarf 2MASS J00361617+1821104 observed by Berger et al. (2005), which has a hr periodicity in the radio (implied spectral index for a flux density of Jy at MHz). This is far steeper than almost any known source (e.g., Kaplan et al., 2000) and inconsistent with the flat-spectrum bursts from TVLM 51346546 (Hallinan et al., 2006) and dwarf stars in general (Güdel & Benz, 1996), although such steep emission should be possible (Erickson, 1999) and the bursts for GCRT J17453009 reported by Hyman et al. (2007) do have a very steep spectral index of across a narrow (32 MHz) bandpass. Bastian et al. (1990) found a similarly steep spectrum across a MHz bandpass for the dMe star AD Leo at GHz (20 cm), but the spectrum here has opposite sense (). In both cases it seems difficult to extrapolate the steep spectra over a wide range in frequency, but the similarity may point to band-limited emission from both sources.
4.2. Examinations of Detected Objects
We now examine the objects that we did detect in the 3- error circle around the position of GCRT J17453009. We start with the objects detected in -band: as we discussed above, a non-detection in -band generally rules out objects of interest, at least for spectral types earlier than L9 or so.
In -band, there are three objects that we detect: A, B, and C (Tab. 2 and Fig. 2). We plot them, along with the other objects from the field, in Figure 3. The first two objects are quite bright in the longer wavelengths, but faint in -band ( and for A; and for B). In both of those cases, the colors are generally too red for any sort of nearby, low-mass star or ultracool dwarf, as we would not expect anything with or , as discussed above333We must be a little careful with the -band and especially -band magnitudes for these stars, as they are separated into several stars in -band but not in the bluer bands. Therefore, the and magnitudes could actually be lower limits. This would tend to make the objects fainter in those bands and hence redder, though, so our conclusions are reasonably secure. The -band magnitude also appears secure.. Instead, these objects are most likely distant, reddened giant stars that are consistent with the bulk of the objects in the field (see Fig. 3).
Object C is more interesting. It is in the right color range (, ) to be an ultracool dwarf. However, the colors are a bit contradictory, as can be seen from comparison with the ultracool dwarfs plotted in Figure 3. From the color, we could guess a spectral type around late L, but the color implies a much earlier object (early M). The color is also bluer than expected for a late L object, but given the blueward trend for T0 and later, it could be a T dwarf. Some of these discrepancies could be due to the difficulty in applying our -band calibration to a red object, but the and implications differ as well. Based on the relation from Vrba et al. (2004), object C would have spectral type
| (4) |
(this relation is really only valid for L dwarfs). So for the nominal distance of pc, we would expect a very late L/early T object (again neglecting extinction).
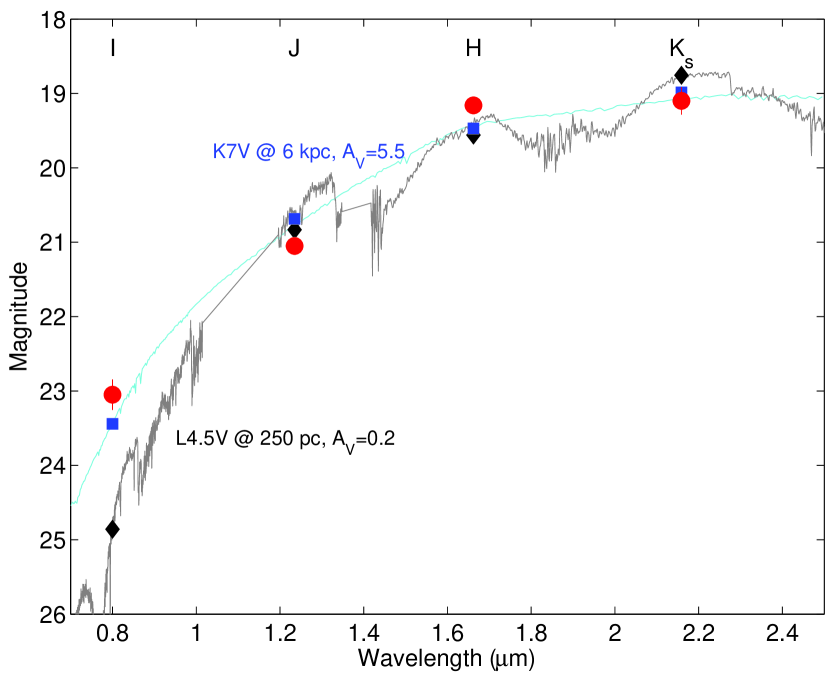
Fitting all of the objects in Dahn et al. (2002) and Vrba et al. (2004) to our data and restricting the fit to , the best fits are for spectral types around L5 (Fig. 4) and distances around 200 pc (roughly consistent with the relation above). There are systematic deviations between the catalog objects and C, where they underpredict the - and -band magnitudes (typically by about 0.3 mag) and overpredict the -band magnitude (by a similar amount). These differences are systematic in direction, but are not greatly larger than the variation within the brown-dwarf sequence (typically mag; Dahn et al. 2002; Vrba et al. 2004). Perhaps this variation can be attributed to poor calibration of the other bands, although our checks with 2MASS stars had much smaller residuals ( mag). The catalog photometry was generally in the Caltech (CIT) photometric system, and we converted it to the 2MASS system using the transformations from Carpenter (2001). For most colors, the differences are small, but those transformations were not necessarily appropriate for L or T dwarfs. For the reddest stars there could be deviations of mag between -band in the two systems, which would not really reconcile the differences discussed above, but could help in some cases. Perhaps age or metallicity could be the culprits, although they are unlikely to be significant for objects in the Galactic plane but outside of star clusters. A small amount of reddening helps the fit, but we cannot accommodate very much reddening without being unphysical given the distance.
Much more significant is the difference in -band magnitude for the data from Dahn et al. (2002). Fitting only the bands as discussed above, we find that our -band measurement is mag brighter than the catalog objects (such as the fit in Fig. 4). If we fit all four bands, the quality of the fit gets considerably worse, with deviations of mag common, and the best fits move to earlier type stars (late M to L0) at greater distances. These deviations are far larger than what is seen among brown dwarfs, and do not seem like they can be easily accommodated by reddening, metallicity, or calibration issues. It may be that there is a disk or other complication that gives rise to different colors and explains the radio emission, but without additional details this would be very difficult to constrain.
However, object C is also quite compatible with being a main-sequence star (Fig. 4). We get a roughly reasonable fit for all four bands (residuals of 0.25 mag or so) using the main-sequence photometry from a late K/early M star at kpc with mag (Cox, 2000; Kurucz, 1993; Baraffe et al., 1998). Allowing for differences in the reddening law and metallicity, such a classification seems reasonable.
Beyond -band, all of the objects detected at but not are similar in colors to object B, with very red colors indicative of distant, reddened giant stars.
5. Constraints on Other Source Types
5.1. A White Dwarf
Zhang & Gil (2005) proposed a model for GCRT J17453009 where it was a “white dwarf pulsar”: a rotating, magnetized WD that, in analogy with traditional pulsars, emits light due to conversion of rotational energy to electromagnetic waves/particles through a strong magnetic field. At the wavelengths considered here, WDs generally have neutral colors (, etc.), since they are moderately well approximated by warm-to-hot blackbodies with effective temperatures K (e.g., Bergeron et al., 1995, 1997, 2001; Wachter et al., 2003; Holberg & Bergeron, 2006; Hoard et al., 2007) and the magnitudes we are using are based on Vega, another hot blackbody. While approximate, this should be accurate to mag or so. Based on this, none of the objects detected in -band is consistent with being a WD.

We next determine a distance limit inside of which there are no WDs. For the -band magnitude of a WD with radius , effective temperature , and distance , we have
| (5) | |||||
where is the magnitude of some fiducial object with radius , effective temperature , and distance , and is the extinction at -band (and the same for the other bands). This assumes that we are on the Rayleigh-Jeans portion of the spectrum, which is largely true for K and wavelengths redward of -band, and takes care of the bolometric corrections needed to transform a blackbody into observed bands. For the fiducial values, we use the average of the objects from the sample of Bergeron et al. (2001): , K, pc, and . In reconstructing the values from that sample, choice of a fiducial gives the other sources to an accuracy of mag, comparable to the scatter of the WD sample of Wachter et al. (2003) in the color-color plane (we are also mixing WDs of different surface composition, but the differences at wavelengths of interest are small).
We can then use these relations to limit WDs in the error circle of GCRT J17453009. Since the limiting magnitude is highest for -band, that is the most constraining. Here we need to take the extinction into account more explicitly, since the distances are pc and it will be significant. Assuming an average extinction of , we find the distance limits plotted in Figure 5. The limits are a function of WD radius and effective temperature, but for typical temperatures (5000–20,000 K) and radii () our -band limit implies no WD closer than kpc. We compare this lower limit with the nominal distance upper limit of kpc derived by Zhang & Gil (2005) for a WD pulsar (with the constraint that the radio luminosity not exceed the rate of rotational energy loss), and see that their basic model is not consistent with our observations.
There are also occasional WDs that are considerably cooler (e.g., K for the source from Hodgkin et al. 2000) and which can have bizarre near-infrared colors ( but for the same object). Such objects tend to be quite blue in the near-IR, despite their cool temperatures. The near-IR flux is considerably less than one would predict from the optical blackbody, with a deficit of more than one order of magnitude at . -band is better behaved, but the data are still 1.5 mag fainter than our simplistic prediction above. Even so, none of the objects that we detected would be consistent with a cool WD since they all have red , and our -band limit still constrains such an object to be more distant than kpc.
5.2. A Star At the Galactic Center
We can also see what limits our data can place on a possible stellar object at the Galactic Center. Here extinction is the largest unknown. We begin by assuming –30 mag at a distance of kpc (e.g., Dutra et al., 2003), but there could be a wide range of possible extinctions (both in total column density and in variation with wavelength; e.g., Nishiyama et al. 2006; Gosling, Blundell, & Bandyopadhyay 2006; Gosling et al. 2007) due to local clouds.
With such a combination, our data are not very constraining. We can largely exclude supergiants based on the expected magnitudes: the faintest (which are actually the hottest, such as B0I) would have (based on Cox 2000, although we note that supergiants have a wide observed range in luminosity), while the brightest star we find in the error circle has (object B). So we would need 2 additional magnitudes of extinction at , or additional magnitudes at -band (e.g., Mathis, 1990), for a total mag. This is larger than we would expect, although not completely unreasonable. It would, though, be rather redder than what we observe for object B: we find , but a supergiant with mag would have . Variations in the extinction law would have to be far larger than observed (e.g., Nishiyama et al., 2006; Gosling et al., 2007) to agree with the data. Later-type supergiants would have even worse agreement. They are brighter in the -band, so we would need additional extinction to get them to agree with our observed magnitude. But they are also redder, and with that additional extinction they would be redder still, such that a K0I star would have (and would require mag!).
For other luminosity classes, though, we can say very little. There are certainly giant stars at the Galactic Center consistent with objects in the error circle, and main sequence stars are even easier to accommodate. We cannot exclude any of the canonical mass donor stars of Low Mass X-ray Binaries or Cataclysmic Variables (G–M main sequence stars) at the distance of the Galactic Center. For instance, object B is generally consistent with a K2III star at 8.5 kpc and with an extinction of mag, although other possibilities are certainly possible given the degeneracies between reddening and spectral type, especially if one allows for a changing extinction law.
6. Discussion and Conclusions
We have examined relatively deep images of the field of GCRT J17453009 taken under good conditions (seeing better than ) meant to search for a possible nearby counterpart to the radio transient. Such an object would have to be at a distance pc in order to not violate the K brightness temperature limit on incoherent sources. Beyond that, we searched for nearby ultracool dwarfs at a range of distances.
Examining data at wavelengths from to , we find that the field changes dramatically. Only three objects are detected at the shortest wavelength, compared to more than 20 at the longest wavelength. Two of the three sources detected at are background giant stars. The third (object C) is most likely a late-type K star at a moderate distance (kpc). We cannot entirely rule out the possibility that it is an object of type L5, but this is not consistent with the -band photometry and would still be at a distance of pc: further than the pc limit discussed above. If it is of a late K type, object C is unlikely to be the source of the radio emission. While isolated K stars typically do not show strong radio flares, it is possible but generally at fainter flux levels (Güdel, 2002). Given the radio luminosities typically seen (; Güdel 2002), it would be far too faint to be the source of the radio emission from GCRT J17453009. However, the radio luminosities seen to date for K stars may not include the brightest transient events.
Some K stars in binaries (e.g., RS CVn binaries; Güdel 2002) also show coherent radio flares. Such objects have peak fluxes of Jy, even at relatively low radio frequencies (e.g., van den Oord & de Bruyn, 1994), and for the distances implied for object C (possibly underestimated if it is a binary, especially if it is evolved like the K star in the prototypical RC CVn binary HR 1099) it would again be far too faint.
If we have not detected the counterpart, we use constraints from the shorter wavelengths, where the field is much less crowded, to limit the presence of any low-mass object. For distances of pc, we can exclude stars earlier than T7 (with related limits of stars earlier than T4 at pc, M9 at kpc, M5 at kpc, etc.) or so based on the - and -band photometry.
Our search is limited by the sample of comparison objects that we used: nearby ultracool dwarfs with good photometry and (often) astrometry. We therefore cannot exclude the possibility that object C is some peculiar type of ultracool dwarf, where the mis-match in the -band reflects some intrinsic difference of this object, but we require additional constraints to be able to decide conclusively one way or the other. While the source is bright enough at -band for spectroscopy with large telescopes, -band spectroscopy is likely to prove most productive, as the source is much easier to isolate from the nearby objects. Additional photometry will suffer from the near degeneracy between effective temperature and reddening seen in Figure 4 and the difficulty of calibrating data where the spectrum is dropping so sharply, but spectra should be able to distinguish cleanly between the largely featureless spectrum of a late-K/early-M star and the deep metal hydride absorption of an L dwarf. Our conclusions are also dependent on a lack of significant variability: fluctuations of mag would not change things, but larger variations might. We see good agreement between the two sets of near-IR data (from PANIC and NIRI). However, those data were taken within two nights of each other. Variations over longer timescales, such as the yr between the near-IR and optical observations, or even short flares, could still be present, although we note that we compared our data with photometry of the 3 sources (A, B, and D) within the error circle that are visible in the UKIRT Infrared Deep Sky Survey (UKIDSS) Galactic Plane Survey Data Release 3 (see Lawrence et al. 2007; Lucas et al. 2007) taken 2 years after our near-IR data and see no sign of variability at levels mag; below that, it is difficult to compare given the differences in calibration, seeing, and photometric technique. Additional monitoring could help address this issue.
With the same data, we have attempted to constrain other source types as possible counterparts to GCRT J17453009. We find that no white dwarf nearer than kpc could be present in the error circle, nor could there be a supergiant star at the distance of the Galactic Center. However, both of those conclusions have the same limitations as that discussed above. Namely, we searched for objects that resemble other, known objects. If the radio emission from GCRT J17453009 really marks it as a unique object than the counterpart that we seek could have dramatically different properties. The presence of a binary companion, accretion disk, or other anomaly could also complicate things (e.g., Hoard et al., 2007), although most such additions to the system would make it brighter and hence would still largely be ruled out.
With all of the analysis above, we have excluded virtually any white-dwarf or non-degenerate star as counterpart to GCRT J17453009 within pc, and many sources are excluded within kpc. We are therefore left with the conclusion that GCRT J17453009 likely emits via a coherent process. What this means, though, is unclear. Coherent emission with brightness temperatures as high as K (e.g., Slee, Wilson, & Ramsay 2008; Osten & Bastian 2008) and sometimes higher have been seen from isolated stars and binaries, either relating to magnetic activity from the stars or from interaction between the members of the binary (Güdel, 2002; Osten, 2008). The emission seen from GCRT J17453009 does not really resemble the known radio emission from such sources, although this may reflect the limitations of our observations. As discussed above, most sources have been observed to be significantly fainter than GCRT J17453009, but the comparison may be unfair since the behavior across such a wide range of frequencies and timescales is not known. If we remove the flux/luminosity constraints, the emission from GCRT J17453009 is actually not dissimilar to some ultracool dwarfs (such as the results of Berger et al. 2005 and Hallinan et al. 2006). Time-resolved analysis at frequencies of MHz (cm) have been rare especially in recent years (e.g., van den Oord & de Bruyn, 1994), and we really do not know how known radio sources behave there. It seems likely that either GCRT J17453009 represents new low-frequency behavior from a known class of sources, or that it is indeed the first member of a new class. Searches for counterparts to GCRT J17453009 at other wavelengths (especially X-rays, where the searches so far have not been very constraining; Hyman et al. 2005), along with further characterization of the radio properties of both GCRT J17453009 and other transient sources, are required to help elucidate its nature.
References
- Antonova et al. (2007) Antonova, A., Doyle, J. G., Hallinan, G., Golden, A., & Koen, C. 2007, A&A, 472, 257
- Baraffe et al. (1998) Baraffe, I., Chabrier, G., Allard, F., & Hauschildt, P. H. 1998, A&A, 337, 403
- Bastian et al. (1990) Bastian, T. S., Bookbinder, J., Dulk, G. A., & Davis, M. 1990, ApJ, 353, 265
- Becker et al. (1994) Becker, R. H., White, R. L., Helfand, D. J., & Zoonematkermani, S. 1994, ApJS, 91, 347
- Berger (2006) Berger, E. 2006, ApJ, 648, 629
- Berger et al. (2005) Berger, E., et al. 2005, ApJ, 627, 960
- Bergeron et al. (2001) Bergeron, P., Leggett, S. K., & Ruiz, M. T. 2001, ApJS, 133, 413
- Bergeron et al. (1997) Bergeron, P., Ruiz, M. T., & Leggett, S. K. 1997, ApJS, 108, 339
- Bergeron et al. (1995) Bergeron, P., Saumon, D., & Wesemael, F. 1995, ApJ, 443, 764
- Bertin & Arnouts (1996) Bertin, E. & Arnouts, S. 1996, A&AS, 117, 393
- Burgasser & Putman (2005) Burgasser, A. J. & Putman, M. E. 2005, ApJ, 626, 486
- Caballero et al. (2008) Caballero, J. A., Burgasser, A. J., & Klement, R. 2008, A&A, in press, (arXiv:0805.4480)
- Cardelli et al. (1989) Cardelli, J. A., Clayton, G. C., & Mathis, J. S. 1989, ApJ, 345, 245
- Carpenter (2001) Carpenter, J. M. 2001, AJ, 121, 2851
- Castelli & Kurucz (2003) Castelli, F. & Kurucz, R. L. 2003, in IAU Symp. 210, Modelling of Stellar Atmospheres, ed. N. Piskunov and W. W. Weiss and D. F. Gray (San Fransisco: ASP), arXiv:astro-ph/0405087
- Condon et al. (1998) Condon, J. J., Cotton, W. D., Greisen, E. W., Yin, Q. F., Perley, R. A., Taylor, G. B., & Broderick, J. J. 1998, AJ, 115, 1693
- Cox (2000) Cox, A. N. 2000, Allen’s Astrophysical Quantities, 4th edn. (New York: AIP Press/Springer)
- Dahn et al. (2002) Dahn, C. C., et al. 2002, AJ, 124, 1170
- Drimmel et al. (2003) Drimmel, R., Cabrera-Lavers, A., & López-Corredoira, M. 2003, A&A, 409, 205
- Dutra et al. (2003) Dutra, C. M., Santiago, B. X., Bica, E. L. D., & Barbuy, B. 2003, MNRAS, 338, 253
- Erickson (1999) Erickson, W. C. 1999, in ASP Conf. Ser., Vol. 180, Synthesis Imaging in Radio Astronomy II, ed. G. B. Taylor, C. L. Carilli, & R. A. Perley (San Fransisco: ASP), 601
- Gosling et al. (2007) Gosling, A. J., Bandyopadhyay, R. M., Miller-Jones, J. C. A., & Farrell, S. A. 2007, MNRAS, 380, 1511
- Gosling et al. (2006) Gosling, A. J., Blundell, K. M., & Bandyopadhyay, R. 2006, ApJ, 640, L171
- Güdel (2002) Güdel, M. 2002, ARA&A, 40, 217
- Güdel & Benz (1996) Güdel, M. & Benz, A. O. 1996, in Astronomical Society of the Pacific Conference Series, Vol. 93, Radio Emission from the Stars and the Sun, ed. A. R. Taylor & J. M. Paredes (San Fransisco: ASP), 303
- Güdel et al. (1993) Güdel, M., Schmitt, J. H. M. M., Bookbinder, J. A., & Fleming, T. A. 1993, ApJ, 415, 236
- Hallinan et al. (2006) Hallinan, G., Antonova, A., Doyle, J. G., Bourke, S., Brisken, W. F., & Golden, A. 2006, ApJ, 653, 690
- Hallinan et al. (2007) Hallinan, G. et al. 2007, ApJ, 663, L25
- Helfand et al. (1992) Helfand, D. J., Zoonematkermani, S., Becker, R. H., & White, R. L. 1992, ApJS, 80, 211
- Hoard et al. (2007) Hoard, D. W., Wachter, S., Sturch, L. K., Widhalm, A. M., Weiler, K. P., Pretorius, M. L., Wellhouse, J. W., & Gibiansky, M. 2007, AJ, 134, 26
- Hodapp et al. (2003) Hodapp, K. W., et al. 2003, PASP, 115, 1388
- Hodgkin et al. (2000) Hodgkin, S. T., Oppenheimer, B. R., Hambly, N. C., Jameson, R. F., Smartt, S. J., & Steele, I. A. 2000, Nature, 403, 57
- Holberg & Bergeron (2006) Holberg, J. B. & Bergeron, P. 2006, AJ, 132, 1221
- Hyman et al. (2005) Hyman, S. D., Lazio, T. J. W., Kassim, N. E., Ray, P. S., Markwardt, C. B., & Yusef-Zadeh, F. 2005, Nature, 434, 50
- Hyman et al. (2006) Hyman, S. D., Lazio, T. J. W., Roy, S., Ray, P. S., Kassim, N. E., & Neureuther, J. L. 2006, ApJ, 639, 348
- Hyman et al. (2007) Hyman, S. D., Roy, S., Pal, S., Lazio, T. J. W., Ray, P. S., Kassim, N. E., & Bhatnagar, S. 2007, ApJ, 660, L121
- Indebetouw et al. (2005) Indebetouw, R., et al. 2005, ApJ, 619, 931
- Kaplan et al. (2000) Kaplan, D. L., Cordes, J. M., Condon, J. J., & Djorgovski, S. G. 2000, ApJ, 529, 859
- Kulkarni & Phinney (2005) Kulkarni, S. R. & Phinney, E. S. 2005, Nature, 434, 28
- Kurucz (1993) Kurucz, R. 1993, ATLAS9 Stellar Atmosphere Programs and 2 km/s grid. Kurucz CD-ROM No. 13. Cambridge, Mass.: Smithsonian Astrophysical Observatory, 1993., 13
- Landolt (1992) Landolt, A. U. 1992, AJ, 104, 340
- Lawrence et al. (2007) Lawrence, A., et al. 2007, MNRAS, 379, 1599
- Leggett et al. (2001) Leggett, S. K., Allard, F., Geballe, T. R., Hauschildt, P. H., & Schweitzer, A. 2001, ApJ, 548, 908
- Lucas et al. (2007) Lucas, P. W., et al. 2007, MNRAS, submitted (arXiv:0712.0100)
- Martini et al. (2004) Martini, P., Persson, S. E., Murphy, D. C., Birk, C., Shectman, S. A., Gunnels, S. M., & Koch, E. 2004, Proc. SPIE, 5492, 1653 (astro-ph/0406666)
- Mathis (1990) Mathis, J. S. 1990, ARA&A, 28, 37
- Nishiyama et al. (2006) Nishiyama, S., et al. 2006, ApJ, 638, 839
- Osten (2008) Osten, R. A. 2008, in Bursts, Pulses and Flickering: Wide-field Monitoring of the Dynamic Radio Sky, Vol. 801, arXiv:0801.2573
- Osten & Bastian (2008) Osten, R. A. & Bastian, T. S. 2008, ApJ, 674, 1078
- Readhead (1994) Readhead, A. C. S. 1994, ApJ, 426, 51
- Reid et al. (2001) Reid, I. N., Burgasser, A. J., Cruz, K. L., Kirkpatrick, J. D., & Gizis, J. E. 2001, AJ, 121, 1710
- Reid et al. (1999) Reid, I. N., et al. 1999, ApJ, 521, 613
- Skrutskie et al. (2006) Skrutskie, M. F., et al. 2006, AJ, 131, 1163
- Slee et al. (2008) Slee, O. B., Wilson, W., & Ramsay, G. 2008, PASA, in press (arXiv:0802.0819)
- Stetson (1987) Stetson, P. B. 1987, PASP, 99, 191
- Stetson (2000) —. 2000, PASP, 112, 925
- Turolla et al. (2005) Turolla, R., Possenti, A., & Treves, A. 2005, ApJ, 628, L49
- van den Oord & de Bruyn (1994) van den Oord, G. H. J. & de Bruyn, A. G. 1994, A&A, 286, 181
- Vrba et al. (2004) Vrba, F. J., et al. 2004, AJ, 127, 2948
- Wachter et al. (2003) Wachter, S., Hoard, D. W., Hansen, K. H., Wilcox, R. E., Taylor, H. M., & Finkelstein, S. L. 2003, ApJ, 586, 1356
- White et al. (2005) White, R. L., Becker, R. H., & Helfand, D. J. 2005, AJ, 130, 586
- Zhang & Gil (2005) Zhang, B. & Gil, J. 2005, ApJ, 631, L143
- Zhu & Xu (2006) Zhu, W. W. & Xu, R. X. 2006, MNRAS, 365, L16
- Zoonematkermani et al. (1990) Zoonematkermani, S., Helfand, D. J., Becker, R. H., White, R. L., & Perley, R. A. 1990, ApJS, 74, 181