]http://www.kutl.kyushu-u.ac.jp/ wakasa
Cross-sections and analyzing powers for reactions on and at 346 MeV
Abstract
The cross-sections and analyzing powers for reactions on and have been measured at a bombarding energy of = 346 MeV and reaction angles of = –. The energy transfer spectra for at large ( ) are dominated by quasielastic contributions, and can be reasonably reproduced by plane-wave impulse approximation (PWIA) calculations for quasielastic scattering. By contrast, the known = 1 resonances in are clearly observed near the threshold in the spectra. Because these contributions are remarkable at small angles, the energy spectra are significantly different from those expected for quasielastic scattering. The data are compared with the PWIA calculations, and it is found that the quasielastic contributions are dominant at large ( ). The nuclear correlation effects on the quasielastic peak for are also discussed.
pacs:
25.40.Kv, 24.70.+s, 25.10.+s, 27.10.+hI INTRODUCTION
In this article, we present the cross-sections and analyzing powers for reactions on and at a proton incident energy of = 346 MeV and laboratory reaction angles of = –. The quasielastic scattering data obtained at = 346 MeV is of particular interest since the experimental data including the present results can cover a wide range of nuclei from to at the same incident energy Wakasa et al. (1999); Wakasa et al. (2004a, b). It should be noted that the distortion in the nuclear mean field is minimal for a nucleon kinetic energy of about 300 MeV. Thus, the experimental data will provide important information to test theoretical calculations for the quasielastic process.
One of the unique features of the quasielastic reaction is that the observed peak of the quasielastic distribution is shifted at higher excitation energy of about 20 MeV than expected from free nucleon-nucleon (NN ) kinematics Prout et al. (1995). Discrepancies between experimental data and theoretical predictions based on the free NN interaction may arise, for example, from nuclear many-body effects Kawahigashi et al. (2001) or multi-step effects Nakaoka (2002). For the reaction, the peak position is consistent with the corresponding free NN value, and the quasielastic distribution is reasonably reproduced by plane-wave impulse approximation (PWIA) calculations Wakasa et al. (2004a). The multi-step effects for 4 nuclei are expected to be much smaller than those for medium and heavy nuclei. Thus the data for 4 systems give clear information on the nuclear many-body effects including nuclear correlations. Hence it is very interesting to investigate whether the data can be reproduced with first-order model calculations.
In contrast to the reaction, the spectra of the reaction exhibit prominent resonances with angular momentum transfer = 1 near the threshold Tilley et al. (1992). In the measurements at = 100 and 200 MeV Edwards et al. (1996); Palarczyk et al. (1998); Riedel et al. (2004), there is no distinct quasielastic peak in the measured spectra because the resonance contributions are dominant. These data have been compared with calculations obtained using the quasielastic scattering code threedee Palarczyk et al. (1998) and with recoil-corrected continuum shell-model (RCCSM) calculations Edwards et al. (1996); Riedel et al. (2004). Both calculations reproduce the = 1 resonance contributions qualitatively, however, quantitative reproduction could not be achieved for the resonance or quasielastic contributions.
The present data are compared with the calculations for quasielastic scattering Kawahigashi et al. (2001), which have been used extensively to analyze quasielastic scattering data measured at LAMPF McClelland et al. (1992); Chen et al. (1993); Taddeucci et al. (1994) and RCNP Wakasa et al. (1999); Wakasa et al. (2004b). The data at large angles are reasonably reproduced by the PWIA calculations, which certify the predominance of the quasielastic process around the peak region and the weakness of the nuclear correlations. The calculations slightly underestimate the cross-sections at small angles, which might be due to the proposed isospin = three-nucleon resonance Williams et al. (1969); Wakasa et al. (2008). For , the underestimation is significant at small angles because the = 1 resonances in could not be described in the present quasielastic formalism. At large angles, where the quasielastic process is dominant, a significant difference is observed between the experimental and theoretical results for the peak positions. The large -value and nuclear correlation effects are investigated since these effects are expected to be important in Pandharipande et al. (1994). It is found that the discrepancy could be resolved in part by the nuclear correlations.
II EXPERIMENTAL METHODS
The experiment was carried out using the West–South Beam Line (WS-BL) Wakasa et al. (2002) at the Research Center for Nuclear Physics (RCNP), Osaka University. The beam line configuration and the doubly achromatic beam properties have been reported previously Wakasa et al. (2002). In the following, therefore, we discuss experimental details relevant to the present experiment.
II.1 Polarized proton beam
The polarized proton beam was produced by the high-intensity polarized ion source (HIPIS) at RCNP Hatanaka et al. (1997). In order to minimize geometrical false asymmetries, the nuclear polarization state was cycled every 5 s between the normal and reverse states (e.g., between the “up” and “down” states at the target position) by selecting rf transitions. The beam was accelerated to = 346 MeV by using the AVF and ring cyclotrons. One out of seven beam pulses was selected before injecting into the Ring cyclotron. This pulse selection yielded a beam pulse period of 431 ns, and reduced the wraparound of slow neutrons from preceding beam pulses. A single-turn extraction was maintained during the measurement in order to keep the beam pulse period. Multi-turn extracted protons were less than 1% of single-turn extracted protons.
The beam polarization was continuously monitored with the beam-line polarimeter BLP1 Wakasa et al. (2002). The polarimeter consisted of four pairs of conjugate-angle plastic scintillators. The elastic scattering was used as the analyzing reaction, and the elastically scattered and recoiled protons were detected in kinematical coincidence with a pair of scintillators. A self-supporting target with a thickness of 1.1 was used as the hydrogen target. The typical magnitude of the beam polarization was about 0.52.
II.2 and targets
The and targets were prepared as high-pressure cooled gas targets Wakasa et al. (2008) by using a target system developed for a liquid target Yagita et al. (2003). This target was operated at temperatures down to 29 K and at absolute pressures up to 2.5 atm. Both the cell temperature and pressure were continuously monitored during the experiment, and the typical target densities were about and for and , respectively. The gas cell windows were made of 12--thick Alamid foil. Background spectra were also measured by filling the target cell with gas in order to subtract the contributions from both the Alamid windows and the beam ducts. We also measured data with gas in the target cell to determine the detection efficiency of the neutron detector system. These data were also used to estimate the systematic uncertainty as described below because the cross-sections are reliably predicted by the theoretical calculations.
II.3 Dipole magnet and neutron detector
A dipole magnet made of permanent NEOMAX magnets neo was installed 10 cm downstream from the target. This magnet had a magnetic rigidity of = 0.95 Tm, which was sufficient to sweep charged particles from the target in order to prevent them from entering the neutron detector system.
Neutrons were measured with a 20 m flight path length at = –. As illustrated in Fig. 1, the neutron detector system consisted of 20 sets of one-dimensional position-sensitive plastic scintillators (BC408) with a size of 100 10 5 , which was part of the NPOL3 system Wakasa et al. (2005a). The detector system consisted of four planes of neutron detectors, each with an effective solid angle of = 1.25 msr.
III DATA REDUCTION
III.1 Background subtraction
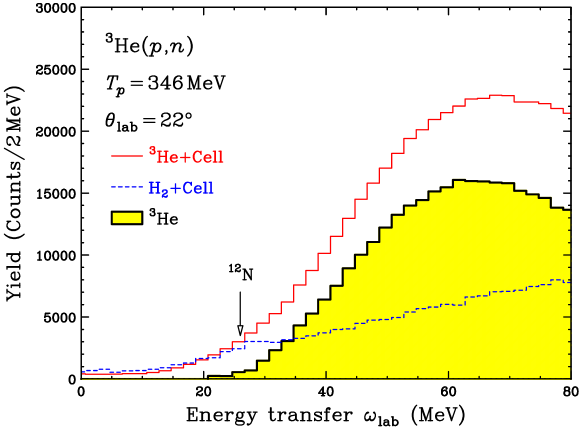
The neutrons from the target windows are the dominant source of the background at lower energy transfers of 50 MeV. This contribution can be subtracted by measuring the empty-target spectra. However, the background from the beam ducts downstream from the target becomes significant at higher energy transfers. The proton beam was spread out by the multiple scattering in the target material, and part of it hit the beam ducts. This contribution depends on the target density, and thus we could not subtract it with the empty-target spectra. Thus, we also measured the data with gas in the target cell because the multiple scattering effects for He and are expected to be similar. Figure 2 shows a representative set of spectra as a function of energy transfer. In the +Cell spectrum, a shoulder component is observed at 26 MeV. This bump is mainly due to the spin-dipole resonances (SDRs) in excited by the reaction on in Alamid. The yield at 30 MeV consists of the quasielastic reaction events for the Alamid windows and the background neutrons from the beam ducts.
The filled histogram in Fig. 2 shows the subtraction results. The background contributions including the SDR bump in are successfully subtracted without adjusting the relative normalization. We have also measured the data for the reaction in order to investigate the reliability of the background subtraction. The results are discussed in the next section.
III.2 Background subtracted observables
Observables for the reaction ( represents , , or ) were extracted through a cross-section-weighted subtraction of the observables for the target () from the observables for the target () as
| (1a) | |||||
| (1b) | |||||
where represents the cross-section, is the analyzing power , and . The fraction was estimated by using the cross-sections based on the nominal target thicknesses and integrated beam current.
III.3 Neutron detection efficiency and energy resolution
The neutron detection efficiency was determined using the reaction at = whose cross-section at = 345 MeV is known Wakasa et al. (2004a). The result is 0.0350.002, where the uncertainty comes mainly from the uncertainty in the thickness of the target.
The overall energy resolution was determined by measuring the elastic scattering for the target. The result is = 7.7 MeV in full width at half maximum.
IV RESULTS AND DISCUSSIONS
IV.1 data
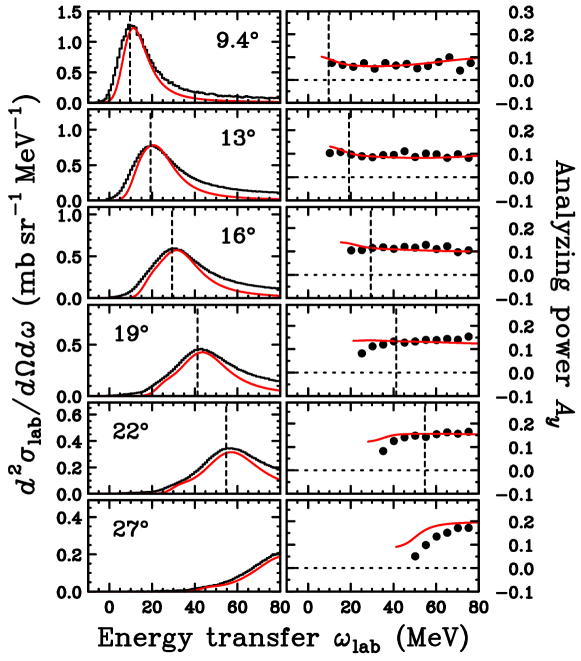
The cross-sections and analyzing powers for the reaction at = 346 MeV and = – are presented in Fig. 3. The cross-sections are binned in 1 MeV intervals, while the analyzing powers are binned in 5 MeV intervals. The tail components of the quasielastic distributions at the lower energy transfer side are mainly due to the final state interaction (FSI) of the residual two-proton system. The peak positions of the quasielastic distributions coincide with the energy transfers of the corresponding free NN scattering indicated by the dotted vertical lines, which is consistent with the results at other incident energies Wakasa et al. (2004a); Chen et al. (1993); Prout et al. (2002).
The data have been compared with the theoretical predictions obtained through PWIA using the computer code dpn Itabashi et al. (1994). These calculations have reproduced the previous data at = 345 MeV and = , , and , not only for the cross-sections but also for the polarization observables Wakasa et al. (2004a). The previous data were measured at the neutron time-of-flight facility Sakai et al. (1996) at RCNP under a significantly low-background condition. Thus a comparison between the present data and these theoretical calculations allows us to investigate the reliability of the present background subtraction. In the calculations, the wave functions of the initial deuteron and the final -scattering state are generated by the Reid soft core potential. Both and states are included in the deuteron, and the FSI process is also included in the scattering. The NN t-matrix parameterized by Bugg and Wilkin Bugg and Wilkin (1985, 1987) is used in the impulse approximation.
The solid curves in Fig. 3 represent the corresponding calculations smeared by a resolution function with = 7.7 MeV. The calculations reproduce both the cross-sections and analyzing powers around the quasielastic peak reasonably well, but underpredict the data beyond the quasielastic peak. Because these calculations have reasonably reproduced the previous data within about 10% in the present energy transfer region Wakasa et al. (2004a), the systematic uncertainty of the present data around the quasielastic peak ( +20 MeV) is estimated to be about 10%, whereas that beyond the quasielastic peak would be much larger. Thus, in the following discussions, we focus on the comparison between experimental and theoretical results around the quasielastic peak.
IV.2 data
Figure 4 shows the cross-sections and analyzing powers for the reaction at = 346 MeV and = –. The analyzing power data for are also shown by the open squares. The vertical dashed lines represent the energy transfers for the free NN scattering. The analyzing powers for are in reasonable agreement with those for . Thus, the quasielastic process is expected to be dominant for as well. However, the peak position of the cross-sections is significantly higher than the energy transfer for the corresponding free NN scattering. The -value and Pauli principle effects are expected to be more significant than those for . Therefore, in the following, we perform PWIA calculations in order to investigate these effects quantitatively.
IV.3 PWIA calculations for
We performed the PWIA calculations by using the computer code crdw Kawahigashi et al. (2001). The formalism for the response function is that of Nishida and Ichimura Nishida and Ichimura (1995), and the free response function is employed in the present calculations. The single-particle wave functions were generated by a Woods-Saxon (WS) potential. The radial and diffuseness parameters were determined to be = 0.92 fm and = 0.38 fm, respectively, to reproduce the density distribution of de Jager et al. (1974). The depth of the WS potential was adjusted to reproduce the separation energy of the orbit. The optimal factorization prescription Picklesimer et al. (1984); Gurvitz (1986); Zhu et al. (1987); Ichimura and Kawahigashi (1992) is employed to model the Fermi motion of the target nucleons. The NN t-matrix parameterized by Bugg and Wilkin Bugg and Wilkin (1985, 1987) was used.
The solid curves in Fig. 4 represent the corresponding calculations. We focus on the energy transfer region of +20 MeV on the basis of the discussion in Sec. IV.1. The calculations reproduce the shapes of the cross-sections reasonably well, and they also reproduce the analyzing powers fairly well around the peak. The agreement between the experimental and theoretical results for the peak positions validates the treatment of the -value and Pauli principle effects in the calculations. However, the cross-sections at small angles are significantly underestimated around the peak. This discrepancy between the experimental and theoretical results might be due to the three-nucleon resonance with isospin = Williams et al. (1969); Wakasa et al. (2008). At large ( ), where the resonance contribution is expected to be small, the calculations yield good descriptions of the cross-sections around the peak. Thus, we have confirmed that the quasielastic process is dominant around the peak region and it is described in the present theoretical framework without the nuclear correlations. Therefore, in the following, we use the same framework for in order to investigate the nuclear correlation effects in the present data.
IV.4 data
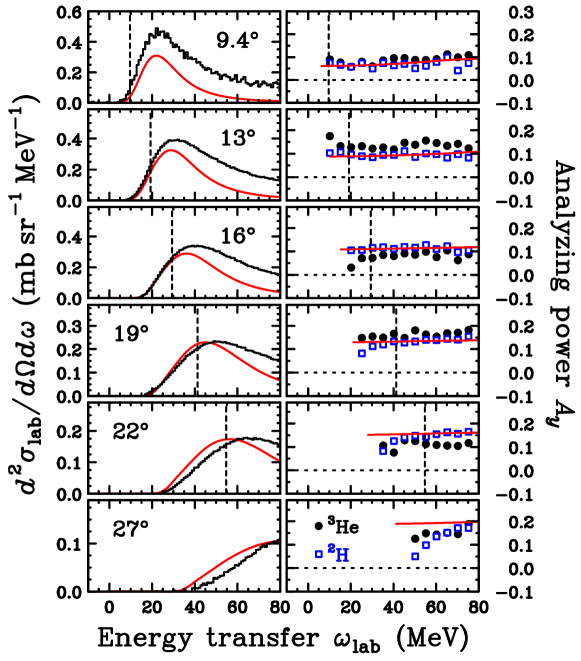
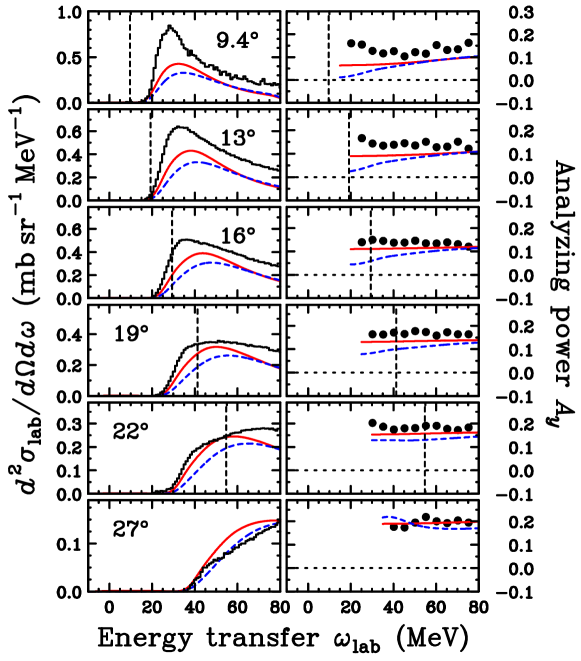
The cross-sections and analyzing powers for the reaction at = 346 MeV and = – are displayed in Fig. 5 as a function of energy transfer. The data for the cross-sections and analyzing powers are binned in 1 and 5 MeV intervals, respectively. In contrast to the spectra, there is a steep rise near the threshold at all reaction angles. For small ( ), the transitions to the ground state with = and the first excited state with = of form a bump near the threshold. This bump is prominent compared with the data at = 100 MeV Riedel et al. (2004) because these spin-flip transitions are predominantly excited at projectile energies around 300 MeV. The vertical dashed lines represent the energy transfers for the free NN scattering. For large ( ), where the resonance contributions are expected to be small, the peak position of the cross-sections is significantly higher than the corresponding because of both the large -value and nuclear correlation effects. In the following, we compare our data with the theoretical calculations by employing these effects consistently.
IV.5 PWIA calculations for
The formalism of the calculations is the same as that used for . The nuclear mean field is described by the WS potential, and its radial and diffuseness parameters were determined to be = 0.83 fm and = 0.33 fm, respectively, to reproduce the density distribution of de Jager et al. (1974). The results are shown as solid curves in Fig. 5. The calculations significantly underestimate the cross-sections around the peak at small angles. This discrepancy is mainly due to the = 1 resonance contributions near the threshold, which are not described by the simple particle-hole excitation employed in the present calculations. For the analyzing powers, the calculations systematically yield smaller values than the experimental data, especially at small angles. This underestimation might also be due to the resonance contributions in the experimental data.
It should be noted that the observed peak positions of the cross-sections are significantly higher than the theoretical predictions at large values of ( = and ). Because the resonance contributions shift the cross-sections to lower energy transfer values, the discrepancy between the experimental and theoretical results might be indicative of nuclear correlation effects, which are expected to be large for Pandharipande et al. (1994). Thus we performed the PWIA calculations with the random phase approximation (RPA) response functions, employing the model interaction Nishida and Ichimura (1995). For the pion and rho-meson exchange interactions, we have used the coupling constants and meson parameters from the Bonn potential, which treats explicitly Machleidt et al. (1987). The Landau-Migdal parameters were estimated to be = 0.65 and = 0.35 Wakasa et al. (2005b); Ichimura et al. (2006) by using the peak position of the Gamow-Teller (GT) giant resonance and the GT quenching factor at = 0 Wakasa et al. (1997); Yako et al. (2005), as well as the isovector spin-longitudinal polarized cross-section in the QES process at 1.7 Wakasa et al. (2004b). Here, we fixed = 0.5 Dickhoff et al. (1981) since the dependence of the results is very weak. The dashed curves in Fig. 5 show the results obtained by employing the RPA response function. The nuclear correlation effects are expected to be significant in both the cross-sections and analyzing powers. We have also performed the PWIA calculations with the RPA response function for , however, the nuclear correlation effects were very small. The cross-sections are shifted to higher energy transfer values by considering the nuclear correlation effects, which is due to the hardening effects in the spin-transverse mode. The discrepancy of the peak positions at = and is resolved in part by considering the nuclear correlation effects. However, it is difficult to conclude whether the nuclear correlations are observed in the present data because the resonance contributions, which are important for quantitative description especially at small angles, are not included in the present calculations. Thus detailed theoretical investigations including both the resonance and nuclear correlation effects are required.
V SUMMARY AND CONCLUSION
We have measured the cross-sections and analyzing powers for reactions on and at = 346 MeV and = –. Both data are compared with the PWIA calculations for quasielastic scattering. The calculations can reproduce the data at large values ( ) reasonably well. At small values ( ), the observed cross-sections are slightly larger than the calculations, which might suggest the contribution from the = three-nucleon resonance. In contrast to the reaction, = 1 resonance contributions are clearly observed near the threshold for the reaction. At large values ( ), where the resonance contributions are small, the PWIA calculations yield reasonable descriptions for the cross-sections, whereas the peak positions are significantly lower than the experimental values. The observed peak shift can be explained in part by considering the nuclear correlations. However, the present data are not conclusive evidence for the nuclear correlation effects, and call for theoretical calculations that incorporate the proper description for the = 1 resonances in order to settle the interpretation of the present data.
Acknowledgements.
We are grateful to Professor M. Ichimura for his helpful correspondence. We also acknowledge the dedicated efforts of the RCNP cyclotron crew for providing a high quality polarized proton beam. The experiment was performed at RCNP under Program Number E300. This research was supported in part by the Ministry of Education, Culture, Sports, Science, and Technology of Japan.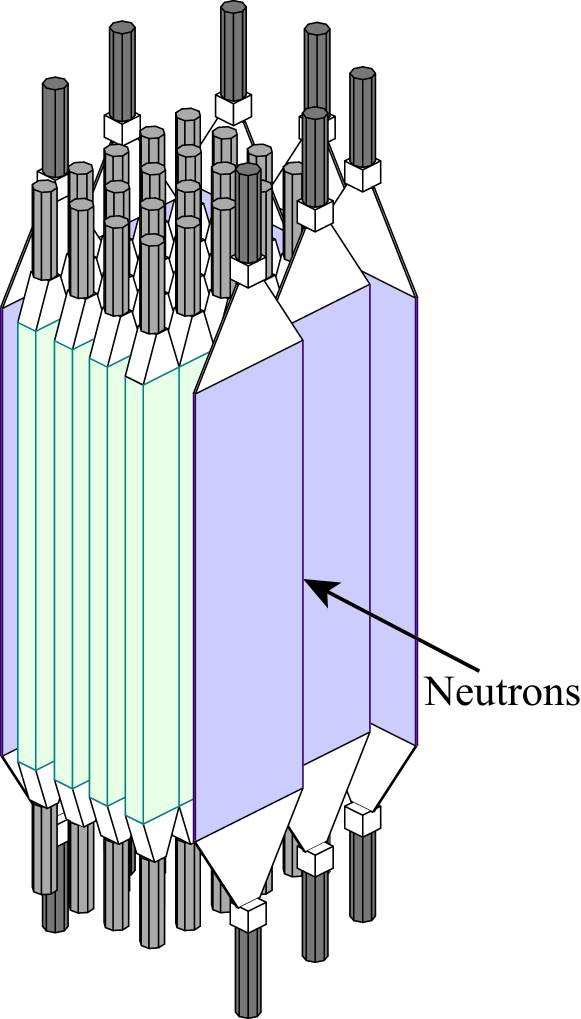
References
- Wakasa et al. (1999) T. Wakasa et al., Phys. Rev. C 59, 3177 (1999).
- Wakasa et al. (2004a) T. Wakasa et al., Phys. Rev. C 69, 044602 (2004a).
- Wakasa et al. (2004b) T. Wakasa et al., Phys. Rev. C 69, 054609 (2004b).
- Prout et al. (1995) D. L. Prout et al., Phys. Rev. C 52, 228 (1995).
- Kawahigashi et al. (2001) K. Kawahigashi, K. Nishida, A. Itabashi, and M. Ichimura, Phys. Rev. C 63, 044609 (2001).
- Nakaoka (2002) Y. Nakaoka, Phys. Rev. C 65, 064616 (2002).
- Tilley et al. (1992) D. R. Tilley, H. R. Weller, and G. M. Hale, Nucl. Phys. A 541, 1 (1992).
- Edwards et al. (1996) C. M. Edwards et al., Phys. Lett. B 368, 39 (1996).
- Palarczyk et al. (1998) M. Palarczyk et al., Phys. Rev. C 58, 645 (1998).
- Riedel et al. (2004) C. M. Riedel et al., Phys. Rev. C 69, 024616 (2004).
- McClelland et al. (1992) J. B. McClelland et al., Phys. Rev. Lett. 69, 582 (1992).
- Chen et al. (1993) X. Y. Chen et al., Phys. Rev. C 47, 2159 (1993).
- Taddeucci et al. (1994) T. N. Taddeucci et al., Phys. Rev. Lett. 73, 3516 (1994).
- Williams et al. (1969) L. E. Williams, C. J. Batty, B. E. Bonner, C. Tschalär, H. C. Benöhr, and A. S. Clouth, Phys. Rev. Lett. 23, 1181 (1969).
- Wakasa et al. (2008) T. Wakasa et al., Phys. Rev. C 77, 054611 (2008).
- Pandharipande et al. (1994) V. R. Pandharipande, J. Carlson, S. C. Pieper, R. B. Wiringa, and R. Schiavilla, Phys. Rev. C 49, 789 (1994).
- Wakasa et al. (2002) T. Wakasa et al., Nucl. Instrum. Methods Phys. Res. A 482, 79 (2002).
- Hatanaka et al. (1997) K. Hatanaka, K. Takahisa, H. Tamura, M. Sato, and I. Miura, Nucl. Instrum. Methods Phys. Res. A 384, 575 (1997).
- Yagita et al. (2003) T. Yagita et al., Mod. Phys. Lett. A 18, 322 (2003).
- (20) http://www.hitachi-m-admet.com/.
- Wakasa et al. (2005a) T. Wakasa et al., Nucl. Instrum. Methods Phys. Res. A 547, 569 (2005a).
- Prout et al. (2002) D. L. Prout et al., Phys. Rev. C 65, 034611 (2002).
- Itabashi et al. (1994) A. Itabashi, K. Aizawa, and M. Ichimura, Prog. Theor. Phys. 91, 69 (1994).
- Sakai et al. (1996) H. Sakai, H. Okamura, H. Otsu, T. Wakasa, S. Ishida, N. Sakamoto, T. Uesaka, Y. Satou, S. Fujita, and K. Hatanaka, Nucl. Instrum. Methods Phys. Res. A 369, 120 (1996).
- Bugg and Wilkin (1985) D. V. Bugg and C. Wilkin, Phys. Lett. B 152, 37 (1985).
- Bugg and Wilkin (1987) D. V. Bugg and C. Wilkin, Nucl. Phys. A 467, 575 (1987).
- Nishida and Ichimura (1995) K. Nishida and M. Ichimura, Phys. Rev. C 51, 269 (1995).
- de Jager et al. (1974) C. W. de Jager, H. de Vries, and C. de Vries, At. Data Nucl. Data Tables 14, 479 (1974).
- Picklesimer et al. (1984) A. Picklesimer, P. C. Tandy, R. M. Thaler, and D. H. Wolfe, Phys. Rev. C 30, 1861 (1984).
- Gurvitz (1986) S. A. Gurvitz, Phys. Rev. C 33, 422 (1986).
- Zhu et al. (1987) X. Q. Zhu, N. Mobed, and S. S. M. Wong, Nucl. Phys. A 466, 623 (1987).
- Ichimura and Kawahigashi (1992) M. Ichimura and K. Kawahigashi, Phys. Rev. C 45, 1822 (1992).
- Machleidt et al. (1987) R. Machleidt, K. Holinde, and C. Elster, Phys. Rep. 149, 1 (1987).
- Wakasa et al. (2005b) T. Wakasa, M. Ichimura, and H. Sakai, Phys. Rev. C 72, 067303 (2005b).
- Ichimura et al. (2006) M. Ichimura, H. Sakai, and T. Wakasa, Prog. Part. Nucl. Phys. 56, 446 (2006).
- Wakasa et al. (1997) T. Wakasa et al., Phys. Rev. C 55, 2909 (1997).
- Yako et al. (2005) K. Yako et al., Phys. Lett. B 615, 193 (2005).
- Dickhoff et al. (1981) W. H. Dickhoff et al., Phys. Rev. C 23, 1154 (1981).