11email: rodolfo.angeloni@unipd.it, piero.rafanelli@unipd.it 22institutetext: School of Physics and Astronomy, Tel-Aviv University, Tel-Aviv 69978, Israel
22email: contini@post.tau.ac.il
The symbiotic star CH Cygni
Abstract
Context. We analyse the line and continuum spectra of the symbiotic system CH Cygni.
Aims. To show that the colliding-wind model is valid to explain this symbiotic star at different phases.
Methods. Peculiar observed features such as flickering, radio variation, X-ray emission, as well as the distribution of the nebulae and shells throughout the system are investigated by modelling the spectra at different epochs. The models account consistently for shock and photoionization and are constrained by absolute fluxes.
Results. We find that the reverse shock between the stars leads to the broad lines observed during the active phases, as well as to radio and hard X-ray emission, while the expanding shock is invoked to explain the data during the transition phases.
Key Words.:
binaries: symbiotic - stars: individual: CH Cyg1 Introduction
The symbiotic star (SS) CH Cygni (CH Cyg) has been observed since the late ’80s of the XIX century. It was identified as an anonymous red semiregular variable by Gaposchkin’s 1952 analysis of Harvard patrol plates, and classified as a M6-M7 spectrum star with a 90-100 day period and about one-magnitude amplitude. This classification seemed to be suitable until 1963 when a hot blue continuum appeared, along with a late-type spectrum and emission lines of H, He, [FeII] and [CaII], evidence of a composite nature. This drove Deutsch (1964) to recognize in CH Cyg the brightest SS at visual wavelengths. Since then, active and quiescent phases have been alternating without a predictable trend.
At a distance of 27066 pc (according to the Hipparcos parallax measurements - Munari et al. 1997) CH Cyg is one of the most studied, yet poorly understood SSs. It has been observed in the last thirty years both photometrically and spectroscopically from radio to X-ray wavelengths (Kenyon 2001).
The basic configuration of the CH Cyg system is still debated, despite the large amount of multifrequency observations carried out since the first recorded symbiotic activity. In particular, it is discussed whether it is a binary or a triple star, and, in the latter case, whether composed of a red giant/white dwarf pair with a G star companion (Hinkle et al. 1993) or a red giant/white dwarf pair with an additional red giant companion (Skopal et al. 1996). The explanation of the total hot component luminosity in a binary star scenario might be a crucial problem: specifically, the suggested binary orbital parameters (e.g. Mikolajewski et al. 1992) would imply an accretion rate onto the white dwarf not in agreement with that requested by the observed hot component luminosity. On the other hand, adopting the binary star scenario the orbital solution of the triple model (Hinkle et al. 1993) would require a low inclination angle. This is in contrast with the jet appearing in the plane of the sky, implying an accretion disk and/or an orbital plane virtually edge-on. Furthermore, the low inclination implied by Hinkle et al. (1993) would result in an unrealistically low mass (0.2 M⊙ ) white dwarf. Finally, the similarity of the 756 day period of CH Cyg with non-radial pulsations in a few semi-regular variables drove Schmidt et al. (2006) to interpret this periodic trend more as a non-radial pulsation of the cool component rather than a real orbital period.
Several theoretical papers have appeared presenting SSs as colliding-wind (CW) binary systems (e.g. Kenny & Taylor 2005). The observational evidence that actually both the component stars of a SS lose mass through strong stellar winds (Nussbaumer et al. 1995), along with the presence in CH Cyg of radio, optical and X-ray jets (Karovska et al. 2007), have confirmed the importance of shocks for a real understanding of such outstanding system.
CH Cyg is characterized by the presence of an eruptive white dwarf, showing episodes of accretion fed by the high-density wind coming from the M star, and of wind-wind interaction leading to shock waves. The nebulae downstream of the shock fronts show the spectroscopic marks of a turbulent kinematics, resulting in an inhomogeneous and highly disrupted envelope.
In this paper we review the recent history of CH Cyg, in the light of a colliding wind scenario (e.g. Girard & Willson 1987, Kenny & Taylor 2005) that has been used to explain many SSs (e.g. Formiggini, Contini, & Leibowitz 1995, Contini 1997, Contini & Formiggini 1999) and recently updated including a detailed analysis of dust features (Angeloni et al. 2007a,b,c).
We interpret the observational data throughout both the active and quiescent phases, from the 1978 great outburst up to date, with the aim of investigating the physical and morphological conditions of the system by modelling the line and continuum spectra emitted from the different nebulae.
We adopt the binary scenario, considering the 756 day period as due to the giant pulsation mode, and the 15 year period as the actual orbital period.
Following the method used in previous SS investigations, we analyse the continuum spectral energy distribution (SED) in different epochs, instead of the light curve through the years. At each epoch we model the data collected from radio to X-ray constraining the results by the analysis of the line spectra. The continuum accounts for bremsstrahlung and dust reprocessed radiation from the shocked nebulae, radiation from dust shells, as well as radiation from the stars. Our method is particularly suitable for disentangling the multiple contributions of gas and dust in different conditions at different phases.
We focus on the within the shocked wind-wind interaction regions and on the ejected by the giant star, constraining the models by the observed fluxes.
A short summary of observational history of CH Cyg is presented in Sect. 2. The colliding wind model and our application to CH Cyg are presented in Sect. 3. The next sections are devoted to the analysis of the individual active and quiescent phases. As CH Cyg has not been observed regularly in the different wavelength ranges, except of the optical one, the SED profiles in some epochs present some data gaps: for instance, there are no UV and X-ray observations for the 1988-1990 quiescent phase, nor mid-IR data for the 1998-2000 active phase. This led us to focus on specific physical processes in each phase: the basic models which result by disentangling the different contributions to the SEDs and to the line ratios at different days during the active phase 1978-87 are presented in Sect. 4; in Sect.5, different types of IR obscurations occurred during the 1988-90 quiescent phase are indicated; near-UV and IR variability during the 1991-95 active phase are discussed in Sect. 6, while Sect. 7 (1996-97 quiescent phase) deals with the complex nature of the radio emission. The very expanded nebulae and the X-ray emission are modelled throughout the 1998-2000 latest active phase (Sect.8) up to date (Sect.9). Concluding remarks and a summary of the results are presented in Sect. 10.
2 Observational progress
The symbiotic classification was introduced on the basis of optical spectral features, however, a real understanding of SSs, and CH Cyg in particular, has been possible only by space-based astronomy.
A key-role was played by the long-lived IUE, which opened the UV window allowing to monitor the temporal evolution of many emission lines arising from the nebulae and the continuum coming from the hot star (see Sect. 4 for a detailed modelling of such temporal evolution). This great effort revealed that CH Cyg is much more complex than thought before. Its puzzling nature triggered a series of new radio observations (e.g. Taylor et al. 1985, 1986) attempting to understand the actual origin of the nebular emission and to constrain a self-consistent view in the light of the most accepted scenario at the time. It was concluded that the symbiotic behaviour was due to the dense cool wind photoionized by the hot star radiation (e.g. Taylor et al. 1988).
The optical and near IR spectrophotometry throughout the years (e.g. Taranova & Yudin 1988, 1992; Munari et al. 1996; Skopal et al. 1996, 1997, 2000, 2002, 2004, 2007) have allowed to follow small changes in the emitting properties of CH Cyg, without leading to a substantial breakthrough.
Unexpected results came from the first X-ray observations (e.g. Leahy & Taylor 1987) that for the first time made clear that the energetic of the whole system was hard to explain in term of standard photoionization models. It became evident that shocks, and in general hydrodynamic phenomena (e.g. fluid instabilities), play a primary role in shaping the energy distribution along the whole spectral interval. Further observational evidence of stellar wind collision in CH Cyg derived from the most recent X-rays observations (Ezuka et al. 1997, Galloway & Sokoloski 2004, etc).
The IR spectral range is not yet fully explored. It was suggested that ”symbiotic dust” carries as much information as symbiotic emission lines (Angeloni et al. 2007c), and the unique CH Cyg mid-IR spectra recorded by the ISO satellite (Schild et al. 1999) complicated furthermore the system overall picture. Multiple dust shells, mixed grain chemistry, equilibrium between grain formation and destruction processes in the turbulent nebulae (Angeloni et al. 2007a) are worth investigating with the new era of mm-IR facilities, such as ALMA and Herschel.
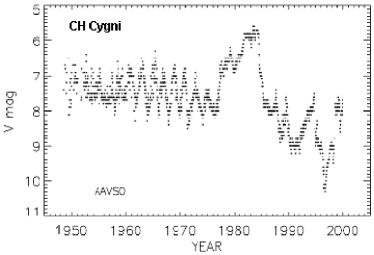
Fig. 1 shows the light curve of CH Cyg throughout many years. The first ever recorded symbiotic activity of CH Cyg started in September 1963 and was over by August 1965, followed by an other period of increased activity in the years 1967-1970. Then, CH Cyg experienced a dramatic eruption in 1978 when it became as bright as to be visible by unaided eye (visual mag. 5.6). This great outburst ended in 1986 with the emission of bipolar radio and optical jets (Solf 1987) and by a decline of about 2.5 visual magnitudes (Taylor et al. 1986). After 1986, the decline in magnitude continued, even though not regular nor smooth. Meanwhile, shorter and dimmer outbursts (1991 - 1995, 1998 - 2000) have been accompanying the fading trend (Fig. 1). Between these periods of activity the spectrum has exhibited almost exclusively red giant characteristics, and U B V light curves with significant variations at a level of about 1.5 mag.
Since the beginning of the 2000, CH Cyg persists in a quiescent phase at rather bright magnitude, despite a 2 mag decline in the U B V light curves during the 2006 June-December period (Skopal et al. 2007). An apparently anomalous extreme IR fading has been recently pointed out by Taranova & Shenavrin (2007).
In the Appendix, we present the references to the observational data we collected from the literature. In the quoted works the reader can find the journal of observations, so in the Tables we have indicated only the spectral domain and the year, addressing to the specific reference for any further information or technical detail.
3 Theoretical framework
3.1 CW models for SSs: a short review
The first models for the calculation of radio emission from SSs adopted a single star picture with a totally ionized wind (e.g. Seaquist & Gregory 1973) Then, Willson et al. (1984) reproduced the line profiles in terms of the interaction of a low velocity wind from the red giant with a high velocity wind from a WD in a detached binary system where both stars have spontaneous winds. The line forming regions are located in different portions of the interaction shell and in the two winds.
A binary system composed of a cool, mass-losing star and a hot companion was also adopted by Taylor & Seaquist (1984), reproducing the radio spectrum by a simple steady-state model in which a portion of the stellar wind is photoionized by the hot companion.
Girard & Willson (1987) presented the colliding wind model which is at the basis of further developments. Namely, the winds from a late giant and from a hot WD collide between the stars and material is accumulated along the boundary, forming an initially spherical shell that is deformed by the wind of the primary (giant star): eventually, the shell reaches a steady state configuration. A large amount of turbulence perpendicular to the mean flow is expected.
Both in the steady state formulation and in the dynamic shell model the shell is sufficiently thin to be considered having zero thickness.
The colliding wind model of Kenny & Taylor (2005) differs from previous ones because assumes mixing of shocked material from both incoming streams instead than postulating a self-sustaining contact discontinuity. The model extends the CW model by the derivation of an adiabatic temperature, the consideration of radiative cooling, the inclusion of thermal pressures in the incoming winds, and the treatment of interaction shells of finite thickness and density. They succeed in reproducing radio images and continuum spectra.
Collision of the winds and the derived shock network have been invoked to resolve specific discrepancies between observations and theory during the active phases of a symbiotic phenomenon. Nevertheless, in order to simultaneously reproduce the UV, optical, and IR line spectra as well as the absolute fluxes of the continuum SED from radio to X-ray (Contini 1997, Contini & Formiggini 2003, Angeloni et al. 2007a,b), the shocks cannot be neglected even during the quiescent phases.
3.2 A schematic model adapted to the detailed calculation of the spectra
Recent works on a significant sample of dusty SSs have been revealing a common trend in the IR spectrum properties, such as similar, recurrent shell temperatures and unexpected grain chemistry (Angeloni et al 2007b, 2008 in preparation).
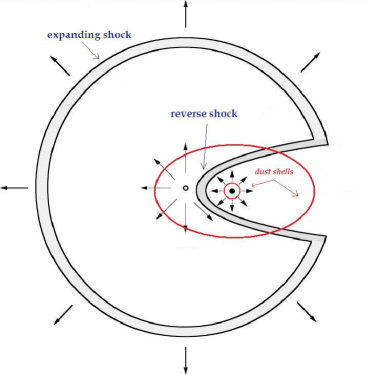
In order to take into account the importance of dust in SSs, our model adds to the colliding wind binary system the dust shells emitted by pulsation of the cool star. A very schematic picture of the system is shown in Fig. 2. In this figure the basic shock fronts appear. The dynamical effects of instabilities, such as fragmentation, will be explained in the text, as well as evaporation and sputtering of dust grains in the shells.
The shocks associated with the colliding winds are strongest along the line connecting the two stars. The interface between the two winds contains two shocks: one facing the fast wind, with 1000 but low mass flux, and one facing the slow wind, with 30 and considerably higher flux corresponding to mass loss rates of 10-6 or 10-5 M⊙ year-1. To a first approximation they can be considered standing shocks. We will refer to the strong shock facing the WD. In the expanding region around the hot star away from the direction towards the cool star, we will refer to the expanding shock outward the system.
We are interested in the calculations of the line and continuum spectra throughout the different epochs, so we refer to schematic nebulae: downstream of the strong standing shock between the star, downstream of the expanding shock, and downstream of the dust shell edges. The radiation emitted from the different nebulae and dust shells are summed up with different weights which depend on the orbital phase, the pulsation period of the red giant, and on activity of the WD.
The nebulae downstream of the shock fronts are compressed by the shock and heated by both the shock and the photoionizing flux from the WD. Downstream of the reverse shock, the radiation flux from the WD reaches the shock front edge of the nebula, characterized by very high densities and by a high ionization parameter, being the shock front close to the WD. The nebula downstream of the shock expanding outwards the system is characterized by lower densities. In this configuration, the photoionizing flux from the WD, with an ionization parameter diluted by distance, reaches the edge of the nebula opposite to the shock front. Furthermore, the photoionizing flux may be obstructed by some intervening matter before it reaches the outer nebula, hence leading to shock-dominated spectra, i.e. showing only the characteristics of the shocks.
3.3 The SUMA code
The line and continuum spectra (free-free and free-bound radiation, hereafter bremsstrahlung) emitted by the gas downstream are calculated by SUMA (see http://wise-obs.tau.ac.il/marcel/suma/index.htm for a detailed description), a code that simulates the physical conditions of an emitting gaseous cloud under the coupled effect of photoionisation from an external radiation source and shocks, and in which both line and continuum emission from gas is calculated consistently with dust reprocessed radiation in a plane-parallel geometry. In particular, dust grain heating and sputtering processes are also included, as well as free-free self-absorption in the radio range, so evident in SSs (e.g. H1-36, Angeloni et al. 2007b).
Before proceeding with the modelling of the spectra, we would like to point out that the plane-parallel condition is an approximation which is a necessary constraint in composite models (shock+photoionization). However, the plane-parallel condition is roughly valid in the interbinary region where the collision of the winds is head-on. It is valid in the circumbinary region where the radius of the expanding shock created by the head-on-back interaction of the outflowing winds from the stars is large enough. We have adopted it also for the dusty shells because they can approach large radii.
The input parameters are: the shock velocity , the preshock density ,
the preshock magnetic field , the colour temperature of the hot star ,
the ionization parameter , the geometrical thickness of the emitting nebula ,
the dust-to-gas ratio , and the abundances of He, C,N, O, Ne, Mg, Si, S, A, Fe relative to H.
Solar abundances are adopted (Allen 1973). The distribution of the grain radius downstream
is determined by sputtering, beginning with an initial radius of 0.2 m.
The calculations start at the shock front where the gas is compressed and thermalized adiabatically, reaching the maximum temperature in the immediate post-shock region. The downstream region is cut in many plane-parallel slabs (up to 300) with different geometrical widths calculated automatically in order to account for the temperature gradient. In each slab compression is calculated by the Rankine-Hugoniot equations for the conservation of mass, momentum and energy throughout the shock front. In the case where shock and photoionization act on opposite sides the geometrical width of the nebula is an input parameter, the diffuse radiation bridges the two sides. In this case, a few iterations are necessary to consistently obtain the physical conditions downstream.
The ionizing radiation from an external source is characterized by its spectrum, which is calculated at 440 energies, from a few eV to KeV. Due to the radiative transfer, the radiation spectrum changes throughout the downstream slabs, each of them contributing to the optical depth. The calculations assume a steady state downstream. In addition to the radiation from the primary source, the effect of the diffuse radiation created by the gas emission (line and continuum) is also taken into account using about 240 energies to calculate the spectrum.
For each slab of gas, the ionic fractional abundances of each chemical element are obtained by solving the ionization equations. These equations account for the ionization mechanisms (photoionization by the primary and diffuse radiation, and collisional ionization) and recombination mechanisms (radiative, dielectronic recombinations) as well as charge transfer effects. The ionization equations are coupled to the energy equation when collision processes dominate, and to the thermal balance if radiative processes dominate. This latter balances the heating of the gas due to the primary and diffuse radiations reaching the slab, and the cooling, due to recombinations and collisional excitation of the ions followed by line emission, dust collisional ionization, and thermal bremsstrahlung. The coupled equations are solved for each slab, providing the physical conditions necessary for calculating the slab optical depth, as well as its line and continuum emissions. The slab contributions are integrated throughout the nebula.
Dust grains are coupled to the gas across the shock front by the magnetic field, and are heated by radiation from the WD and collisionally by the gas to a maximum temperature which is a function of the shock velocity, of the chemical composition and radius, up to the evaporation temperature (T 1500 K). The grains throughout shock fronts and downstream might be destructed by sputtering. Grain emission and absorption processes, which depend on wavelength and on grain characteristics, may therefore explain the complex structure of the light curves at different wavelengths.
To better understand the modelling of the SED, one should recall that the frequency of the bremsstrahlung peak depends on the shock velocity, while the radiation from an external source affects the SED between 1014 and 1015 Hz. In a consistent way, the dust reradiation peak shifts to higher frequencies the higher the shock velocity, while the dust-to-gas ratio determines the ratio between the dust peak and the bremsstrahlung at a certain frequency. The reradiation of dust within the SS nebulae is, therefore, observable in the IR only for relatively high dust-to-gas ratios, being the IR range dominated by radiation from the red giant (Contini 1997, fig. 4; Contini & Formiggini 2003, fig. 5).
In the following, we adopt a more physical approach by modelling the SEDs at different epochs instead of light curves at different wavelengths and translating magnitudes vs. wavelengths in fluxes () vs. frequencies.
| m1shell | m2shell | m | m | m1 | m2 | m3exp | |
|---|---|---|---|---|---|---|---|
| () | 1.5e9 | 2.e9 | 5.e7 | 1.e7 | 1.e5 | 1.e7 | 2.e7 |
| () | 40 | 60 | 600 | 1200 | 150 | 100 | 70 |
| (gauss) | 2.e-3 | 3.e-3 | 3.e-3 | 3.e-3 | 1.e-3 | 1.e-3 | 1.e-3 |
| (K) | 1.5e5 | 1.5e5 | 1.5e5 | 1.5e5 | 3.5e4 | 3.5e4 | 3.5e4 |
| U | 0.5 | 1 | 6 | 2 | 0.01 | 0.001 | 0.001 |
| (cm) | 4.0e14 | 3.6e13 | 1.e14 | 1.e14 | 5.e15 | 3.e17 | 3.e17 |
| 4.e-4 | 4.e-4 | 4.e-4 | 4.e-4 | 4.e-7 | 4.e-7 | 4.e-7 |
a radiation dominated (U0); b upper limit in radiation-bound models; c by mass
4 1978-1986 active phase: the models
Since the emission lines better constrain the physical properties of a nebula than the continuum, we start by modelling the composite line spectra.
4.1 The line spectra
Permitted and forbidden lines were observed along the whole outburst episode. Hack et al. (1988) reported that in quiescence only H and H appeared as broad, relatively strong emissions, while the other Balmer lines were faint absorbed and severely blended with the neutral metallic lines. The FW0M of H varied from about 400 at the beginning of the outburst to 600-700 from early 1978 to the middle 1981; then it remained at 600 until mid 1984, increasing to 750 in July 1984; in November 1984 and 1985 it reached about 1200 . At the same epoch, high resolution UV spectra showed a strong and broad (4000 ) Ly emission, never present at previous epochs. The origin of the broad Ly is discussed by Contini et al. (2007).
Before 1985 the overall spectra did not show strong emission features except [SII] 4068+, [OI] 6300+ in the optical and OI 1304, 1358, SiIII] 1892, CIII] 1909, and MgII 2800 in the UV (Mikolajewska et al. 1988). Emission lines of HeI 5876 were present during the whole outburst except in the beginning. The [OIII] 4363 and 5007 lines appeared only in November 1984, when the outburst was almost over. At the same epoch the UV spectrum indicated that several high ionization emission lines (NV, CIV, SiIV, HeII, OIII]) had appeared (Selvelli & Hack 1985, Mikolajewska et al. 1988). The decrease in density at the end of the outburst was indicated by the ratio of FeII/[FeII] and CIII] 1906/1909.
The UV line ratios suggested electron densities of 108-1010 , characteristic of winds close to the stars. On the other hand, the forbidden optical lines indicated densities 106 and were therefore emitted from the nebulae downstream of the expanding shock front.
Since the structure and evolution of the nebulae are very complicated, we adopt three schematic types (Tables 1-2): 1) downstream of a shock with velocities of 600 - 1200 corresponding to the reverse shock, 2) downstream of a shock expanding outwards with velocities 150 which can be either radiation dominated, namely, the nebula is reached by the photoionizing flux from the WD, or shock dominated, i.e. the conditions in the nebula are those corresponding to a pure shock, and 3) downstream of a shock with velocities of 40-60 and a high ( 109 ) propagating outwards the red giant star, which represents its own dust shells. As a matter of fact, the shock velocities of the shells are 30 , but the velocity increases when the shock propagates throughout the circumstellar environment with a negative density gradient.
We can now explain the evolution of the spectra in the 1978-86 active phase. A complete grid of models was run and the models which appear in Table 1 were selected from those which best fit the observed line and continuum spectra.


In Fig. 3 we show the profile of the electron density, electron temperature and of the fractional abundances of the main ions, which explain the spectra.
In particular, each diagram represents the profile of the physical conditions in the gas downstream of a shock front. We have chosen three very different models. The diagrams correspond to shocked nebulae. The shock front is on the left. The diagram on the left of Fig. 3 and the middle one show the case in which radiation from the WD reaches the very shock front edge. In fact the diagram on the left represents the nebula downstream of a gas+dust shell ejected by the Mira. It is characterized by a high preshock density and a low . The shell propagates towards the WD.
The middle diagram represents the conditions downstream of the reverse shock, facing the WD. The shock velocity is roughly determined by the FW0M of the line profile, while the range of the preshock density is dictated by the line ratios.
The diagram on the right of Fig. 3 represents the nebula downstream of the shock front propagating outwards the system. The X-axis scale is logarithmic and symmetric with respect to the middle of the nebula in order to show the conditions in both edges with similar high resolution, because, in this case, the shock and the radiation flux act on opposite edges. The physical conditions on the two sides of the nebula (the collisional dominated and the radiation dominated) are bridges by the secondary diffuse radiation from the hot slabs of gas.
The middle diagram of Fig. 3 and the left side of the diagram on the right show the characteristics of a shock dominated regime, namely, the temperature of the gas decreases from immediately behind the shock-front. However, the recombination coefficients are low at high temperatures. Therefore, a long region of high temperature gas survives downstream, emitting, by the way, X-rays and coronal lines. The cooling rate is proportional to . When the temperature reaches about 105 K the bulk of the UV and optical lines are emitted leading to a strong decrease of the temperature. The abrupt cooling is followed by the calculation code by reducing the geometrical thickness of the slabs (down to even cm) by 10, where and represent the temperatures of two close slabs. After the drop, the temperature is maintained at about K by the primary and secondary radiations. Recall that photoionization alone hardly heats the gas to temperatures 2-3 K. In a pure shock case (U=0) the temperatures decreases rapidly below 1000 K and the neutral lines are thus strong.
The situation is different in the shell (left diagram) with a relatively low temperature even close to the shock front. The radiative ionization rates prevail on the collisional ones which depend strongly on the temperature, so the picture is very similar to that of a pure photoionization regime. The density is very high and the optical thickness of the slabs is high enough to reduce the primary and secondary fluxes at a certain distance from the shock front. The gas therefore recombines. The case presented for the shell is matter-bound due to fragmentation at the shock front.
4.1.1 Spectra from the reverse shock
As mentioned before, in the epoch corresponding to the outburst the FWHM of the Balmer lines evolve from 400 to 1200 . These lines are emitted from the nebula downstream of the reverse shock bounding the wind-wind collision region between the stars (Contini 1997, Angeloni et al. 2007a). Model m600 is adopted to represent the high velocity shock: it shows relatively high H , HeII and HeI line ratios (Table 2).
The FWHM of the broad line profiles suggests the range of the shock velocity . High velocities are characteristic of the reverse shock between the stars, a high is dictated by the range of densities in the star atmosphere.
Recall that the temperature in the immediate post-shock region is , so the temperatures are high ( 2.4 106 K) for 400 , recombination coefficients are low, and even compression (n/) downstream is low close to the shock front, because the densities would correspond only to 4 (the adiabatic jump). The radiation flux related to the H and He lines and the continuum can be as strong as to be observable only at temperatures 106 K. The densities play a dominant role in the cooling rate ( n2, where n is the density) in order to recover those temperatures downstream of a strong shock. In fact, the density must be high enough ( 107 ) to reduce the temperature to T 106 K within the nebula downstream of the reverse shock. This nebula therefore should have a geometrical thickness smaller than the binary separation (1013 - 1014 cm).
This shows that , , and are the main input parameters constraining the choice of the model. Moreover, a strong tranversal component of the magnetic field can reduce compression and a high dust-to-gas ratios may speed up the cooling rate of the gas through the collision heating of dust grains (Contini 2004). The ionization parameter and the star temperature affect particularly the ionization structure of the gas.
The radiation flux emitted from the gas downstream is calculated in each slab downstream and integrated throughout the nebula. The input parameters are even more constrained by comparing the calculated flux Fc with the flux Fo observed at Earth throughout the continuum SED (Fig. 4). Recall that Fc r2=Fo d2, where r is the distance of the nebula from the system center and d is the distance to Earth. For instance, Fc = 2 108 at =5 1014 Hz is calculated downstream of a shock front with =600 and = 5 107 . For r 2 1013 and adopting d= 270 pc, Fo results 10-7 , in agreement with the observations (Fig. 4). In this case the emission lines corresponding to the heavy elements are very weak because the low temperature ( 106 K) zone in the nebula is narrow, while the Balmer and permitted He lines are high enough to be observed, due to a high ionization parameter ( 1).
The parameters are refined in order to obtain the best fit to observations in different epochs, considering that increases with time during the 1978-1986 active phase and therefore must decrease.
4.1.2 Spectra from the shells
At the earliest epochs (1978-1984) the models are constrained by the relative strength of OI 1304, 1358, SiIII] 1892, CIII] 1909, and MgII 2800. The spectra before November 1984 showed relatively strong low ionization lines which are explained by model m1shell (Tables 1 and 2) with =40 . The CIV/CIII] line ratio depends on the geometrical thickness of the nebula namely, the larger , the lower the CIV/CIII] ratio. Therefore, the observed CIV/CIII] 1 suggests to represent the shells by matter-bound models relative to a quite extended nebula (=4 1014 cm).
The parameters describing the shells are chosen considering that dust shell characteristic velocities are 30-50 and that the densities must be suitable to the giant atmosphere ( 109 ). They are slightly modified in order to obtain line ratios fitting the observations. Notice that adopting low (30-60 ) and high densities, the temperatures downstream are 6 104 K and the permitted UV lines emitted from the heavy elements are high enough to be observed.
4.1.3 Spectra from the expanding shock
The eclipse (Skopal et al. 1996) at the end of 1984 indicated that the system had rotated and the spectra were hence emitted from a different nebula, namely, the nebula downstream of the expanding shock.
In November 1984, [OIII] and [NIII] in the optical domain, and several high ionization lines (e.g. CIV, SiIV) appeared. The models best fitting both line and continuum spectra are shown in Table 3 where the line ratios are compared with the observations of Mikolajewska et al. (1988).
The parameters corresponding to the expanding shock are dictated by the FWHM of the forbidden lines, by the densities that must avoid collisional deexcitation of the forbidden lines (e.g. [OIII] 5007), and by the consistent fit of the observed continuum SED and of the line ratios.
In particular, the UV line ratios to Ly =10 calculated by model m1exp are compared with the observations by Mikolajewska et al. (1988, Table 3) at JD 2446086 (20/1/1985). This model is shock dominated, as the spectrum is emitted from gas in the external side of the expanding nebula, facing the observer. Notice that a perfect fitting of the observations is not sensible due to the approximation of the models. Therefore we have focused on the line ratios which inequivocally describe a physical situation.
The model is constrained by the CIV:CIII]:CII] line ratios. The shock dominated model m1exp cannot explain the observed HeII 1640 line. which is better approximated by model m2shell. Also in the optical range model m2shell shows HeII 4686 and HeI 5876 lines as intense as to be observed (Table 2), while OI 1304 and SiII 1814 are underestimated. In conclusion, also the shells contributed to the line spectra as well as to the continuum (see Sect. 4.2).
| line | m1shell | m2shell | m600 | m1 |
|---|---|---|---|---|
| NV 1240 | 0.003 | 0.23 | 0.001 | 4.15 |
| OI 1304 | 0.04 | 0.02 | 0.006 | 0.006 |
| CII 1335+ | 0.8 | 1.65 | 0.15 | 3. |
| OI 1356 | 0.42 | 0.19 | 0.06 | 0.05 |
| OIV]+ | ||||
| SiIV1400 | 0.34 | 1.8 | 0.02 | 8. |
| NIV] 1486 | 0.03 | 0.27 | 0.002 | 3. |
| SiII 1531 | 0.06 | 0.03 | 0.013 | 0.02 |
| CIV 1550 | 1.0 | 7.2 | 0.09 | 14. |
| HeII 1640 | 3.8 | 4.7 | 1.9 | 0.06 |
| OIII] 1663 | 0.25 | 0.9 | 0.05 | 2. |
| NIII] 1744+ | 0.1 | 0.4 | 0.002 | 1.3 |
| SiII 1814 | 0.37 | 0.2 | 0.1 | 0.08 |
| SiIII] 1892 | 0.7 | 1. | 0.4 | 2.5 |
| CIII] 1907+ | 1.2 | 2. | 0.08 | 5.6 |
| CII] 2326 | 1.5 | 1.2 | 0.25 | 3.2 |
| MgII 2798 | 1.1 | 0.5 | 3. | 0.5 |
| [NeIII] 3869+ | 0.008 | 0.004 | 0.001 | 0.3 |
| [OIII] 4363 | 0.008 | 0.004 | - | 0.45 |
| HeI 4471 | 0.04 | 0.02 | 0.03 | 0.63 |
| HeII 4686 | 0.55 | 0.65 | 0.28 | 0.005 |
| [OIII] 5007+ | 0.001 | 0.002 | - | 1.47 |
| HeI 5876 | 0.14 | 0.08 | 0.1 | 1.12 |
| [OI] 6300+ | 0.002 | 0.0004 | 0.001 | 0.25 |
| H b | 7.6e8 | 1.9e8 | 5.8e8 | 0.75 |
a shock dominated
b in
| line | obs6086 | m2shell | m1 |
|---|---|---|---|
| HI 1215 | 10 | 10 | 10 |
| NV 1240 | 1.6 | 0.02 | 0.8 |
| OI 1304 | 3.3 | 0.02 | 0.01 |
| CII 1335+ | 0.87 | 0.13 | 0.6 |
| OIV]+SiIV 1400 | 0.83 | 0.15 | 1.3 |
| NIV] 1486 | 0.19 | 0.02 | 0.43 |
| SiII 1531 | 0.77 | 0.002 | 0.02 |
| CIV 1550 | 1.8 | 0.58 | 2.7 |
| HeII 1640 | 1.4 | 0.4 | 0.01 |
| OIII] 1663 | 0.69 | 0.007 | 0.4 |
| NIII] 1744+ | 1.1 | 0.03 | 0.2 |
| SiII 1814 | 1.23 | 0.02 | 0.02 |
| SiIII] 1892 | 0.89 | 0.08 | 0.5 |
| CIII] 1907+ | 1.2 | 0.16 | 1.1 |
a shock dominated
4.2 The continuum SED
In Fig. 4 we present the modelling of the observations (Table 5) at some significant days during the 1978-86 active phase. The top left panel of Fig. 4 displays the data on a large frequency range (from radio to X-ray), while in the top right one the optical-UV range is zoomed in. The two bottom panels focus, respectively, on the IR and optical-UV flux variations: in particular, the bottom left panel shows the time-evolution of the SED in the near-IR, characteristic of a significantly variable absorption by dust.
Model results are plotted over the data in the top panels of Fig. 4. The models are cross-checked by the line spectra previously analysed (Sect.4.1) and constrained by the strong self-absorption in the radio range (top left panel). The high velocity models m600 and m1200 are needed to explain the X-ray datum (top left panel). The models characterised by 600 reproduce the Balmer line FW0M, but lead to UV-optical lines negligibly weak, so they were not included in Tables 2 and 3.
Dust is collisionally heated by the gas to high temperatures in a strong shock velocity regime and sputtering reduces the grain sizes; the smaller the radius, the higher the temperature reached by the grains. Reprocessed radiation by dust downstream of the shock fronts appear in the top left diagram of Fig. 4. Model m600 can reproduce both the optical and radio continuum slopes.
The dusty shells which fit the data in the optical-UV domain at maximum of activity (JD 2444937-2445720 = 28/11/1981-20/1/1984) contribute also to the CIV and CIII] lines in agreement with observations. Dust in the shells is mainly heated by radiation from the hot star: this was already found by previous investigations (Munari et al. 1996, Angeloni et al. 2007b,c). Throughout expansion, the dust shells gradually fragmented by interaction with the environment, may reach the external edge of the binary system ( 1014 cm), becoming circumbinary and playing a primary role in the complex obscuration episodes of CH Cyg.
At JD 2446212 (26/5/1985) and 2446776 (11/12/1986 - Fig. 4, right panels) at the end of the active phase a flat component appears in the near-UV SED. This is interpreted by model m1exp which represents the nebula downstream of the shock propagating outwards the system. Model m1exp is shock dominated (U=0) and explains most of the line ratios observed by Mikolajewska et al. (1988) at JD 2446086 (20/1/1985 - Table 3). The slopes at JD 2446212 (26/5/1985) and 2446776 (11/12/1986) can also be fitted by the same m1exp model in the radiation dominated case, adopting a relatively low U. However, in this case, the calculated line ratios are lower than observed. Recall that the line spectrum and the continuum were observed at different, although close, days. This is a further evidence that if the medium surrounding the system is clumpy enough, the radiation flux throughout its path from the WD to the external shock can be flickering.
During the brightness minimum in 1985, CH Cyg showed X-ray emission (Leahy & Taylor 1987). Simultaneous radio observations with the Very Large Array (VLA) revealed a radio outburst and expanding jets (Taylor et al. 1986). The X-ray datum in Fig. 4 was taken at the end of 1984, therefore constraining the models at that time. For earlier times, when no data are available, Leahy & Taylor suggested a flux lower by a factor of 80. We agree with them that the very large column density of the downstream nebulae led to large absorption in the 0.05 - 1.5 keV range.
4.3 Radii of shells and nebulae
Comparing the bremsstrahlung calculated at the nebula with the data observed at Earth we obtain the factors = r2/d2, where r is the distance of the nebula from the system centre and d is the distance to Earth.
The reverse shock (model m600) was hence located at a radius of 2 1013 cm. The top right panel of Fig. 4 points out that the bremsstrahlung from the shell in the optical-UV range, represented by model m2shell, can explain the data at two different days, JD 2443877 (3/1/1979) and JD 2444937 (28/11/1981). The calculated radii are 2.88 1013 and 9 1013 cm, respectively, to which would correspond a shell expansion of 6 1013 cm in 2.9 years. This, in turn, would correspond to a velocity 7 , much lower than the shock velocity (=60 ), unless the two shells were ejected at different times. The latter hypothesis seems more realistic, as the pulsation frequency of the cool component is actually 756d.
The expanding shock reached a radius of 8 1016 cm. The geometrical thickness of the cool region (T K) within the downstream nebula is constrained by the relatively strong self absorption of free-free radiation in the radio. The optical thickness is n2 , where the density n ( 106 considering compression downstream) is constrained by the slope of the bremsstrahlung: a larger n would lead to a steeper bremsstrahlung in the UV-optical range. This allows us to give a lower limit to the geometrical thickness of the cool region : 2 1015 cm.

5 1987-1990 quiescent phase: the obscuration effect

5.1 The line spectra
Taranova & Yudin (1992) stated that the optical spectra taken in 1988 did not reveal any emission lines (Mikolajewski et al. 1990) or revealed only very week H and H lines (Andrillat 1988, Bopp 1990). In 1989, before the next outburst, an emission line spectrum with FeII, [FeII], [SII] 4068, and faint one-component H was lying upon numerous absorption lines. The spectrum can be roughly explained by the expanding nebula represented by model m1exp with =150 . At JD 2448122 (18/8/1990), Tomov & Mikolajewski (1992) observed numerous emission lines from the shell which can be explained by model m2shell.
5.2 The continuum SED
In Fig. 5 we present the SEDs observed during the quiescent period 1987-1990 between the two active phases 1978-86 and 1991-95. Fig. 5 is structured as Fig. 4. In the top right panel the V data are fitted by the bb flux from the cool star, while the B and U data showed a flat slope that can be reproduced by models m1exp and m2exp, corresponding to different preshock densities (Table 1). So we constrain the models by the line ratios, recalling (Sect. 5.1) that the optical spectra observed in 1988 did not reveal any emission lines or very week H and H . This excludes the shock dominated model m1exp that was used to fit the flat slopes at the end of the 1978-86 active phase and the line spectrum at JD 2446086 (20/1/1985).
The models which best fit the slopes at JD 2448136 (1/9/1990) and JD 2447339 (26/6/1988), m2exp and m3exp, respectively, are both shock dominated with 100 and relatively high , which lead to negligible line emission downstream. They indicate that the outflowing shock is propagating through a denser medium, perhaps a residue of matter ejected during previous eruptions.
Finally, let us compare the near-IR fluxes during the 1978-86 phase with the ones during the 1987-90 phase (bottom left panels of Figs. 4 and 5, respectively): while in the former case the slopes showed a dust absorption clearly wavelength-dependent, during the quiescent phase minimum the IR flux decreased equally throughout the whole near-IR range, suggesting an obscuration effect by an external shell.
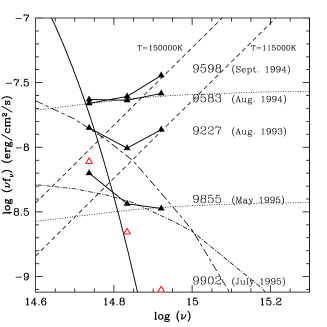
6 1991-1995 active phase: the black body radiation from the WD
A new active phase began in December 1991 with a large flux rise in U, a smaller one in B and a negligible one in V. This trend was sustained until March 1992. Then, from the beginning of 1993 the U band rose again until summer 1994. The eventual drop in summer 1995 informed that the outburst was running out.
It is worth noting that during this 1991-95 high state, the bb continuum flux from the hot star became gradually detectable (right panel of Fig. 6). As a matter of fact, the appearance of a hot continuum source with Teff=150,000 K was taken as the indication of the beginning of the outburst by Skopal et al. (1996). To obtain an initial hint about the system during this active phase, we compare the evolution of the slopes in the U-B-V during the 1978-87 and 1991-95 active phases in Fig. 6. An impressive difference can be noticed comparing the right and left panels: in particular, the left one shows that in the first active phase the trend in the UB range cannot be explained by the bb flux from the hot star which vice-versa is evident (right diagram) during the 1991-95 outburst. The direct contribution of the hot star to the U band is shown at the 1991-95 active phase maximum (JD 2449598 2/9/1994). In Fig. 6, the low frequency tails of the black body curves correspond to =100,000 K (dashed line) and =35,000 K (dotted line). These temperatures represent the maximum and minimum one, respectively, during and after the outburst (Corradi et al. 2001). The slopes of both bb fluxes in the UB frequency domain are slightly different than observed, and are even less fitting the data before (thin lines) and after maximum (thick lines). We suggest that the WD was hidden from a direct view in the 1978-86 active phase, while it became visible during the 1991-95 maximum.
The two deep minima in U recorded at the end of September 1992 and in October 1994 lasted 81 and 127 days, respectively. They were attributed to the eclipse of the active component by the cool one in the light of the triple star model (Skopal et al 1996), but they are hardly explained by the binary interpretation which ascribes the 756d periodicity to a non-radial pulsation of the M giant. Fig. 6 (bottom panel) shows that the eclipses of September 1992 just before JD 2448900 (4/10/1992) and of October 1994 involved only the B and U bands, the WD and the shocked nebula being eclipsed most probably by dust shells. The V band in fact was not involved as it recovered its range of magnitudes that were shifted during the bursts by the contribution of the nebulae. Similarly, the relatively weak maxima immediately after the ”eclipses” were due to emission from the shocked nebulae. We suggest that the minima were due to absorption by the dusty shells that are ejected in tune with the pulsation of the red giant. Recall that the dusty shells are highly fragmented therefore this effect cannot be observed periodically.
6.1 The line spectrum
At JD 2448094 (21/7/1990), a dramatic change led to broad hydrogen absorption profiles and at JD 2448095 (22/7/1990)
CH Cyg displayed faint emission in H with corresponding velocities around -67 .
Then, in August 1991, the appearance of absorption terminal radial velocities
of -1000 and -900 for H and H , respectively, might have been a consequence
of the rotation of the system.
This would have allowed us to see the reverse shock in front of the WD.
Eventually, the absorptions turned into emissions with velocities up to 1800 for H and 1600 for H : these velocities disappeared at the beginning of the 1992.
From JD 2448883 (17/9/1992) the H emission increased, whereas no absorption lines were observed.
High velocities had been observed also during the previous active phase (Sect. 4) and
there explained by the reverse shock model.
The spectral region around [OIII] 5007 showed complicated structures consistent with more components. During the outburst (1992 onwards) strong emission lines of FeII, [FeII], [SII], and H were observed, while [NeIII]3869+ and [FeIII] 4659-4670 were still faint, increasing later. Also, [OIII]4363 and [OIII] 5007+ were relatively faint and varied rapidly during the active phase. The overall scenario, with multiple emission line components and structured line profiles, may be qualitatively understood by Richtmyer-Meschkov (R-M) and Kelvin-Helmoltz (K-H) instabilities (Graham & Zhang 2000). R-M is an interfacial instability between two fluids of different density driven by shock waves. The K-H instability leads to the consequent fragmentation of matter at the shock front (Contini & Formiggini 2001). The clumpiness of the nebula might then contribute to flickering episodes.
On September 1992, the M-giant was even more apparent due to the eclipse. The red part of the spectrum was dominated by the M-giant molecular spectrum, overlayed by strong H , [OI]6300, and HeI 5876 emissions. There were simultaneous emission lines of [SII], [NeIII], and [FeIII]; notice that the HeII 4686 and 1640 lines were not present during the outburst. We suggest that the line spectrum is most probably emitted from a disrupted shock dominated expanding nebula (m1exp) characterised by low HeII lines (Table 2).
In May 1993 the UV emission line spectrum showed Ly , OIV], SiIV 1400, CIV 1550, OIII] 1666, SiIII] 1892, CIII] 1909, CII] 2325, [OII] 2470. These lines are reproduced by the model for the expanding nebulae m1exp. Moreover, numerous FeII multiplets appeared, together with MgII 2796, 2803 doublet, and sharp emission lines, ArIII 2187, 2191. In August 1994, a sharp absorption cutting the emission line profiles at =150 most likely shows that the expanding nebula is facing the observer. In fact, the strongest emission came from the line core while a very broad and smooth absorption up to -1600 was seen.
6.2 The continuum


Active phase 1991-1995 (JD 2440000+)

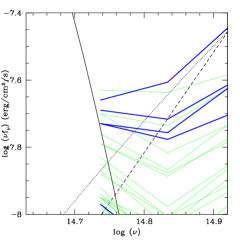
The SEDs of the continuum are shown in Fig. 7 diagrams. The models which appear in the left diagrams, covering the whole spectral range, were selected by the consistent fit of the data in the optical-UV range (zoom in the middle diagram), of the radio and of the X-ray data.
We start by presenting the modelling in the optical-UV range because it is more constraining. Around maximum at JD 2449598 (2/9/1994), the flux SED corresponding to the sum of the expanding shock (m1exp) bremsstrahlung and the bb flux from the hot star (=150,000 K) reproduces the slope of the U-B-V SED. At JD 2449583 (18/8/1994) the bb component was not visible. This may be explained by the fragmented nature of the shells which screen the flux from the WD, confirming Eyres et al. (2000) claim that flickering cannot be observed during the eclipse.
Similarly, the flux SED which best reproduces the trend of the data at JD 2449227 (27/8/1993) results from the sum of model m1200 with the WD bb flux: recall that broad lines were still emitted in 1993. In May 1995 we observed only the expanding shock corresponding to model m2exp.
Fig. 7, middle diagram shows that the bb flux from the WD grew by a factor of 2.75 between JD 2449227 (27/8/1993) and JD 2449598 (2/9/1994), corresponding to an increase of the WD temperature from 115,000 K to 150,000 K.
We can now examine the data on a large scale, from radio to X-ray. The radio slope between 1992 and 1993 as observed by MERLIN, VLA, and JCMT (Skopal et al 1996) is once again explained by bremsstrahlung with a strong self-absorption at longer wavelengths. The best fit is obtained with a model corresponding to =1200 in the reverse shock. This model also explains the data in the optical-UV range and the hard X-ray. Models m1exp and m2exp give a negligible contribution in the radio. Skopal et al. (1996) proposed a velocity of 310 in order to match the contemporary angular radius observed by MERLIN: this discrepancy is easily explained as we deal with disrupted nebulae downstream of head-on shocks in a highly turbulent regime.
The soft X-ray datum by ASCA was modelled by Ezuka et al. (1998) as two optically thin thermal plasma emissions. We find (Fig. 7, left diagram) that the soft X-ray is emitted downstream of the expanding shock, while the hard X-ray would correspond to the reverse shock between the stars with a velocity of 1200 .
An impressive systematic evolution of the JKLM band flux appears in the right
diagram of Fig. 7, indicating that dust is involved in the obscuration process.
Finally, by exploiting the factors defined in Sect. 4.3 we can calculate for the reverse shock a radius of 4 1013 cm and for the expanding nebulae which best fit the data a corresponding radius of 1016-3 1017 cm. Similar dimensions of the system were found by HST imaging in the 1998-2001 active phase by Eyres et al (2002) after about 5 years. Adopting en expanding velocity 100 the radius increment is relatively small ( 2 1015 cm).
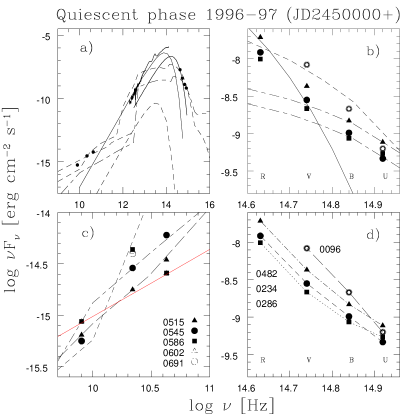
7 1996-1997 transition phase: the contribution of radio synchrotron radiation
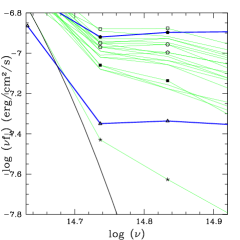
During the quiescent phase 1996-97 some interesting radio observations were taken between March and October 1997 by Karovska et al. (1998). The data (Fig. 8, top left), along with an intriguing flux variability, followed the trend of an absorbed bremsstrahlung as was found in previous phases adopting a high velocity model (=1200 ). A particular investigation of the radio range is shown in Fig. 8, bottom left diagram. The slope of the data at 8 and 43 GHz observed between May and August 1997 could be fitted by synchrotron emission created at the shock front by the Fermi mechanism in the non-relativistic case (Bell 1978) with a characteristic spectral index = -0.35. This is not surprising because non-thermal emission was also invoked by Crocker et al. (2001) in order to explain the radio data between 1985 and 1999, adopting a magnetic field of the order of 1-3 mG. Interestingly, we have reached the same values of the magnetic field ( = 1-3 mG, Table 1) by consistent modelling of line and continuum spectra in the different phases. Nonetheless, the datum at 22 GHz is highly underpredicted by the synchrotron radiation and may refer to a completely different emission process, e.g. bremsstrahlung from the downstream nebula. A high velocity model is in fact requested by the optical-UV data, as presented in Fig. 8 (top diagrams).
Regarding the infrared range, it is worth reminding some results of 1997 ISO observations,
unfortunately still no fully exploited.
Schild et al. (1999), who did a preliminary analysis of the spectra, found no strong
emission lines but [OI]63 m, and strong OH and weak H2O molecular emission
on top of a rapidly decreasing continuum. This continuum can be fitted by a single
dust shell model ( 1000K, Fig. 8), in contrast with other SSs which seems to
display multiple dust shells with characteristic radius and temperatures
(Angeloni et al. 2007c).
The dust chemistry was quite surprising, since weak PAHs (at 6.3 m) coexisted
with dominant amorphous silicate (at 9.7 and 18 m).
Unfortunately, a comparative study of dust spectroscopy capable of investigating
the grain formation and destruction processes throughout both the active and
quiescent phases is still not possible for lacking of data
(see Angeloni et al. 2007a for a comparison of emission lines and silicate dust features,
from ISO spectra, in a various sample of SSs including CH Cyg).
ISO-SWS observed the system twice during this quiescent phase, and in Fig. 9
we show a comparison of the two recorded spectra.
As one can notice, the maximum flux variation seems to be in correspondence of the strong
silicate emissions, while the underlying dust continuum appears not so sensitive to the
environment variation due to the giant pulsations.
How this can be related to the actual dust formation and processing is far from understood.

8 1998-2001 active phase: jets and X-rays
8.1 The line spectra
As noticed by Eyres et al. (2002) in the HST imaging, the very inner regions of CH Cyg contributed mainly to continuum, and very little to the line emission. In our interpretation this is not surprising since the nebulae emitting the line spectra would correspond to the expanding nebulae that are moving towards the outside of the system.
Balmer lines H , H , H, all double peaked, lay upon a broad feature 1200 wide confirming that a fast reverse shock of =1200 was present within a small radius 1013 cm. The fast shock can explain also the X-ray Chandra observations of 2001 at 0.26 and 2 keV reported by Galloway & Sokolowski (2004). Indeed, the temperature in the immediate post shock region corresponding to that , is 2.16 107 K, decreasing downstream to 1.5 107. The cooling rate is not so strong because recombination coefficients are low at such high temperatures.
The HST images by Eyres et al. (2002) revealed strong [OIII], which can be explained by the expanding nebulae m3exp modelled by fitting the SEDs.
In September 1998 the OI, HeI, HeII, FeII, and TiII were probably emitted from the shells. [OIII] 5007 was also evident, while [OIII] 4363 absent both in and out the eclipse. We have run some further models corresponding to expanding nebulae (MEexp and ME1exp) which, in agreement with the observations, predict relatively low [OIII] 4363 (Table 4). The input parameters are shown in the bottom of Table 4. The models are shock dominated (U=0). The dust-to-gas ratios adopted in these models are 4 10-4 by mass.
Corradi et al. (2001) indicated strong [OII] and [NII] lines in the 1999 images. These strong low ionization lines are characteristic of shock dominated models, e.g. MEexp and ME1exp, which might occur from the collision of the expanding jets with the surrounding ISM. The radius of these shocked nebulae are calculated by fitting the continuum SED. The factors lead to a radius 3 1016 cm.
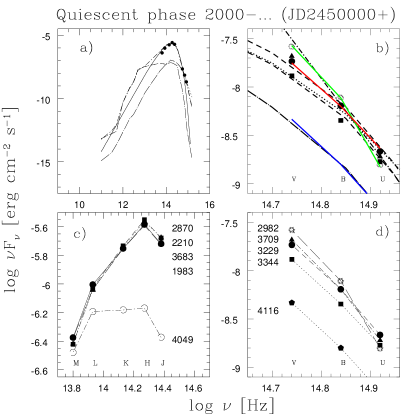
8.2 The continuum SED
In Fig. 10 we present the modelling of the 1998-2001 active phase. Some significant UBV data are taken from Eyres et al (2002, Fig. 2). Fig. 10 (left diagram) shows that the best fit of the UBV slopes are obtained by model m2exp in December 1998 during the maximum, while at later epochs the slopes are reproduced by model m1200. This can be explained considering that at maximum the relative position of the different system components (stars, nebulae, shells) is such that we cannot see the reverse shock, which appears only after some months.
The fitting of the models to the data in Fig. 10 (right diagram) leads to similar factors for the two models. However, we know that the radius of the reverse shock is much smaller than that of the expanding shock by at least a factor of 100. This question is resolved invoking the filling factor as a key parameter. The radii of the expanding shell at maximum of the active phase and of the reverse shock at later epochs result of 1.3 1012/ cm and of 1.4 1012/ cm, respectively, leading to corresponding filling factors of 0.001 and 0.1, to recover more sensible radii (cfr. Sect. 4.3). Small are suitable to the fragmented character of matter throughout the expanding shock deriving from dynamical instabilities e.g. R-M and K-H (Sect. 6.1 and Contini & Formiggini 2001).
Fig. 10 (left diagram) shows also that the ratio adopted by model MEexp is just a lower limit, because the flux corresponding to reradiation by dust is constrained by the SED, definitively dominated by bb from the cool star in that wavelenght range. The low velocities of these models indicate that the expanding nebulae swept up a large amount of interstellar matter, whose actually corresponds to 4 10-4. This matter probably existed before the start of this outburst, and might be considered as a sort of remnants from the former bursts which have then propagated throughout the ISM.
Active phase 1998-2000 (JD 2450000+)


| line | MEexp | ME1exp |
|---|---|---|
| [OII] 3727+ | 40. | 19. |
| [OIII] 4363 | 2.6 | 2.18 |
| HeII 4686 | 0.016 | 0.027 |
| [OIII] 5007+ | 35.3 | 25.7 |
| HeI 5876 | 0.4 | 0.58 |
| [OI] 6300+ | 0.37 | 0.40 |
| [NII] 6584+ | 8.9 | 6.42 |
| H () | 0.0013 | 0.0025 |
| () | 70 | 100 |
| () | 5.e3 | 5.e3 |
| (gauss) | 1.e-3 | 1.e-3 |
| D (cm) | 1.e15 | 1.e15 |
9 From 2001 up to date
Since 2001, CH Cyg persists in a quiescent phase recovering from the latest high state, at a rather bright magnitude (U10 or less, V=7-8, B=8.7-9.4). During the last months it showed a 2mag decline in the optical bands (2006 June-December, Skopal et al. 2007) and a most significant, anomalous, IR fading (Taranova & Shenavrin 2007).
In April 2004, high-resolution optical data by Yoo (2006) detected double-peaked emission components for the H and H profiles, with an interesting V/R 1, where V and R stand for the intensities of the blue and red wings, respectively. This has been taken as a proof, along with the vanishing of the blue continuum, that at that time an accretion disk was already present, although highly processed. Moreover, the multiple-peaked profiles of the emission lines led to suggest a strong non-homogeneous envelope, result of the collision between some outflowing matter and the circumstellar shells.
A few months later, in October, new observation revealed (Yoo 2007) a rapidly developing framework, with single-peaked H and H emissions and no absorption component at their line centres. The V/R ratio became , indicating that the accretion disk might have been destroyed within the April-October time interval. Variability in the H blue component intensity has been explained as the actual expansion effect of some jets. Moreover, the blue continuum became so dim as to unveil the M giant even at short wavelengths, while a contemporary enhancement of the emission lines allowed to detect conspicuous [OIII] 4959 and [OIII] 5007, along with broad emission components of [NeIII] lines. This emission might have originated in an extended, expanding shell constructed by the outflowing matter from the WD.
In the X-ray, Mukay et al. (2006), analysing Suzaku observations of 2006 January and May, found CH Cyg in a soft X-ray bright, hard X-ray faint state. While the soft X-ray flux level was similar to the 1994 ASCA observation, the hard one was much lower, confirming that the hard component is more variable than the soft component (Ezuka et al. 1997), which in turn may be spatially distinct. Assuming a binary period of 14.5 years, the entire binary should be extended 0.4” (100AU at 270 pc), explaining why Chandra was not able to resolve the system and, at the same time, in agreement with an extended X-ray emission region, comparable with the size of the binary, as expected in the colliding wind interpretation demonstrated by consistent modelling.
The hard X-ray component, more directly sensitive to the variable symbiotic activity, is the manifestation of those non-thermal emission processes (such as synchrotron) which once again prove the key-role played by shocks in accelerating relativistic particles responsible for the bulk of emission at h10 (De Becker et al. 2007).
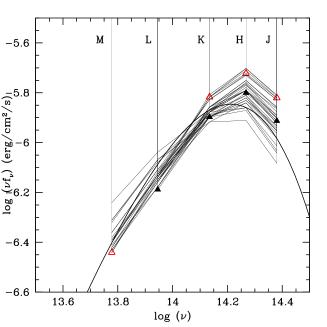
In Fig. 11 we present the modelling of the UBV and JHKLM data presented by Skopal et al. (2007) and Taranova & Shenavrin (2007), respectively. The models which best fit the slopes of the data are the combination of those used in previous epochs (see caption of Fig. 11). Three main slopes can be noticed. That at maximum of U (red) shows a contribution of two nebulae with different densities. The curve with the highest V (green) have a conspicuous contribution from the giant bb radiation. This contribution decreases and even disappears at minimum (blue curve), indicating that the whole binary system is obscured by the expanding nebula, as was found in previous epochs.
10 Discussion and concluding remarks
The complex nature of the SS CH Cygni has been investigated by modelling the line and continuum spectra at different epochs, from the impressive outburst of 1978 up to date. Our results give an approximated picture of the shocked nebulae throughout the system because our approach implies a plane parallel geometry for the different shock fronts. This is constrained by the composite models which account for both photoionization from the WD and shocks created by the collision of the winds. However, the plane-parallel geometry can be justified for relative large radii and in particular situations characteristic of SS.
The present analysis has revealed that similar developing trends may be recognised throughout the active phases and throughout the quiescent phases. In the light of a colliding-wind scenario, we have specifically focused on the role of the nebulae created by collision of the winds from the hot and the cool stars, in order to build up a comprehensive view of the system as a whole, namely to self-consistently interpret the variable line spectra, the radio emission, the IR photometric properties, the fluxes in the U B V bands and the X-ray observations. The most important result of our method that can be applied to all the SSs, consists in recognizing the different sources of radiation (stars, nebulae, dust) throughout the continuum SED.
We have found that bremsstrahlung from the nebula downstream of the shock front facing the WD between the stars explains the continuum slopes observed during the active states. These fast shocks seem to be always present during the outbursts, proving that the wind collision is playing a primary role in the spectral properties of the symbiotic phenomenon (e.g. radio and X-ray wavelength region). The circumstellar dusty shells define the optic-UV SED , also contributing to the line spectra during the active phases.
The WD may be related to flickering during the active phases, either by appearing directly (1991-95) or by photoionising the shells throughout a disrupted medium (1978-87). Towards the end of the active phases, the expanding shock propagating outward the system is visible both in the continuum SED and in the line spectra.
During the quiescent phases the circumbinary expanding shocks dominate. We have found that these shocks propagate throughout a relatively dense medium which may be interpreted as matter ejected in previous outbursts. This leads to a relative strong synchrotron radiation from the shock front at some epochs.
The jets observed by Corradi et al (2001) imply the presence of an accretion disk. The modelling of the low-ionisation lines (e.g. [NII, [OII]), that are strong in their images, confirms that the jets expanding in the ISM, have reached a radius 0.01 pc from the SS.
We have shown, by consistent modelling, that soft and hard X-rays are emitted downstream of shock fronts corresponding to quite different velocities, namely, the expanding shock ( 100-150 ) propagating outwards the binary system would explain the soft X-ray emission, while the hard X-rays correspond to the high velocity shock between the stars, in agreement with the recent results discussed by Karovska et al. (2007) on the basis of radio, optical and X-ray imaging.
Dust grains within the nebulae are collisionally heated by the gas in a strong shock velocity regime ( 600 ), while, in the dusty shells, grains are mainly heated by radiation from the hot star. The dust expanding disrupted shells might reach, in some cases, the external edge of the symbiotic system (r 1014 cm), becoming circumbinary and therefore contributing to the complex obscuration episodes of CH Cyg.
It should be emphasized that the interpretation of CH Cyg spectral evolution is further complicated by the relatively short orbital period (14.5 years): in fact, the orbital motion combined with the unpredictable recurrent activity leads to different system configuration as seen from Earth. We have tried to explain them by combining the radiation fluxes from the several emitting contributors with different, variable weights.
For the sake of clarity, we schematically summarise the results of our modelling:
1978-1987 active phase
-
•
Emission lines with FWHM of 400 - 1200 correspond to the reverse shock;
-
•
before 1984 November, low-ionisation lines come from the shells;
-
•
after 1994, higher level lines are emitted both by the expanding nebula and the dusty shells;
-
•
at days JD2446212 and JD2446776, UV and optical lines from the expanding nebulae appear;
-
•
at the end of the active phase, shock dominated models explain both line and continuum spectra.
1988-1990 quiescent phase
-
•
The expanding nebula propagates throughout matter ejected in previous eruptions;
-
•
in the IR the system is obscured independently from wavelength.
1991-1995 active phase
-
•
In 1991, at the onset of the new active state, the lines display FWHM 100 , indicating a disrupted expanding nebula;
-
•
in August 1991, broad H and H are seen in absorption, suggesting that the reverse shock is absorbing the WD flux;
-
•
by 1992 absorption lines disappear and M-giant molecular bands are observed. In May 1993, UV lines are emitted from an expanding nebula with a radius of 1016 - 1017 cm.
1996-1997 quiescent phase
-
•
The radio flux shows a synchrotron component created by the Fermi mechanism at the shock front.
1998-2001 active phase
-
•
. A fast reverse shock of 1200 may explain the X-ray Chandra observations in 2001;
-
•
the HST images by Eyres et al. (2002) reveal strong [OIII], which can be explained by the expanding nebulae in agreement with the fit of the SED;
-
•
in 1998 Sept the OI, HeI, HeII, FeII, and TiII lines are emitted from the shells. Moreover, [OIII] 5007 is evident and [OIII] 4363 is absent both in and out of the eclipse. These lines come from shock-dominated expanding nebulae with relatively low velocities (70-100 ) and relatively low densities ( 5000 ). In fact the corresponding [OIII] 4363 lines are relatively low;
-
•
the 1999 images of Corradi et al. (2001) indicate strong [OII] and [NII] lines: they are characteristic of a shock dominated nebula with a relative low =5 103 .
2001-up to date
-
•
three different slopes are observed in the optical-IR range. They are modelled by the combination of different expanding models with the bb flux from the cool component star.
-
•
the decline observed by Taranova & Shenavrin in the IR is consistent with the decline in the optical-UV range and is explained by the eclipse of the whole system.
Acknowledgements
We are grateful to Elia Leibowitz for interesting conversations. We would like to thank the anonymous referee for many helpful comments.
References
- Allen (1973) Allen, C. W. 1973, London: University of London, Athlone Press, 1973, 3rd ed.
- Altenhoff et al. (1994) Altenhoff, W. J., Thum, C., & Wendker, H. J. 1994, A&A, 281, 161
- Angeloni et al. (2007) Angeloni, R., Contini, M., Ciroi, S., & Rafanelli, P. 2007, AJ, 134, 205
- Angeloni et al. (2007) Angeloni, R., Contini, M., Ciroi, S., & Rafanelli, P. 2007, A&A, 471, 825
- Angeloni et al. (2007) Angeloni, R., Contini, M., Ciroi, S., & Rafanelli, P. 2007, A&A, 472, 497
- Bell (1978) Bell, A. R. 1978, MNRAS, 182, 147
- Biller et al. (2006) Biller, B. A., et al. 2006, ApJ, 647, 464
- Contini (1997) Contini, M. 1997, ApJ, 483, 887
- Contini & Formiggini (1999) Contini, M., & Formiggini, L. 1999, ApJ, 517, 925
- Contini & Formiggini (2001) Contini, M., & Formiggini, L. 2001, A&A, 375, 579
- Contini (2003) Contini, M. 2003, MNRAS, 339, 125
- Contini & Formiggini (2003) Contini, M., & Formiggini, L. 2003, MNRAS, 339, 148
- Contini et al. (2007) Contini, M., Angeloni, R., & Rafanelli, P. 2007, submitted
- Corradi et al. (2001) Corradi, R. L. M., Munari, U., Livio, M., Mampaso, A., Gonçalves, D. R., & Schwarz, H. E. 2001, ApJ, 560, 912
- Crocker et al. (2001) Crocker, M. M., Davis, R. J., Eyres, S. P. S., Bode, M. F., Taylor, A. R., Skopal, A., & Kenny, H. T. 2001, MNRAS, 326, 781
- De Becker et al. (2007) De Becker, M., Rauw, G., Pittard, J. M., Blomme, R., Romero, G. E., Sana, H., & Stevens, I. R. 2007, ArXiv e-prints, 709, arXiv:0709.1033
- Deutsch (1964) Deutsch, A.J. 1964 Ann. Rep. Mt. Wilson and Palomar Obs., 11
- Eyres et al. (2002) Eyres, S. P. S., et al. 2002, MNRAS, 335, 526
- Ezuka et al. (1998) Ezuka, H., Ishida, M., & Makino, F. 1998, ApJ, 499, 388
- Formiggini et al. (1995) Formiggini, L., Contini, M., & Leibowitz, E. M. 1995, MNRAS, 277, 1071
- Galloway & Sokoloski (2004) Galloway, D. K., & Sokoloski, J. L. 2004, ApJl, 613, L61
- Gaposchkin (1952) Gaposchkin, S. 1952 Ann. of Harvard College Obs., 118,155
- Graham & Zhang (2000) Graham, M. J., & Zhang, Q. 2000, ApJs, 127, 339
- Hack et al. (1988) Hack, M., Engin, S., Rusconi, L., Sedmak, G., Yilmaz, N., & Boehm, C. 1988, A&As, 72, 391
- Hinkle et al. (1993) Hinkle, K. H., Fekel, F. C., Johnson, D. S., & Scharlach, W. W. G. 1993, AJ, 105, 1074
- Ipatov et al. (1984) Ipatov, A. P., Taranova, O. G., & Iudin, B. F. 1984, A&A, 135, 325
- Ivison et al. (1991) Ivison, R. J., Bode, M. F., Roberts, J. A., Meaburn, J., Davis, R. J., Nelson, R. F., & Spencer, R. E. 1991, MNRAS, 249, 374
- Karovska et al. (1998) Karovska, M., Carilli, C. L., & Mattei, J. A. 1998, Journal of the American Association of Variable Star Observers (JAAVSO), 26, 97
- Karovska et al. (2007) Karovska, M., Carilli, C. L., Raymond, J. C., & Mattei, J. A. 2007, ApJ, 661, 1048
- Kenny & Taylor (2005) Kenny, H. T., & Taylor, A. R. 2005, ApJ, 619, 527
- Leahy & Taylor (1987) Leahy, D. A., & Taylor, A. R. 1987, A&A, 176, 262
- Mikolajewska et al. (1988) Mikolajewska, J., Selvelli, P. L., & Hack, M. 1988, A&A, 198, 150
- Mikolajewski et al. (1992) Mikolajewski, M., Mikolajewska, J., & Khudyakova, T. N. 1992, A&A, 254, 127
- Mukai et al. (2007) Mukai, K., Ishida, M., Kilbourne, C., Mori, H., Terada, Y., Chan, K.-W., & Soong, Y. 2007, PASJ, 59, 177
- Munari et al. (1996) Munari, U., Yudin, B. F., Kolotilov, E. A., & Tomov, T. V. 1996, A&A, 311, 484
- Munari et al. (1997) Munari, U., Renzini, A., & Bernacca, P. L. 1997, Hipparcos - Venice ’97, 402, 413
- Nussbaumer et al. (1995) Nussbaumer, H., Schmutz, W., & Vogel, M. 1995, A&A, 293, L13
- Selvelli, P.-L. & Hack, M. (1952) Selvelli, P.-L. & Hack, M. 1985 ESASP.236, 207
- Schild et al. (1999) Schild, H., Dumm, T., Folini, D., Nussbaumer, H., & Schmutz, W. 1999, The Universe as Seen by ISO, 427, 397
- Schmidt et al. (2006) Schmidt, M. R., Začs, L., Mikołajewska, J., & Hinkle, K. H. 2006, A&A, 446, 603
- Seaquist & Gregory (1973) Seaquist, E. R., & Gregory, P. C. 1973, Nature, 245, 85
- Selvelli & Hack (1985) Selvelli, P. L., & Hack, M. 1985, Recent Results on Cataclysmic Variables. The Importance of IUE and Exosat Results on Cataclysmic Variables and Low-Mass X-Ray Binaries, 236, 207
- Skopal et al. (1996) Skopal, A., et al. 1996, MNRAS, 282, 327
- Skopal (1997) Skopal, A. 1997, Informational Bulletin on Variable Stars, 4495, 1
- Skopal et al. (2000) Skopal, A., Pribulla, T., Wolf, M., Shugarov, S. Y., & Jones, A. 2000, Contributions of the Astronomical Observatory Skalnate Pleso, 30, 29
- Skopal et al. (2002) Skopal, A., Vanko, M., Pribulla, T., Wolf, M., Semkov, E., & Jones, A. 2002, Contributions of the Astronomical Observatory Skalnate Pleso, 32, 62
- Skopal et al. (2004) Skopal, A., Pribulla, T., Vaňko, M., Velič, Z., Semkov, E., Wolf, M., & Jones, A. 2004, Contributions of the Astronomical Observatory Skalnate Pleso, 34, 45
- Skopal (2005) Skopal, A. 2005, A&A, 440, 995
- Skopal et al. (2007) Skopal, A., Vanko, M., Pribulla, T., Chochol, D., Semkov, E., Wolf, M., & Jones, A. 2007, ArXiv e-prints, 708, arXiv:0708.1578
- Sokoloski & Kenyon (2003) Sokoloski, J. L., & Kenyon, S. J. 2003, ApJ, 584, 1021
- Solf (1987) Solf, J. 1987, A&A, 180, 207
- Taranova & Iudin (1988) Taranova, O. G., & Iudin, B. F. 1988, Ap&SS, 146, 33
- Taranova & Yudin (1992) Taranova, O. G., & Yudin, B. F. 1992, Soviet Astronomy, 36, 132
- Taranova & Shenavrin (2004) Taranova, O. G., & Shenavrin, V. I. 2004, Astronomy Reports, 48, 813
- Taranova & Shenavrin (2007) Taranova, O. G., & Shenavrin, V. I. 2007, Astronomy Letters, 33, 531
- Taylor & Seaquist (1985) Taylor, A. R., & Seaquist, E. R. 1985, IAU Circular, 4055, 2
- Taylor et al. (1986) Taylor, A. R., Seaquist, E. R., & Mattei, J. A. 1986, Nature, 319, 38
- Taylor et al. (1988) Taylor, A. R., Seaquist, E. R., & Kenyon, S. J. 1988, The Symbiotic Phenomenon, Proceedings of IAU Colloq. 103, held in Torun, Poland, 18-20 August, 1987. Edited by Joanna Mikolajewska, Michael Friedjung, Scott J. Kenyon, and Roberto Viotti. Dordrecht, Kluwer Academic Publishers (Astrophysics and Space Science Library. Volume 145), 1988., p.231, 231
- Tomov & Mikolajewski (1992) Tomov, T., & Mikolajewski, M. 1992, Informational Bulletin on Variable Stars, 3721, 1
- Wheatley & Kallman (2006) Wheatley, P. J., & Kallman, T. R. 2006, MNRAS, 372, 1602
- Willson et al. (1984) Willson, L. A., Salzer, J., Wallerstein, G., & Brugel, E. 1984, A&A, 133, 137
- Yoo (2006) Yoo, K. H. 2006, New Astronomy, 11, 359
- Yoo (2007) Yoo, K. H. 2007, New Astronomy, 12, 569
Appendix A Observational references
| Observation | References | |
|---|---|---|
| date | ||
| radio | 1984 Apr - 1985 May | Taylor et al. (1985, 1986, 1988) |
| IR | 1983 | IRAS CPSa |
| 1978-82 | Ipatov et al. (1984) | |
| 1978-87 | Taranova & Yudin (1988) | |
| optical | 1977-86 | Hack et al. (1988) |
| 1978-82 | Ipatov et al. (1984) | |
| 1978-87 | Taranova & Yudin (1988) | |
| 1980-87 | Bondar & Shakhovskaya (2001) | |
| UV | 1978-87 | Taranova & Yudin (1988) |
| 1981 Nov 29 | Mikolajewska et al. (1988) | |
| 1985 Jan 24 | Mikolajewska et al. (1988) | |
| 1986 Jul 16 | Mikolajewska et al. (1988) | |
| X-rays | 1985 May 24 | Leahy & Taylor (1987) |
| Observation | References | |
|---|---|---|
| date | ||
| radio | 1989 Mar 7-12 | Altenhoff et al. (1994) |
| 1988 Oct 14 | Ivison et al. (1991) | |
| IR | 1988-90 | Taranova & Yudin (1992) |
| optical | 1988-90 | Taranova & Yudin (1992) |
| UV | - | - |
| X | - | - |
| Observation | References | |
| date | ||
| radio | 1992 Jul 24 | Skopal et al. (1996) |
| 1993 Jun 17 - Aug 19 | Skopal et al. (1996) | |
| 1993 | Skopal et al. (1996) | |
| IR | 1991-95 | Munari et al. (1996) |
| optical | 1989-95 | Skopal et al. (1996) |
| 1989-94 | Skopal et al. (1996) | |
| 1991-95 | Munari et al. (1996) | |
| UV | 1989-95 | Skopal et al. (1996) |
| 1991-95 | Munari et al. (1996) | |
| 1992 Nov 24 | Skopal et al. (1996) | |
| 1993 May 27 | Skopal et al. (1996) | |
| X-rays | 1994 Oct 19 | Ezuka et al. (1997) |
| Observation | References | |
|---|---|---|
| date | ||
| radio | 1997 Mar 8 - Aug 31 | Karovska et al. (1998) |
| IR | 1997 May 10 | Schild et al. (1999) |
| optical | 1995 Dec 18 - 1997 Mar 11 | Skopal et al. (1997) |
| 1996-97 | Corradi et al. (2001) | |
| UV | 1997 Jul 10 | Corradi et al. (2001) |
| X | - | - |
| Observation | References | |
|---|---|---|
| date | ||
| radio | 1999 Sep 26 | Eyres et al. (2002) |
| IR | 1999-2003 | Taranova & Shenavrin (2004) |
| optical | 1998 Sep 5 - 2000 Oct 15 | Eyres et al. (2002) |
| 1998 Jun 29 - 2001 Nov 28 | Skopal et al. (2000, 2002) | |
| 1999 Aug 12 | Eyres et al. (2002) | |
| UV | 1999 Aug 12 | Eyres et al. (2002) |
| 1998-2000 Apr | Eyres et al. (2002) | |
| X-rays | - | - |
| Observation | References | |
|---|---|---|
| date | ||
| radio | - | - |
| IR | 1999-2007 | Taranova & Shenavrin (2007) |
| optical | 2001 Nov 28 - 2003 Nov 2003 | Skopal et al. (2004) |
| 2003 Nov 8 - 2007 Jan 15 | Skopal et al. 2007 | |
| 2004 Apr 9-11 | Yoo (2006) | |
| 2004 Oct 2-5 | Yoo (2007) | |
| UV | - | - |
| X | 2001 Mar 27 | Galloway & Sokoloski (2004) |
| 2006 Jan 04/05 - May 28/29 | Mukai et al. (2006) |