Fe and N self-diffusion in amorphous FeN:
A SIMS and neutron reflectivity study
Abstract
Simultaneous measurement of self-diffusion of iron and nitrogen in amorphous iron nitride (Fe86N14) using secondary ion mass spectroscopy (SIMS) technique has been done. In addition neutron reflectivity (NR) technique was employed to study the Fe diffusion in the same compound. The broadening of a tracer layer of 57Fe8615N14 sandwiched between Fe86N14 layers was observed after isothermal vacuum annealing of the films at different temperatures in SIMS measurements. And a decay of the Bragg peak intensity after isothermal annealing was observed in [Fe86N14/57Fe86N14]10 multilayers in NR. Strong structural relaxation of diffusion coefficient was observed below the crystallization temperature of the amorphous phase in both measurements. It was observed from the SIMS measurements that Fe diffusion was about 2 orders of magnitude smaller compared to nitrogen at a given temperature. The NR measurements reveal that the mechanism of Fe self-diffusion is very similar to that in metal-metal type metallic glasses. The structural relaxation time for Fe and N diffusion was found comparable indicating that the obtained relaxation time essentially pertain to the structural relaxation of the amorphous phase.
pacs:
66.30.FqI Introduction
FeN systems show a variety of structures with composition. Technologically, FeN is an interesting system with applications in many industries.Wang et al. (2004); Wei et al. (1991); de Wit et al. (1994) Recently amorphous phases of iron nitride were prepared using reactive sputtering with nitrogen as reactive gas.Gupta and Gupta (2005); Dubey et al. (2006); Gupta et al. (2002) Amorphous phases of FeN were obtained in nitrogen poor as well as nitrogen rich phases. Gupta and Gupta (2005); Dubey et al. (2006); Gupta et al. (2002) The nitrogen poor amorphous phases produced using this method were not stable beyond a temperature of 523 K and undergo crystallization when heated above this temperature. Within the amorphous phase conventional amorphous alloys are known to undergo structural relaxation.
In an earlier work, iron diffusion in nitrogen rich amorphous FeN alloy produced using ion beam sputtering technique was studied and it was found that Fe diffusion demonstrates strong relaxation effects similar to a metal-metalloid system. Gupta et al. (2002) Structurally, the nitrogen rich and the nitrogen poor FeN phases are different though in both the cases they are amorphous. The broad diffuse maxima in case of nitrogen poor amorphous FeN appears around the same position as in case of bcc-Fe (2 44 ∘, with 1.54 Å x-rays), whereas in case of nitrogen rich amorphous FeN the position of this diffuse maximum appears at much lower angle (2 37 ∘, with 1.54 Å x-rays). This indicates that structurally nitrogen rich and nitrogen poor phases are very different. Further in case of nitrogen poor FeN phases nitrogen predominately occupies interstitial positions and in case of nitrogen rich FeN phases covalent bonds between Fe and N are formed. In order to study the phenomenon of structural relaxation and self-diffusion in the system it is desirable to study both Fe as well as N self-diffusion.
In this work we have studied both Fe and N self-diffusion and relaxation using SIMS and Fe diffusion using NR technique. Simultaneous measurement of Fe and N self-diffusion in FeN are not reported previously to the best of our knowledge. However such measurements in a different class of material (Si3N4) exist. Schmidt et al. (2006, 2008) While SIMS is an established technique for measuring self-diffusion, neutron reflectometry is an emerging technique and is of special interests to measure small diffusion lengths. The depth resolution available with SIMS is of the order of 5 nm where as NR gives a depth resolution as low as 0.1 nm. Therefore SIMS is best suited when involved diffusion lengths are large while information about small diffusion lengths could only be obtained using NR. In this work we have used both techniques in a complementary way. Stable isotopes of Fe and N namely 57Fe and 15N provide a very good contrast as compared to their natural abundances with SIMS technique. Also, Fe and 57Fe have very good contrast for neutrons. The neutron coherent scattering length (SL) for natural Fe is 9.45 fm while for 57Fe is 2.3 fm. The neutron SL for natural N and 15N is 9.36 fm and 6.44 fm, respectively. Given the low concentration of nitrogen in nitrogen poor phases (14%) and low contrast between N and 15N for neutrons, N self-diffusion measurements with NR could not be performed.
II Experimental
Iron nitride thin films were prepared using a dc-magnetron sputtering technique. A trilayer sample with nominal structure of Si (100) /FeN(120 nm)/57Fe15N(9 nm)/FeN(120 nm) was deposited at room temperature (without intentional heating) for SIMS measurements. The samples were deposited using a mixture of Ar and N as sputtering gases with a ratio of 9:1, respectively. The total gas flow was kept at 30 cm3/min. To deposit the isotope marker layer of 57Fe15N the 57Fe foil was sputtered with a mixture of Ar and 15N gases while for depositing FeN layer, natural iron target was sputtered with a mixture of Ar and natural nitrogen gases. In order to minimize intermixing of natural and 15N gases, a residual gas analyzer (RGA) was installed in the sputtering system. After the deposition with natural nitrogen gas, the system was pumped down while monitoring the presence of the residual gases. When the pressure of the natural nitrogen reached to a minimum in RGA, 15N gas was allowed to flow in the chamber. Similarly for the next layer with natural nitrogen, 15N gas was allowed to pump down. The deposition of the film was carried out after obtaining a base pressure better than 110-6 mbar. During the deposition the pressure in the chamber was 510-3 mbar. The sample was deposited at a constant sputtering power of 50 W. Before deposition the vacuum chamber was repeatedly flushed with Ar gas so as to minimize the contamination of the remaining gases present in the chamber. The targets were pre-sputtered for about 5 minutes in order to remove possible surface contaminations. Similarly, Si(100)[FeN (22 nm)/57FeN (8 nm)]10 multilayers were deposited for NR measurements. In this case natural N and 15N gases and natural Fe and 57Fe targets were alternatively sputtered to prepare the multilayer with 10 periods. All other deposition parameters were kept identical as they were in case of the trilayer sample.
The structural characterizations of the samples were carried out with x-ray reflectivity (XRR) and grazing incidence diffraction (GIXRD) using a standard x-ray diffractometer with Cu K- x-rays. The microstructure of the films were obtained using transmission electron microscopy (TEM) in the planar mode. For this purpose a thin film of about 70 nm thickness was specially coated directly on to the carbon coated TEM grid. The deposition conditions for this sample were kept similar as described earlier in this section. The TEM measurements were performed at room temperature as well as at high temperatures using an insitu heater inside the sample space of the TEM. The composition of the film is obtained from x-ray photoemission spectroscopy (XPS). The XPS spectrum was collected using Al K- radiation of 1486.6 eV. The base pressure in the chamber during the measurement was better than 210-9 mbar. Before recording the XPS patterns, the sample was sputtered with 4 KeV Ar+ ions for 120 minutes with a very small ion current of 10-15 A in order to remove the surface contamination without changing the composition of the sample. The annealing of the samples for diffusion measurements were performed in a vacuum furnace with a base vacuum better than 110-6 mbar. The temperature in the furnace was controlled with an accuracy of 1 K.
For diffusion measurements the concentration depth profile was measured by a secondary ion mass spectrometer (SIMS) CAMECA-IMS5F. The Primary ions used for sputtering were Cs+ ions of energy 4 KeV and the ion current was about 30 nA. The secondary ions were detected by a double focusing magnetic mass spectrometer. Neutron reflectivity measurements were performed at AMOR reflectometer at the Swiss spallation neutron source (SINQ), at Paul Scherrer Institute, Switzerland. Gupta et al. (2004a) The reflectivity pattern was measured using different angular settings in the time-of-flight mode.
III Results
III.1 Structures and Composition
The samples under investigation in this study are a trilayer (TL) and a multilayer (ML) sample. The nominal composition of these are as follows:
TL: Si(substrate)/FeN (90 nm)/57Fe15N (9 nm)/FeN (90 nm)
ML: Si(substrate)/[FeN (22 nm)/57FeN (8 nm)]10
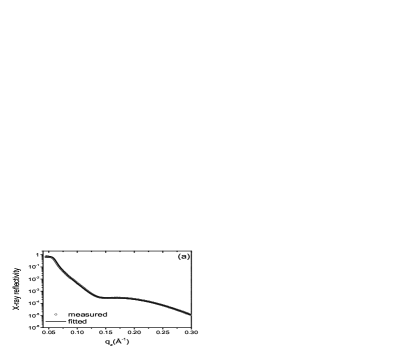
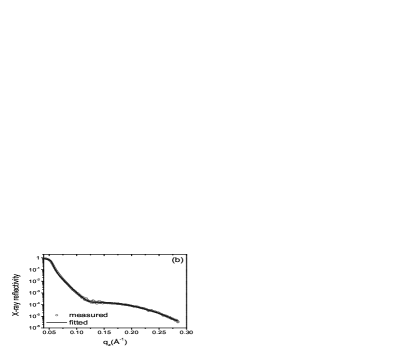
In both cases the chemical composition of FeN is the same and both samples were prepared under identical condition of sputtering as described in the previous section. In both samples, first x-ray reflectivity (XRR) measurements were performed to cross check the chemical composition. In case the composition of natural and isotope layers is not the same, it would result in some structure in XRR pattern due to a difference in scattering contrast. Fig. 1 shows the XRR pattern samples. As can be seen from the figure the decay of the XRR intensity is ‘smooth’ and does not show any dominant feature. A diffuse maxima centered around 0.17 Å-1, observed in the pattern is due to the formation of a oxide layer (about 3 nm) at the surface of the film. The feature-less pattern analogous to a single layer confirms the chemical homogeneity of the samples and rules out any variation in electron density being caused while switching to 57Fe target from natural Fe and co-sputtering with mixture of 15N and Ar gases during deposition of the isotopic marker layer. Since the thickness of the sample being large the total thickness oscillations could not be resolved due to limited instrument resolution of the x-ray reflectometer. Total thickness of the film (for TL sample) has been determined with the known sputtering rate (calibrated for a thin film using XRR) and cross-checked by measuring the depth of the crater formed after SIMS measurements with DEKTEK depth profilometer. The total thickness of the TL sample was found to be 190 nm. Accordingly, the actual structure of the film is Si (substrate)/FeN (91.5 nm)/57Fe15N (7 nm)/FeN (91.5 nm).
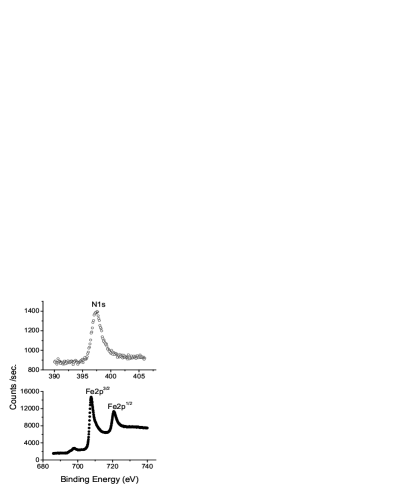
The chemical composition of the samples was obtained using XPS. The binding energy of Fe2p3/2, Fe2p1/2 and N1s core level corresponds to that of FeN as shown in Fig. 2. The stoichiometry of the film as obtained from the XPS data is Fe86N14. A small amount of oxygen is also detected which was also seen from XRR measurements at the surface of the films. Presence of this oxygen is due to absorbed oxygen from the atmosphere due to exposure of the samples to the environment.

The structure of the sample was determined using XRD in the as-deposited state and after annealing the sample at different temperature. The XRD pattern of the as-deposited film as well as the film annealed isochronally at different temperatures for 1 hour is shown in Fig. 3. The broad diffuse maxima at 2=44∘, characteristic of an amorphous -Fe phase is clearly visible. This corresponds to an average Fe-Fe nearest neighbor distance =2.5Å, Guinier (1994) where is the wavelength of x-rays (1.54 Å) and is the mean position where the diffuse maxima occurs. The obtained value corresponds to that generally observed in transition metal-metalloid (TM-) glasses having a composition around the eutectic phase. The crystallization behavior of the film was studied by isochronal annealing of the film at different temperatures. Gupta and Gupta (2005) From the figure it can be seen that there is no appreciable change in the XRD pattern up to a temperature of 523 K. This indicates that the amorphous phase is stable at least up to 523 K. Annealing the film at 573 K for 1 hour causes crystallization and the phase formed is identified as -Fe2N. Further annealing at 623 K for 1 hour causes the formation of mixed phases, which is identified as -Fe2N and -Fe16N2. Thus from XRD it can be concluded that the system remain in amorphous state after annealing up to a temperature of 523 K. Therefore for self-diffusion measurements we choose 498 K as an upper limit of annealing temperature. It was found that even after the highest diffusion annealing temperature (i.e. 498 K) and time the film remained in the amorphous state.
III.2 Microstructure of FeN films
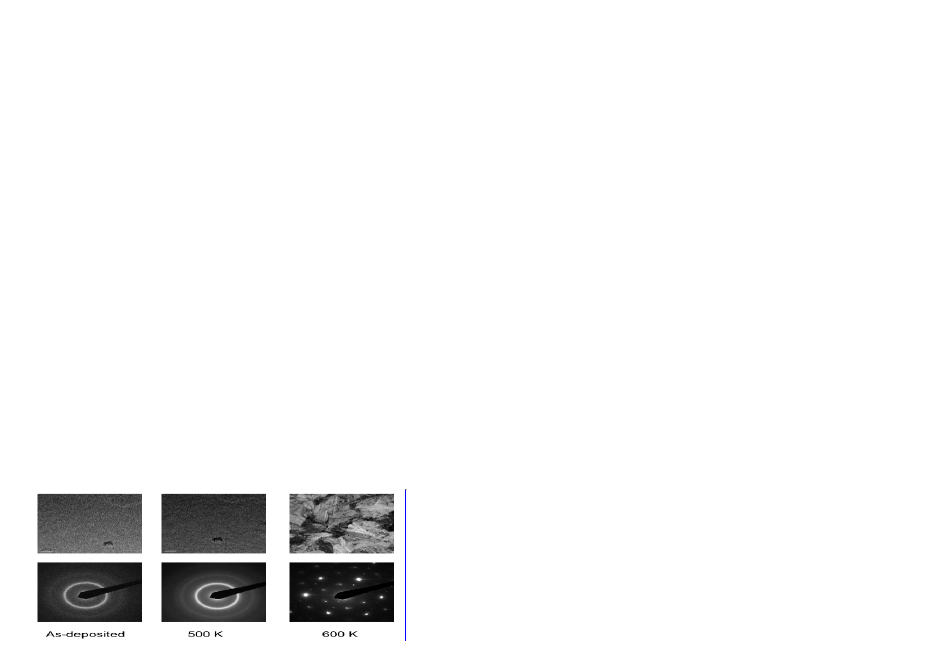
The microstructure of the FeN film was investigated using TEM measurements and shown in Fig. 4. As mentioned earlier, for the TEM measurements a thin film of 70 nm thickness was directly deposited on a carbon coated TEM grid. The deposition conditions for these films were kept identical to TL or ML samples. In addition to TEM grid a sample was also deposited on a Si wafer kept besides the grid. The thickness of the film coated on Si substrate was measured using XRR and found to be 70 nm. XRD measurements of this film were also carried out and found similar to that of TL or ML samples. It was found that the TEM micrograph did not show the presence of grain or grain like structures and the diffraction pattern showed diffuse rings indicating an amorphous nature of the films. The samples were heated using a heater and images were recorded insitu at different temperatures. Up to a temperature of 498 K, there was no appreciable change in the micrograph and diffraction pattern. However after heating at 600 K, the grains due to crystallization of the amorphous phase appear and diffraction pattern showing spots due to crystalline structure can be seen. The TEM measurements were found in good agreement with XRD results described earlier.
III.3 Diffusion measurements with SIMS
With the structural, composition and microstructural characterization of FeN films available, the thermal stability of the films is known. Above a temperature of 523 K, crystallization of the films starts. Therefore for diffusion measurements a temperature of 498 K was chosen as a maximum temperature so that diffusivity could be measured in the amorphous phase. In this section results obtained on TL samples (Si /FeN (91.5 nm)/57Fe15N (7 nm)/FeN (91.5 nm)) using SIMS are presented. Since both 57Fe and 15N are present as the marker layer, depth profiling of 57Fe and 15N is expected to peak at a position where marker layer is sandwiched.
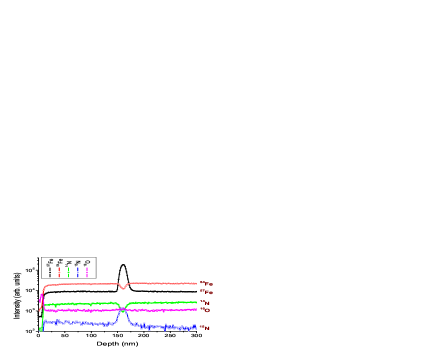
Fig. 5 shows SIMS depth profiles of 57Fe, 54Fe, 15N, 14N and 16O in the as-deposited film. At the position of the marker layer both 57Fe and 15N show a peak while the concentration of 54Fe and 14N shows a dip. The depth profile of 16O remains at a constant level throughout the depth of the film. A closer look at the depth profile of 57Fe and 15N reveals that the peaks are some what skewed towards higher sputtering time or larger depths. Such an asymmetry in the depth profiles is due to radiation damage and small intermixing induced by the 4 keV Cs+ ions used for sputtering the samples. A correction for this irradiation broadening of the profiles is applied to the primary concentration profiles. The concentration profiles are corrected to yield the true ones according to the following equationBrebee et al. (1980); Loirat et al. (2000)
| (1) |
Where and are the experimentally determined and true profiles, respectively, and is a parameter that represents the strength of intermixing due to Cs+ ion bombardment. The value of was determined by applying this correction on the as-deposited samples with known concentration profile. The same value of was used for correcting the depth profiles of the samples annealed for different periods of time.
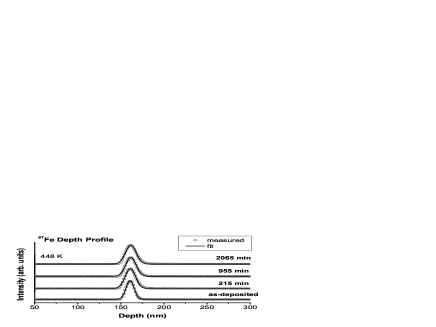
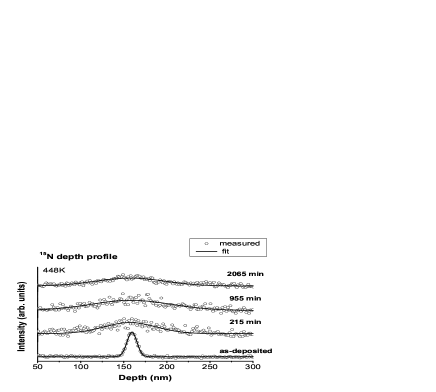
For studying the self-diffusion of iron and nitrogen from the diffusion mediated broadening of the depth profiles of 57Fe and 15N respectively, isothermal annealing of the film was performed at temperatures 448 K and 498 K for different times. A typical broadening of the depth profile of 57Fe and 15N as a function of annealing time at 448 K is shown in Fig. 6 and Fig. 7, respectively. The profiles have already been corrected for the Cs+ ion irradiation broadening. It may be observed clearly from Fig. 6 and Fig. 7 that the diffusion mediated broadening in the 15N profile is several times larger as compared to the 57Fe profile, which indicates that in this system nitrogen diffuses several times faster than iron.
In the present case, the thin film solution to Fick’s law can be applied and the tracer concentration of 57Fe or 15N as a function of penetration depth is given byShewmon (1963)
| (2) |
where is the time for annealing and is the diffusion coefficient. Accordingly, the profiles were fitted to a Gaussian and the time averaged diffusion coefficients were calculated using the following equation Loirat et al. (2000)
| (3) |
where is time averaged diffusivity and is the standard deviation of the gaussian depth profile obtained after an annealing time of t and is the standard deviation of as-deposited sample .
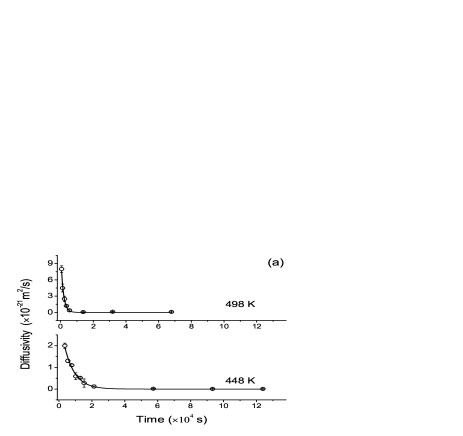
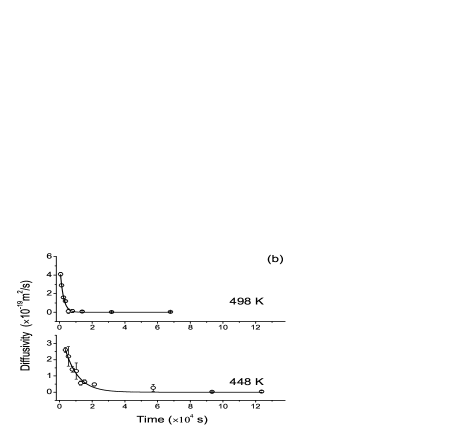
In order to study the time variation of the diffusion coefficient, diffusion measurements were carried out in the unrelaxed samples by varying the annealing time at 448 K and 498 K. Fig. 8 shows obtained diffusivity as a function of annealing time at these temperatures. As could be followed from the figure, at the initial annealing time, the diffusivity decays rapidly and becomes almost constant towards higher annealing times. Such an annealing time dependence of the diffusion coefficient is well known and attributed to structural relaxation in the film. Loirat et al. (2000); Tyagi et al. (1991)
The observed time dependence of the diffusivity was fitted using an exponential law for the relaxation and is given by Loirat et al. (2000)
| (4) |
Here is the diffusivity in the structurally relaxed state and is a constant. gives the diffusivity at the initial time , and is the structural relaxation time. The solid line as shown in Fig. 8, gives a fit of the measured data, yielding the value of , and diffusivity in the structurally relaxed state . As could be seen from the figure, Fe diffusivity is about 2 orders of magnitude slower as compared to that of N at both the measured temperatures. The relaxation times for Fe and N self-diffusion at 448 K and 498 K are given in table 1. As could be seen from the table the relaxation time in the two cases are comparable although the value of diffusivity are different by about 2 orders of magnitude for Fe and N self-diffusion.
| Temperature | ||
|---|---|---|
| (K) | (s) | (s) |
| 448 | 6252450 | 7964880 |
| 498 | 1509256 | 2013156 |
The value of comes out to be zero within the experimental errors. This indicates that the absolute values of diffusivity in the relaxed state are below the sensitivity of the SIMS technique. Due to this reason we used neutron reflectivity technique to measure the diffusivity of Fe in the relaxed state. As mentioned already neutron reflectivity is a technique much better applicable to measure small diffusion lengths due to a much better depth resolution.
III.4 Diffusion measurements with NR
Fe self-diffusivity in amorphous FeN was also measured using neutron reflectivity. Neutron reflectivity, in particular, is useful at low temperatures where diffusion distances are small and can not be measured using SIMS depth profiling due to the limited depth resolution. The depth resolution available with NR is of the order of 0.1 nm while that with SIMS is in excess of 5 nm. Gupta et al. (2004b) One may also note that the value of diffusivity for iron and nitrogen self diffusion in structurally relaxed state is zero for both temperatures, which essentially shows that the technique of SIMS is not sensitive enough to determine such low diffusivities. This also points out the importance of neutron reflectivity measurements which have a much higher sensitivity.
Since the samples under investigation in this study is nitrogen poor (Fe86N14) and due to poor contrast between natural N and 15N neutron scattering length (9.36 fm and 6.6 fm) N self-diffusion using NR could not be studied. However measurements of Fe diffusivity at low temperature would give additional information about diffusion mechanism in this system. As mentioned already NR measurement were performed on the ML sample (Si(substrate)/[FeN (22 nm)/57FeN (8 nm)]10).
NR measurements on the ML samples yield Bragg peaks due to 57Fe periodicity. The inset of Fig. 9 shows a typical NR pattern obtained from such multilayers. It may be noted that since FeN at this composition is magnetic, unpolarized NR measurements yield critical edges due to reflection from domains parallel to net magnetization of the samples and anti-parallel to the direction of net magnetic moment. This effects results in two critical edges and splitting of the Bragg peaks at lower qz values , here is momentum transfer and is the wavelength of the used radiation. However such splitting of the Bragg peak is reduced at higher values. In the present study, second order Bragg reflection occurring around = 0.048 Å-1 was used to measure Fe self-diffusion. The measurements were performed using time of flight (ToF) mode and the angle of incidence kept at 0.6∘ and 1.2∘ with wavelength of incoming neutrons between 2 Å-10 Å.
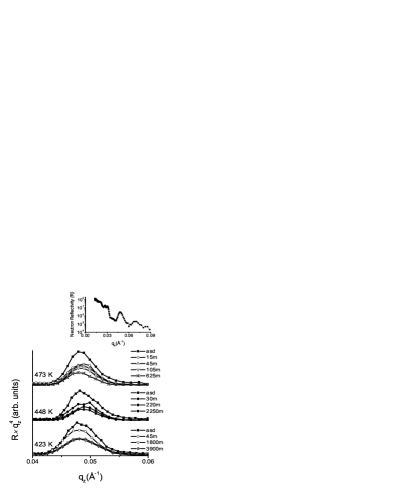
As the ML is annealed the intensity at the Bragg peak decays due to diffusion. The decay of the Bragg peak intensity can be used to calculate the diffusion coefficient using the expression Rosenblum et al. (1980); Speakman et al. (1996)
| (5) |
where is the intensity before annealing and is the intensity after annealing time at temperature T, is the bilayer periodicity is the order of reflection. The obtained diffusivity using eq 5 are plotted in Fig. 10. Similar to results obtained using SIMS, Fe diffusivity shows relaxation behavior. The diffusivity in the structurally relaxed state are obtained using eq 4.

IV Discussions
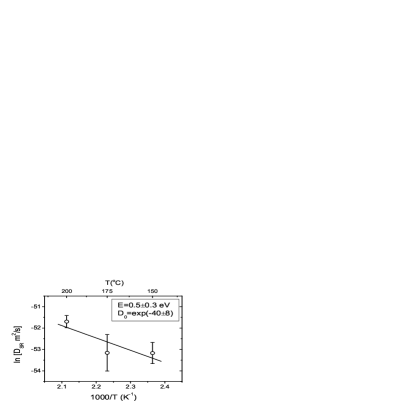
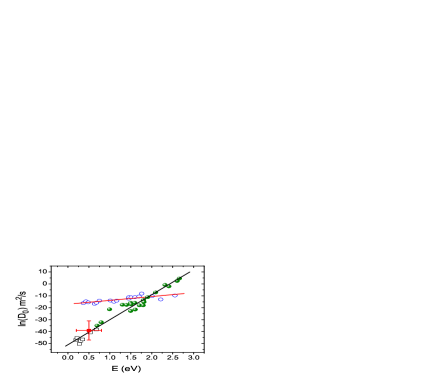
The results of Fe diffusion using SIMS and NR show relaxation behavior. Also, N diffusion measured using SIMS show structural relaxation. A plot of Fe diffusivity in the relaxed state obtained using neutron reflectivity as a function of inverse of temperature is shown in Fig. 11. A straight line fitting of the experimental data using the expression , where is pre-exponential factor, is activation energy, and is Boltzmann’s constant, yields the values of and , which are 0.50.3 eV and exp(-408). It would be interesting to compare the values of and obtained in the present case with that for conventional amorphous alloys. It is known that a correlation exits between and , which is universally followed in crystalline as well as amorphous alloys, signifying the involved diffusion mechanism. Faupel et al. (2003) Putting together the values obtained in literature for bulk and conventional amorphous alloys with the values obtained in the present case, it could be seen from the Fig. 12 that values obtained in the present case goes well with the line obtained from literature data. The relationship between and is known as isokinetic relation and is given by Linert (1989)
| (6) |
where and are constants. As mentioned, this relationship was found to be valid not only in amorphous alloys but also for self and impurity diffusion in crystalline alloys involving both substitutional and interstitial solid solutions. Though the values of fitting constants and were found to be very different in amorphous and crystalline alloys. In case of amorphous alloys typical values of and are 10-20 m2/s and 0.055 eV, respectively while in case of crystalline alloys these are 10-7 m2/s and 0.41 eV, respectively. Putting together the values of D0 and E in the present case, the values of constant and in the present case are 1.410-22 m2/s and 0.05 eV, respectively, which are very close to the values obtained for bulk and conventional amorphous alloys. This is very interesting and it suggests that even though the present system has much stronger covalent bonds between iron and nitrogen nevertheless the diffusion mechanism is very similar to that in other metallic glasses having metallic bonds. In other words, in the present system the diffusion mechanism is expected to be collective in nature involving many atoms diffusing together. It is known from Zener’s theory of the pre-exponential factor that the pre-exponential factor could be expressed asShewmon (1963); Faupel et al. (2003)
| (7) |
where is a geometric factor, the effective jump distance, the effective jump attempt frequency, the correlation factor, and the entropy of diffusion. Using eq 6, the values of constant and could be written as
| (8) |
With the known values of and , the values of entropy, for Fe diffusion is 10. The values of in amorphous alloys ranges from 19 to 56 while in crystalline alloys 2.5 to 7.5 Faupel et al. (2003). In case of inter-diffusion in multilayers the values of are found in the range of 8 to 15 Wang et al. (1999); Gupta et al. (2004b) which is very close to the value found for Fe diffusion in the present case.
Concerning N diffusion, it is very clear that N diffusion is faster compared to Fe diffusion. At this composition N occupies interstitial sites in the crystal structure of Fe. Gupta and Gupta (2005) It is well known that in the dense random packing model for the metallic glasses, the metal atoms form a dense random packing structure and the metalloid atoms occupy the interstitial sites in these structures. Polk (1972) It has been reported that TM-M systems have a high stability around a metalloid composition of 20%, as around this composition most of the interstitial sites are occupied by metalloid atoms. Polk (1972) In the present case the metalloid composition (i.e. nitrogen) is less than 20% and therefore lot of interstitial sites remains vacant. Thus, a very large number of vacant interstitial sites is available in the system, which acts as an easy path for metalloid atoms (i.e. nitrogen) to diffuse in the system. This might be the possible reason for fast nitrogen self-diffusion. On the other hand, the iron population in the system is very high and they are very densely packed and there is no easy way for iron to diffuse and also there is very least possibility of vacant space for iron to diffuse. In other words the potential barrier around iron atoms is very high and to overcome this barrier it needs a very high energy. This might be to be the reason for the lower diffusion of Fe as compared to N in the present system.
Looking further at Fig. 8, it is interesting to note that although the diffusivity of Fe and N defer by orders of magnitude, the relaxation time in the two cases are comparable. It may be noted that diffusivity in the amorphous materials decreases with annealing time essentially because of structural relaxation.With thermal annealing the amorphous structure evolves towards the more stable state with lower free energy. This involves annihilation of quenched-in excess free volume as well as topological relaxation of the structure. Loirat et al. (2000); Franck (1997) This structural relaxation would affect the diffusivity of both Fe and N atoms. Thus the relaxation time obtained from the diffusivity measurements essentially pertains to the structural relaxation of the amorphous phase. And therefore, relaxation times as obtained from Fe diffusion as well as N diffusion should be comparable.
V Conclusion
In conclusion, the self-diffusion of Fe and N in an amorphous Fe85N15 alloy has been studied. The Fe diffusion over a wide temperature range has been studied by combining neutron reflectivity and SIMS techniques while N diffusion was measured using SIMS. In case of Fe diffusion the observed relations between activation energy and the pre-exponent factor suggest a diffusion mechanism involving a large group of atoms, similar to other metal-metalloid and metal-metal alloys. N diffusivity is found to be several orders of magnitude higher as compared to that of Fe. This may be attributed to a diffusion mechanism for N atoms involving jumps through the vacant interstitial sites in the Fe network. Despite a large difference in the values of Fe and N diffusivities, the relaxation time for the decay of diffusivity with annealing time comes out to be same in the two cases, suggesting that the structural relaxation in the amorphous phase effects from the diffusion of both Fe and N in a similar manner.
ACKNOWLEDGEMENT
A part of this work was performed at the Swiss Spallation Neutron Source, Paul Scherrer Institute, Villigen, Switzerland. Partial support from Indo-French Center for Promotion of Advanced Research is acknowledged. Thanks are due to Y. L. Chiu for the help provided in TEM measurements.
References
- Wang et al. (2004) X. Wang, W. Zheng, H. Tian, S. Yu, and L. Wang, J. Mgan. Magn. Mat. 283, 282 (2004).
- Wei et al. (1991) R. Wei, P. J. Wilbur, O. Ozturk, and D. L. Williamson, Nuc. Instrum. Methods Phys. Res. Sect. B 56/60, 731 (1991).
- de Wit et al. (1994) L. de Wit, T. Weber, J. S. Custer, and F. W. Saris, Phys. Rev. Lett. 72, 3835 (1994).
- Gupta and Gupta (2005) R. Gupta and M. Gupta, Phys. Rev. B 72, 024202 (2005).
- Dubey et al. (2006) R. Dubey, A. Gupta, and J. C. Pivin, Phys. Rev. B 74, 214110 (2006).
- Gupta et al. (2002) M. Gupta, A. Gupta, S. Rajagopalan, and A. K. Tyagi, Phys. Rev. B 65, 214204 (2002).
- Schmidt et al. (2006) H. Schmidt, M. Gupta, and M. Bruns, Phys. Rev. Lett. 96, 055901 (2006).
- Schmidt et al. (2008) H. Schmidt, M. Gupta, T. Gutberlet, J. Stahn, and M. Bruns, Acta Mater. 56, 464 (2008).
- Gupta et al. (2004a) M. Gupta, T. Gutberlet, J. Stahn, P. Keller, and D. Clemens, Pramana J. Phys. 63, 57 (2004a).
- Guinier (1994) A. Guinier, X-Ray Diffraction : In Crystals, Imperfect Crystals and Amorphous Bodies (Dover, New York, 1994).
- Brebee et al. (1980) G. Brebee, R. Seguin, C. Sella, J. Bevenot, and J. C. Martin, Acta Metall. 28, 327 (1980).
- Loirat et al. (2000) Y. Loirat, J. L. Boequet, and Y. Limoge, J. Non-Cryst. Solids 265, 252 (2000).
- Shewmon (1963) P. G. Shewmon, Diffusion in Solids (McGraw-Hill, New York, 1963).
- Tyagi et al. (1991) A. K. Tyagi, M. P. Macht, and V. Naundorf, Acta Metall. Mater. 39, 609 (1991).
- Gupta et al. (2004b) M. Gupta, A. Gupta, J. Stahn, M. Horisberger, T. Gutberlet, and P. Allenspach, Phys. Rev. B 70, 184206 (2004b).
- Rosenblum et al. (1980) M. P. Rosenblum, F. Spaepen, and D. Turnbull, Appl. Phys. Lett. 37, 184 (1980).
- Speakman et al. (1996) J. Speakman, P. Rose, J. A. Hunt, N. Cowlam, R. E. Somekh, and A. L. Greer, J. Magn. Magn. Mat. 156, 411 (1996).
- Wang et al. (1999) W.-H. Wang, H. Y. Bai, M. Zhang, J. H. Zhao, X. Y. Zhang, and W. K. Wang, Phys. Rev. B 59, 10811 (1999).
- Utzig (1997) J. Utzig, J. Appl. Phys. 65, 3638 (1997).
- Horvath (1990) J. Horvath, Diffusion in Solid Metals and Alloys (Landoldt-Boernstein, New Series, Group III, Vol. 26, Edited by H. Mehrer, Springer, Berlin, p. 437, 1990).
- Sharma et al. (1992a) S. K. Sharma, M. P. Macht, and V. Naundorf, Acta Metall. Mater. 40, 2439 (1992a).
- Sharma et al. (1989) S. K. Sharma, S. Banerjee, K. Jain, and A. K. Jain, J. Mater. Res. 4, 603 (1989).
- Sharma et al. (1992b) S. K. Sharma, M. P. Macht, and V. Naundorf, Phys. Rev. B 46, 3147 (1992b).
- Kronmueller and Frank (1992) H. Kronmueller and W. Frank, Radiat. Eff. Defects Solids 108, 81 (1992).
- Limoge (1997) Y. Limoge, Mater. Sci. Eng. A 226-228, 228 (1997).
- Schober and Laird (1991) H. R. Schober and B. B. Laird, Phys. Rev. B 44, 6746 (1991).
- Faupel et al. (2003) F. Faupel, W. Frank, M. P. Macht, H. Mehrer, K. Rätzke, H. Schober, S. K. Sharma, and H. Teichler, Rev. Mod. Phys. 75, 237 (2003).
- Linert (1989) W. Linert, Chem. Soc. Rev. 18, 477 (1989).
- Polk (1972) D. E. Polk, Acta Metall. 40, 485 (1972).
- Franck (1997) W. Franck, Def. Diffus. Forum 143-147, 695 (1997).