The measurement of at CLEO
Abstract
Measurements of the total cross section of are presented in two different ranges of centre-of-mass energy. The measurements are made using the CLEO III and CLEO-c detectors at the Cornell Electron Storage Ring. The absolute cross sections and the values of , the ratio of hadronic to muon pair production cross sections, are determined at seven centre-of-mass energies between 6.964 and 10.538 GeV. The total cross sections and values of are also determined at thirteen centre-of-mass energies between 3.97 and 4.26 GeV; in addition, the inclusive and exclusive cross sections for , and production are presented. Furthermore, for the lower centre-of-mass energy range, exclusive cross-sections are presented for final states consisting of two charm mesons: , , , , , , , and .
1 Introduction
The determination of , the ratio of the radiation-corrected hadronic cross section to the calculated lowest-order cross section for muon pair production is presented in two ranges of centre-of-mass energy, . The motivation for these studies is different in the two ranges.
The measurements of at seven values of between 6.964 and 10.538 GeV test the asymptotic freedom of the QCD coupling in the range of where , , and , quarks are produced. The values of are extracted by comparing the measurements of to a perturbative QCD calculation at the four-loop level [1].
Measurements of in the region just above the threshold ( to 4.260 GeV) exhibit a rich structure (for example see Ref. [2]); this reflects the production of resonances. Interesting features include an enhancement at threshold and a broad plateau beginning at the threshold . There is considerable theoretical interest in the composition of these enhancements [3]. However, there is limited experimental information available which motivates the exclusive cross sections presented in this paper. The following final states are considered: , , , , , and , and . The total cross sections and values of are also determined at the thirteen points studies.
2 CLEO III and CLEO-c
All measurements presented are made with data collected at the Cornell Electron Storage Ring (CESR). The CLEO III detector [6] is used to study the data with . The CLEO-c detector [7] is used to study the data around threshold. The principal differences between the CLEO III and CLEO-c detectors are the reduction in solenoid field from 1.5 to 1.0 T and the replacement of CLEO III’s four-layer silicon-strip detector by a six-layer all-stereo inner drift chamber. These modifications improve the reconstruction of low momentum charged particles.
3 Measurements of at
| (GeV) | ||
|---|---|---|
| 10.538 | ||
| 10.330 | ||
| 9.996 | ||
| 9.432 | ||
| 8.380 | ||
| 7.380 | ||
| 6.964 |
The values of and integrated luminosities, , for each data point are given in Table 1. Hadronic events are selected from these data by placing criteria on individual tracks and showers, as well as the whole event.
Tracks used in the analysis are required to be of good quality, originate from close to the interaction point and have a momentum between 1 and 150% of the beam momentum. Showers must have at least 1% of the beam momentum and not be associated with a track.
Several event variables are used to discriminate against background. The average point of origin of all tracks along the beam direction is used to reject beam-gas, beam-wall and cosmic ray events. The total visible energy normalised to twice the beam energy and the missing momentum in the beam direction normalised to the visible energy are used to remove two-photon and beam-gas events. Each event must contain at least four charged tracks and pass an event shape criteria to reject events. The ratio of total calorimeter energy associated to tracks and isolated showers normalised to twice the beam energy is used to reject Bhabha and tau-pair events. Initial state radiation events are removed by a criterion on the ratio of the maximum isolated shower energy normalised to the beam energy.
The efficiency of the selection increases from 82.1% at to 87.4% at . The dominant background remaining after the event selection is from events, which is estimated from simulation. Other remaining backgrounds are estimated to give contributions smaller than the systematic uncertainty assigned to the event selection.
Radiative corrections must be applied to the measured total hadronic cross section to determine . Corrections are applied for soft photon radiation and vacuum polarisation. In addition, corrections are applied for hard initial state radiation to the continuum and lower mass resonances. Furthermore, at three energy points, a correction is applied for the interference between a nearby resonance and the continuum.
Several sources of significant systematic uncertainty are considered: luminosity, radiative corrections, multiplicity corrections and event selection criteria. The relative uncertainty on the luminosity is between 0.9% and 1.1% depending on . The uncertainty from the radiative corrections is dominated by those for the hadronic vacuum polarisation, which has an uncertainty of 1.0%. Some disagreement is found comparing the charged track multiplicity distribution in data and simulation. Therefore, the efficiency is determined as a function of multiplicity before applying to the data. This procedure is estimated to have an uncertainty between 0.4% and 1.4% depending on . The uncertainty related to other selection criteria is estimated to be between 1.0 and 1.4% depending on .
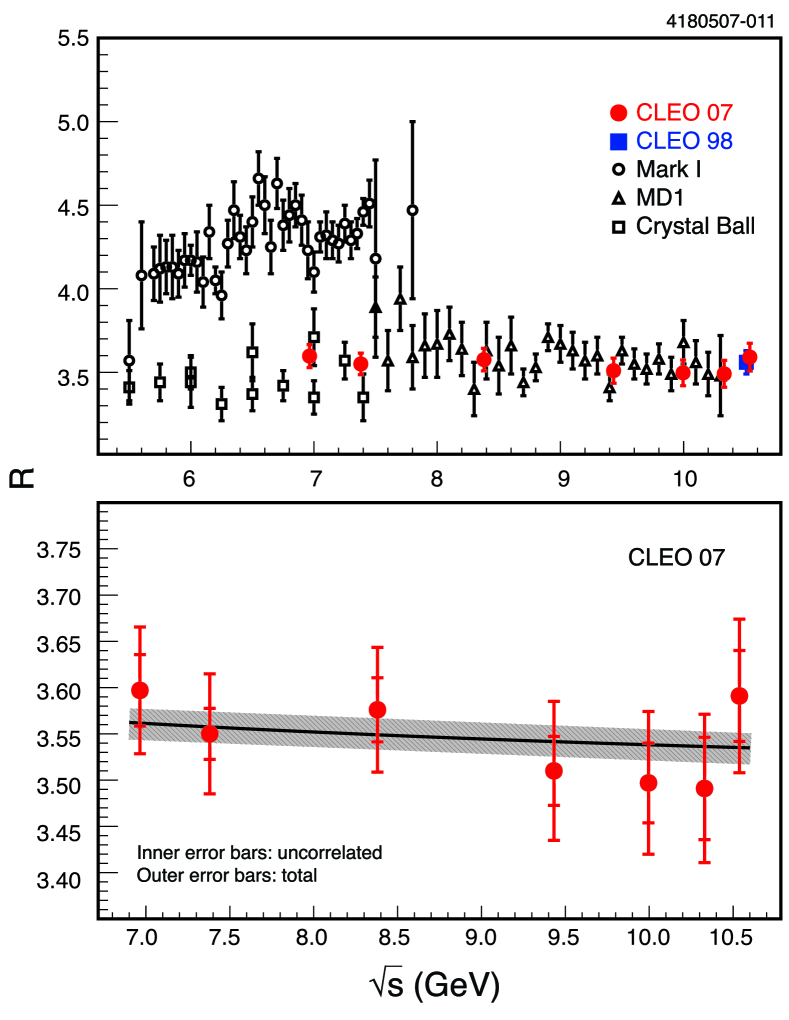
The measured values of are given in Table 1 along with the associated uncertainties. The total relative systematic uncertainty at each point is between 1.7 and 2.3%. The measured values are compared to previous measurements [8] in the upper plot in Figure 1. The measurements are in agreement with the results from Crystal Ball, MD1 and CLEO; however, they do not agree with the MARK I results.
The value of is determined at each point using a perturbative QCD calculation of at the four-loop level [1]. (This calculation ignores the quark masses; a determination including quark mass effects is presented in Ref. [9].) The compatibility of these measurements with others of is evaluated by exploiting the expected running of [10], which depends on the QCD scale . The measured values determine and , where the first uncertainties are statistical and the second systematic. These results agree with the world averages [11]. The lower plot in Figure 1 compares the measured values of to those predicted by the fitted value of .
4 Studies of exclusive charm and total cross sections at
Data collected at thirteen energy points between are studied.
Specific criteria are used to select , and candidates; these closely follow other CLEO-c analyses [12]. The final states with the largest signal-to-background ratio are considered for and . Eight decay modes are reconstructed to select candidates: , , , , , , and . These modes correspond to 16% of the total decay width.
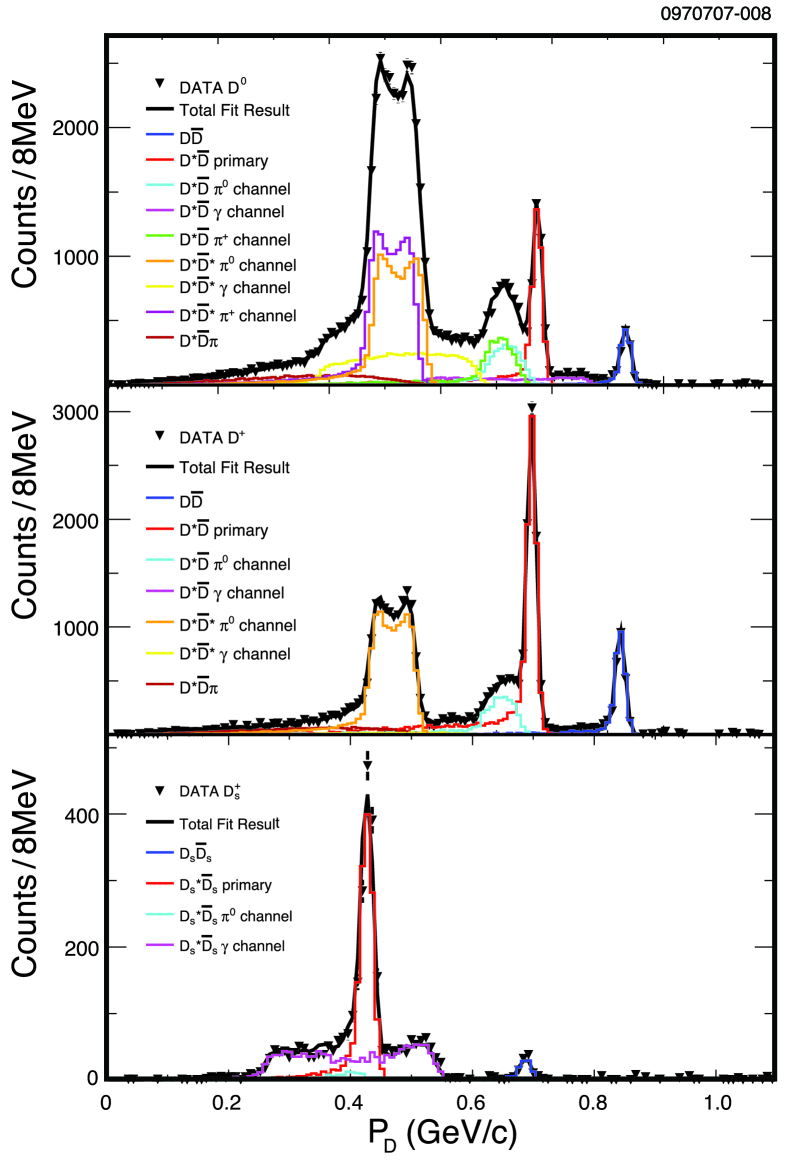
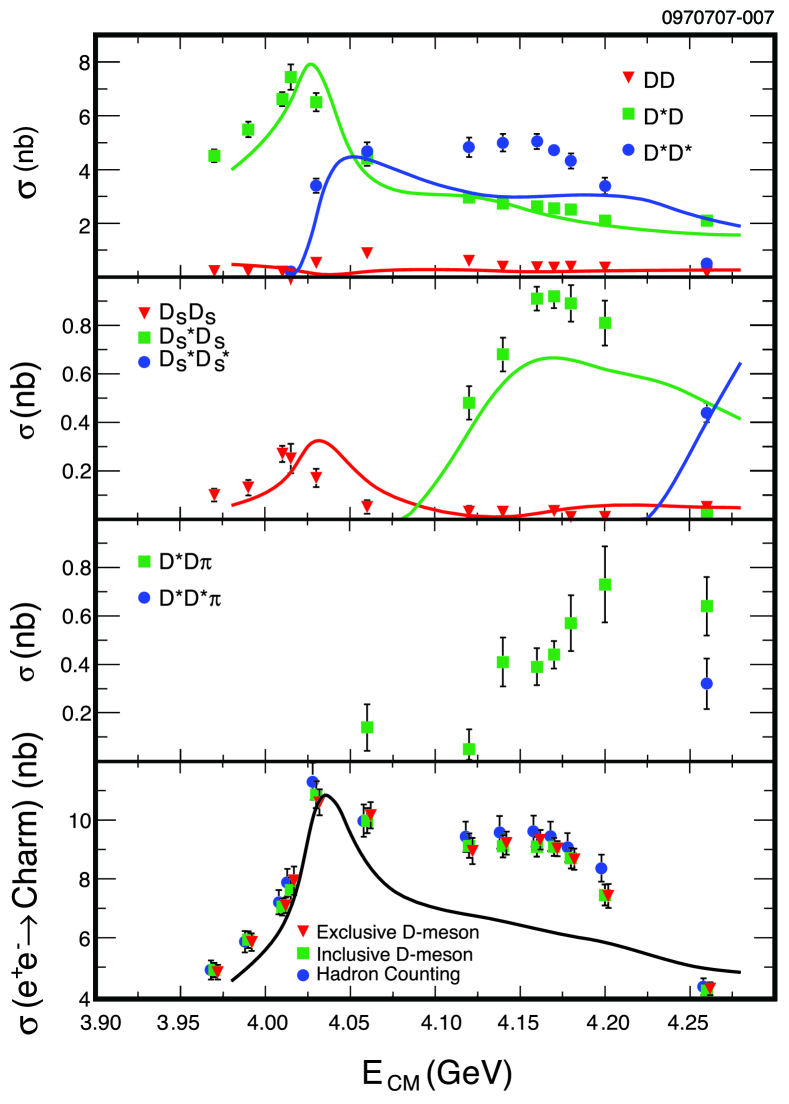
Candidates are selected if their mass lies within of the nominal values. Background is subtracted using yields measured in mass sidebands extrapolated into the signal region. The momentum distribution of the candidates is then used to determine the production mechanism. The , and momentum distribution at is shown in Figure 2. The different peaks correspond to different production mechanisms. The shape of distributions for the individual processes are determined from simulation. The data are fit to the different components to determine the yields. For and production these are then corrected for efficiency, branching ratios and luminosity to give the cross sections shown in the two upper plots in Figure 3. Two additional components describing multi-body production are required to describe the low momentum distribution at . This is the first observation of multi-body production in the charm threshold region.
Given the relative simplicity of the production and the limited statistics an alternative technique is used to determine the cross sections. The separation of the different mechanisms in the beam-energy difference and the beam-constrained mass plane is used. The background is subtracted using and sidebands. The resulting cross sections are shown in the upper middle plot in Figure 3.
The dominant sources of systematic uncertainty are the selection efficiency, yield determination and the normalisation. Details of the uncertainty on the selection efficiency can be found in Ref. [12]. The signal functions for the determination of and production mechanisms depend on the modelling of initial state radiation and the helicity amplitudes for ; variations of these models over a broad range of assumptions leads to the systematic uncertainty. Variations in the and selection criteria are used to estimate the uncertainty related to signal extraction in the modes. The uncertainty on the normalisation arises from that on the measured luminosity and the branching fractions of the modes reconstructed [13]. The total systematic uncertainties are between 3.4% and 6.8% for two-body production mechanisms; the multi-body production mechanisms and have systematic uncertainties of 12% and 25% uncertainties, respectively.
The results are compared to an updated calculation of Eichten et al. [14]. There is reasonable qualitative agreement for most two-body production mechanisms apart from production in the range 4.05 to 4.20 GeV.
The results at have the potential to study the nature of the . Hybrid charmonium [15] and tetraquark [16] interpretations suggest enhancements of some production mechanisms; no significant enhancements are observed disfavouring these models.
The sum of the exclusive cross sections should equal the total charm cross section. This has been tested with measurements using two inclusive techniques. The sum of inclusive cross-sections for single , and production divided by two is found to be in agreement with the total exclusive cross sections. In addition, the total hadronic cross section is determined in a manner similar to that described in Section 3. The light-quark production cross section is subtracted using measurements below threshold extrapolated with dependence. The total charm cross section from this method is found to be in agreement with the other two techniques. The cross sections determined by each method are compared to each other and a model in the lower plot of Figure 3.
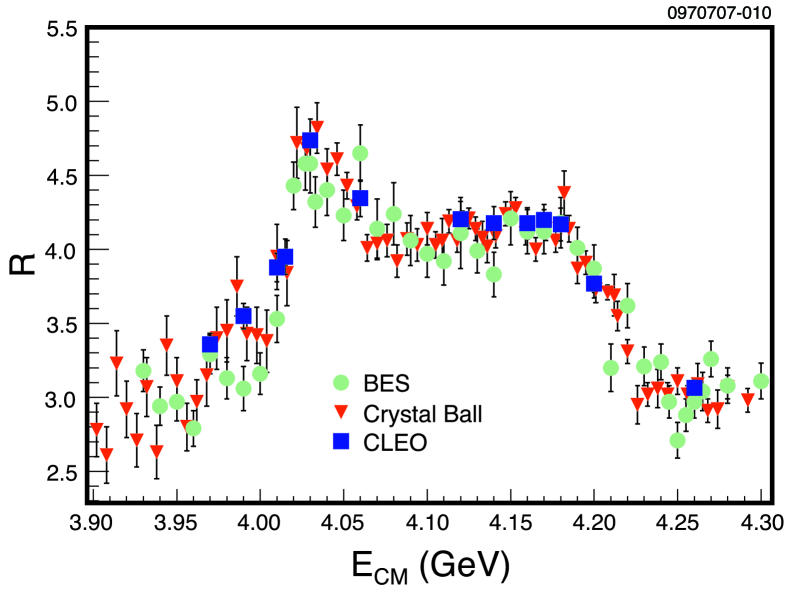
The total hadronic cross section is radiatively corrected [17] to obtain the measurements of , which is shown in Figure 4. These measurements are more precise and in good agreement with previous measurements [2, 18].
5 Conclusions
Seven measurements of in the range are used to determine a value of in agreement with the world average. The exclusive and inclusive charm cross sections are measured at thirteen values near threshold. Multi-body production is observed for the first time. All measurements of are more precise and in agreement with earlier measurements.
References
- [1] L. R. Surguladze and M. A. Samuel, Phys. Rev. Lett. 66, 560 (1991); S. G. Gorishny, A. L. Kataev and S. A. Larin, Phys. Lett. B 259, 144 (1991); M. Davier and A. Höcker, Phys. Lett. B 419, 419 (1998).
- [2] J. Z. Bai et al., Phys. Rev. Lett. 88, 101802 (2002).
- [3] T. Barnes, J. Phys. Conf. Ser. 9, 127 (2005); T. Barnes, arXiv:hep-ph/0406327; E. Eichten et al., Phys. Rev. D 21, 203 (1980); M. B. Voloshin, arXiv:hep-ph/0602233.
- [4] D. Besson et al., Phys. Rev. D 76, 072008 (2007).
- [5] D. Cronin-Hennessy et al., arXiv:0801.3418 [hep-ex].
- [6] G. Viehauser et al., Nucl. Instrum. Methods Phys. Res., Sect. A 462, 146 (2001).
- [7] R. A. Briere et al. (CESR-c and CLEO-c Taskforces, CLEO-c Collaboration), Cornell University, LEPP Report No. CLNS 01/1742 (2001) (unpublished).
- [8] J. L. Siegrist et al., Phys. Rev. D 26, 969 (1982); A. E. Blinov et al. Z. Phys. C 49, 239 (1991); A. E. Blinov et al. Z. Phys. C 70, 31 (1996);; Z. Jakubowski et al., Z. Phys. C 40, 49 (1988); C. Edwards et al., SLAC-PUB-5160 (1990); R. Ammar et al., Phys. Rev. D 57, 1350 (1998).
- [9] J. H. Kühn, M. Steinhauser and T. Teubner, arXiv:0707.2589 [hep-ph].
- [10] S. Eidelman et al., Phys. Lett. B 593, 1 (2004).
- [11] M. Bethke, Nucl. Phys. Proc. Suppl. 135, 345 (2004).
- [12] Q. He et al., Phys. Rev. Lett. 95, 121801 (2005) (Erratum-ibid. 96, 199903 (2006)); J. Alexander et al., arXiv:0801.0680 [hep-ex].
- [13] W.- M. Yao, et al., Journal of Physics G 33, 1 (2006).
- [14] E. Eichten,“New States above Charm Threshold,” talk presented at the International Workshop on Heavy Quarkonium, Brookhaven National Laboratory, June, 2006, and private communication.
- [15] F. E. Close and P. R. Page, Phys. Lett. B 628, 215 (2005).
- [16] D. Ebert, R. N. Faustov and V. O. Galkin, Phys. Lett. B 634, 214 (2006); L. Maiani, V. Riquer, F. Piccinini and A. D. Polosa, Phys. Rev. D 72, 031502(R) (2005).
- [17] E. A. Kuraev and V. S. Fadin, Sov. J. Nucl. Phys. 41, 466 (1985) (Yad. Fiz. 41, 733 (1985)).
- [18] A. Osterheld et al., SLAC-PUB-4160 (1986).