Flavour physics at CLEO-c
Abstract
Three CLEO-c results related to flavour-physics are presented: the determination of the strong-phase difference between and , , the measurement of the coherence parameter and average strong-phase difference between and and measurements of the variation of strong-phase difference between and decays to over phase space. All measurements are important for determining the unitarity triangle angle from decays. Furthermore, the measurement of is important for interpreting mixing.
1 Introduction
The precise determination of the unitarity triangle angle is a principal goal of flavour physics. In particular, measurements of from tree-level processes, which are insensitive to Beyond the Standard Model (BSM) physics, can be compared to measurements in loop processes, which are sensitive to virtual corrections from BSM physics. The current average of tree-level determinations of is [1]. The most precise determinations to date come from measurements of direct violation in , where the is a or decaying to the same final state. Determinations of from such measurements require knowledge of the strong decay parameters of the and , in particular the strong-phase differences.
Strong-phase differences and other important parameters of multi-body decay, relevant to measurements, can be studied in quantum-correlated pairs produced in collisions at a centre-of-mass energy equal to the mass. The charge-conjugation quantum number of the initial and final states is . Therefore, if one decays into a eigenstate such as this identifies the other to be in a state of opposite . The -tagged rates of decays are sensitive to the strong-phase differences required for measurements. Furthermore, using multi-body decays to determine requires knowledge of additional parameters related to the presence of intermediate resonances; these can also be determined from quantum-correlated -decay data.
Studies of decays at the are also sensitive to the mixing parameters as well as the strong-phase difference between doubly Cabbibo suppressed (DCS) and Cabbibo favoured (CF) decays , which is defined by the relation , where [2] is the absolute value of the amplitude ratio.
These proceedings describe three measurements by CLEO-c of quantum-correlated -decay. Section 2 describes the CLEO-c experiment and data sets used for the analyses. Section 3 presents a measurement of charm mixing parameters and . Sections 4 and 5 describe measurements of strong parameters related to measurements in the multi-body decays and , respectively.
2 CLEO-c
All measurements presented are made with data accumulated at the Cornell Electron Storage Ring (CESR). The CLEO-c detector is used to collect these data, which is described in detail elsewhere [3]. The total integrated luminosity of the data is , however, only have been used so far for the measurement of presented in Section 3.
3 Measurement of mixing and the strong-phase difference in
Charm mixing is described by two dimensionless parameters and , where and are the masses and widths, respectively, of the and neutral meson eigenstates and . Mixing has been probed in lifetime measurements to -eigenstates and in DCS decays.111For a review of charm mixing results see Ref. [4]. However, when measuring mixing with the DCS decay the quantities measured are and . Therefore, without a direct determination of it is impossible to combine or compare the determinations of from other measurements to those from . Furthermore, constraining is an important input to measuring from decays [5]; this method is discussed further in Section 4.
| Mode | Correlated branching fraction |
|---|---|
The first measurements of the parameters and in quantum-correlated data are presented; the method, which is known as The Quantum Correlated Analysis (TQCA), follows that described in Ref. [6]. The parameters are extracted by comparing the decay rates where either one (single-tagged) or both (double-tagged) neutral decays are reconstructed. The effective double-tagged rates for different final states are summarised in Table 1, where and are used to indicate eigenstates and semileptonic final states, respectively; some rates depend on the wrong-sign rate ratio, . The most striking consequences of the quantum correlations are the enhancements and suppression of the decaying to opposite and the same eigenstates, respectively.
| Type | Final states |
|---|---|
| Flavoured | , |
| , , , | |
| , , | |
| Inclusive , |
The analysis has been performed with of data [7]. The single and double-tag rates have been determined for the final states listed in Table 2. Hadronic final states without a are fully reconstructed via two kinematic variables: the beam-constrained candidate mass and , where is the beam energy, and are the candidate momentum and energy, respectively. The yields are extracted from the one or two dimensional distributions for single and double-tagged events, respectively. The reconstruction of events utilises the missing-mass technique described in Ref. [8]. The inclusive tags exploit electrons identified using a multivariate discriminant [9].
| Parameter | Standard fit | Extended fit |
|---|---|---|
| 0 (fixed) |
The standard fit to determine the mixing parameters and includes independent, external measurements of , and uncorrelated branching fractions. Additional external measurements of charm mixing are included in an extended fit which allows to also be determined. The fit accounts for correlations amongst the inputs and any cross-feed between the signal channels.
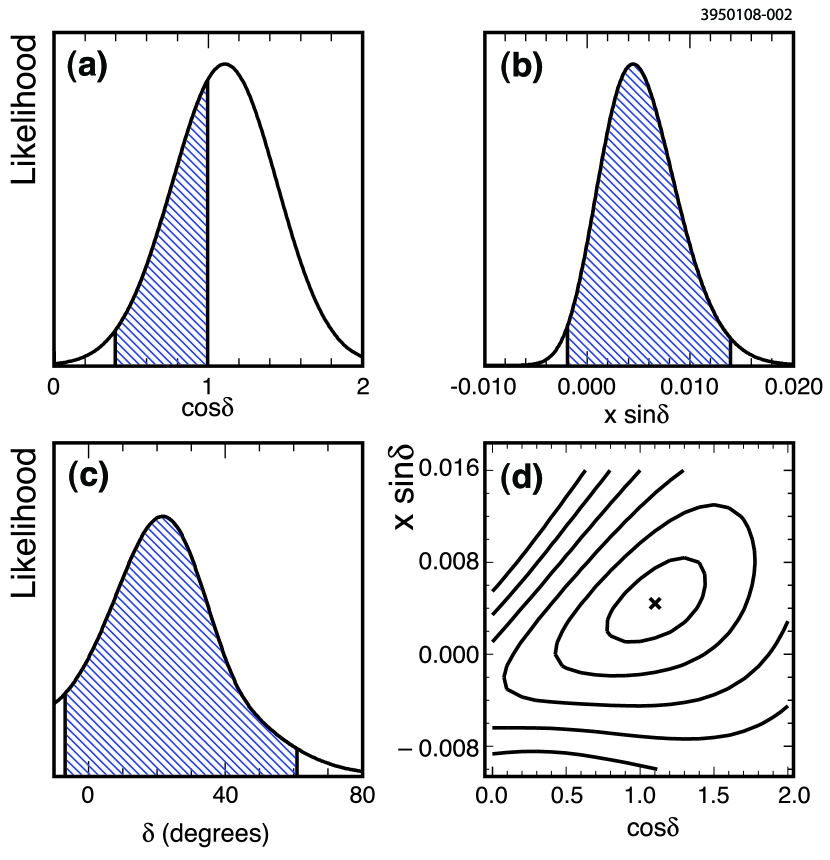
The results of the standard and extended fit are given in Table 3. A value of can only be determined reliably in the extended fit. The extended fit likelihoods for , and are shown in Figure 1. Despite the additional information in the extended fit the uncertainty on increases due to the non-linear relationship between and . However, the determination of in the extended fit allows the likelihood for to be determined. This leads to a measurement of , which is the first direct determination. These measurements are important for the interpretation of the combined results on charm mixing [10].
4 Measurement of the coherence parameter and average strong-phase difference in
The amplitudes for and have a relative phase between them of , where is the strong-phase difference. For decays in which the and decay to the same final state, , the two amplitudes interfere giving sensitive to . The amplitude for is given by:
| (1) |
where at 90% c.l. [1] is the ratio of the absolute value of to amplitudes, and and are the amplitudes for and , respectively.
For the case where is [5] the decay rates are equal to:
The suppressed rate has an interference term of the same order as the other terms leading to enhanced sensitivity to .
The rates for are of a similar form, however, an additional coherence parameter, , is introduced [11] to account for the possibility of several different intermediate states, with differing strong phases, contributing, such as and . For example the suppressed rate is given by:
where is the absolute of the ratio of DCS to CF amplitudes and is the average strong-phase difference.
The definition of is such that it takes a value between zero and one, with values approaching zero corresponding to many different intermediate states contributing equally and values approaching one corresponding to the dominance of a single intermediate final state. To exploit fully the sensitivity to , and in the case of external measurements of the coherence parameter are extremely important.
The quantum correlated data allow direct measurements of and . Double-tagged rates are used to determine these parameters; their dependence on the parameters are listed in Table 4. The interpretation of the measurement of requires the meaurement of presented in Section 3.
| vs. | Measurement | Signal yield |
|---|---|---|
| -tags | ||
The analysis has been performed on of data and proceeds in a similar manner to that presented in Section 3. All the -tags listed in Table 2 are used in this analysis apart from ; this and other modes will be included in an updated version of the analysis. In addition, the -tags and are included. The backgrounds levels are between 1 and 7% depending on the final state reconstructed. The efficiency for reconstruction for the different final states varies between 4 and 30%.
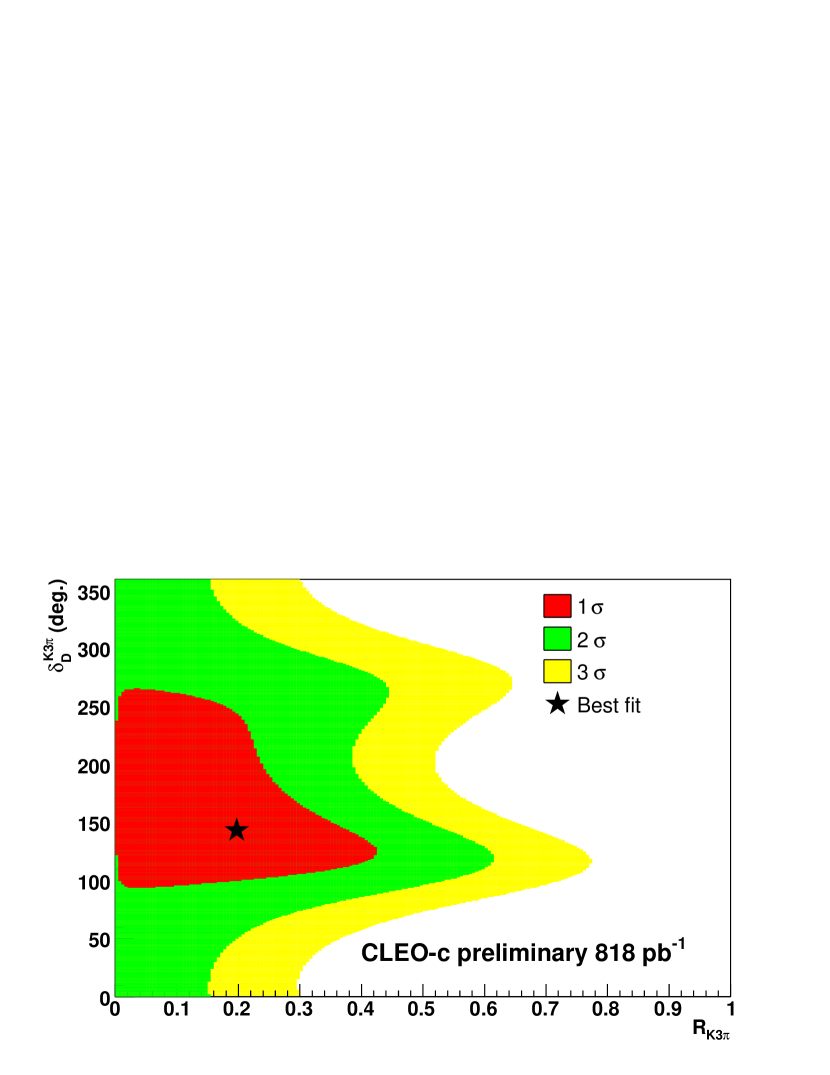
The different constraints on and determined from the data are given in Table 4. The combined result for the nine tagged rates is shown; the combination is performed including systematic uncertainties and accounting for all correlations amongst the measurements. The combination of the three different constraints leads to the likelihood contours in and space shown in Figure 2. The most likely values of the parameters are and . A low value of the coherence parameter is favoured. Low coherence dilutes the sensitivity to of decays, however, the measurements are very sensitive to which is a common parameter with other decays. The usefulness of these constraints on and can be illustrated when they are combined with the expected yields for and at the LHCb experiment [12, 13, 14] to determine . Depending on the parameter values the uncertainty on reduces by 25 to 35%. More details of this analysis are documented in Ref. [15].
5 Studies of the strong-phase variation in
The process currently provides the best determinations of [16, 17]. The sensitivity to is exploited via likelihood fits to the Dalitz plot [18]. These fits require models of the amplitudes which introduce a to systematic uncertainty on . Future measurements of will be limited by this uncertainty.
An alternative method is to perform a model-independent binned analysis of the Dalitz plots, which was orginally proposed in Ref. [18] and has been developed significantly in Ref. [19]. The binned method requires knowledge of two parameters in each bin of the Dalitz space, and , which are the average cosine and sine of the strong-phase difference between and decaying to , respectively.
The values of and can be determined from data at CLEO-c [20]. The value of can be measured from differences in the and tagged Dalitz plots; and are determined from double events.
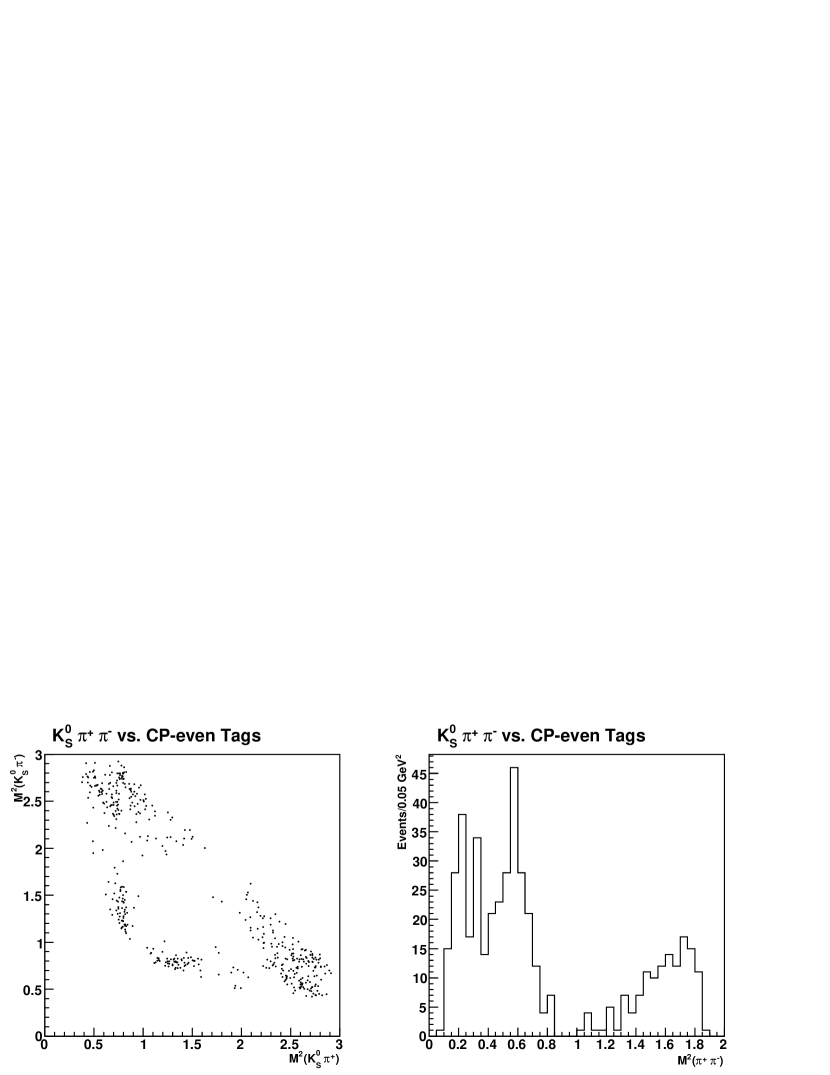
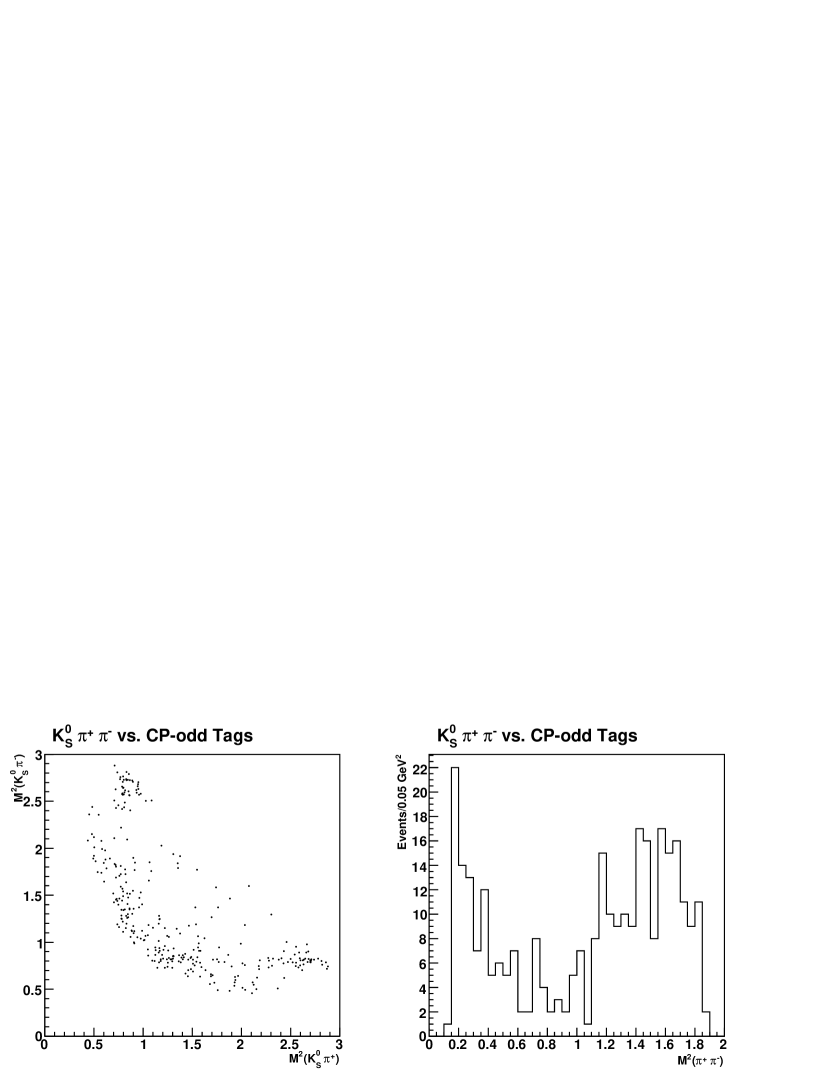
The measurement of and from CLEO-c’s sample of data is underway. Again and are the main variables used to isolate the signal. The -tagged Dalitz plots and invariant-mass squared distributions are shown in Figure 3. The presence of the quantum correlations is shown clearly by the absence of the in the tagged data.
Preliminary estimates indicate that these data will lead to a 3 to uncertainty on from those on the measurements of and at CLEO-c. The measurements can be improved by including information from decays at CLEO-c.
References
- [1] J. Charles et al. (CKMfitter Group), Eur. Phys. J. C41, 1 (2005), updated results and plots at http://ckmfitter.in2p3/fr.
- [2] W.-M. Yao, Journal of Physics G 33, 1 2006.
- [3] G. Viehauser et al., Nucl. Instrum. Methods Phys. Res., Sect. A 462, 146 (2001); R. A. Briere et al. (CESR-c and CLEO-c Taskforces, CLEO-c Collaboration), Cornell University, LEPP Report No. CLNS 01/1742 (2001) (unpublished).
- [4] M. Charles, these proceedings.
- [5] D. Atwood, I. Dunietz and A. Soni, Phys. Rev. Lett. 78 3257 (1997); D. Atwood, I. Dunietz and A. Soni, Phys. Rev. D 63 036005 (2001).
- [6] D. Asner and W. Sun, Phys. Rev. D 73, 034024 (2006); 77, 019901(E) (2008).
- [7] J. L. Rosner et al., Phys. Rev. Lett. 100, 221801 (2008); D. Asner et al., to be published in Phys. Rev. D, arXiv:0802.2268 [hep-ex].
- [8] Q. He et al., Phys. Rev. Lett. 100, 091801 (2008).
- [9] T. E. Coan et al., Phys. Rev. Lett. 95, 181802 (2005).
- [10] A. J. Schwartz, arXiv:0803.0082 [hep-ex].
- [11] D. Atwood and A. Soni, Phys. Rev. D 68 033003 (2003).
- [12] LHCb Technical Proposal, LHCb Collaboration, CERN/LHCC 98-4 (1998); LHCb Reoptimized Detector, Design and Performance, LHCb Collaboration, CERN/LHCC 2003-040 (2003).
- [13] M. Patel, LHCb-2006-066.
- [14] A. Powell, LHCb-2007-004.
- [15] A. Powell, arXiv:0805.1722 [hep-ex].
- [16] B. Aubert et al., arXiv:0804.2089 [hep-ex].
- [17] K. Abe et al., arXiv:0803.3375 [hep-ex].
- [18] A. Giri, Yu. Grossman, A. Soffer and J. Zupan, Phys. Rev. D 68 054018 (2003).
- [19] A. Bondar and A. Poluektov, arXiv:0801.0840 [hep-ex]; A. Bondar and A. Poluektov, Eur. Phys. J. C47 347 (2006).
- [20] E. White and Q. He, arXiv:0711.2285v1 [hep-ex].