A New View of the Super Star Clusters in the Low-Metallicity Galaxy SBS 0335-052
Abstract
We present a study of the individual super star clusters (SSCs) in the low-metallicity galaxy SBS 0335-052 using new near-infrared and archival optical Hubble Space Telescope observations. The physical properties of the SSCs are derived from fitting model spectral energy distributions (SEDs) to the optical photometry, as well as from the H and Pa nebular emission. Among the clusters, we find a significant age spread that is correlated with position in the galaxy, suggesting successive cluster formation occurred in SBS 0335-052 triggered by a large-scale disturbance traveling through the galaxy at a speed of km s-1. The SSCs exhibit -band (m) and near-IR (m) excesses with respect to model SEDs fit to the optical data. We hypothesize that the -band excess is dominated by a photoluminescent process known as Extended Red Emission; however, this mechanism cannot account for the excesses observed at longer near-IR wavelengths. From the cluster SEDs and colors, we find that the primary origin of the near-IR excess observed in the youngest SSCs ( Myr) is hot dust emission, while evolved red supergiants dominate the near-IR light in the older ( Myr) clusters. We also find evidence for a porous and clumpy interstellar medium (ISM) surrounding the youngest, embedded SSCs: the ionized gas emission underpredicts the expected ionizing luminosities from the optical stellar continuum, suggesting ionizing photons are leaking out of the immediate vicinity of the clusters before ionizing hydrogen. The corrected, intrinsic ionizing luminosities of the two SSCs younger than Myr are each , which is equivalent to each cluster hosting O7.5 V stars. The inferred masses of these SSCs are .
Subject headings:
galaxies: dwarf – galaxies: individual (SBS 0335-052) – galaxies: starburst – galaxies: star clusters1. Introduction
Ancient globular clusters are among the oldest objects known, almost as old as the universe itself with ages estimated in excess of 12 Gyr (Vandenberg et al., 1996; Freeman & Bland-Hawthorn, 2002). As such, these clusters are valuable relics of the earlier universe, when violent and intense star formation was common. Indeed, globular clusters are ubiquitous around massive galaxies today (Harris, 1991; Brodie & Strader, 2006), and they must have been formed prodigiously in the primordial universe given that may have been subsequently destroyed (Fall & Zhang, 2001; Whitmore et al., 2007).
However, the conditions required for the creation of globular clusters have puzzled astronomers for decades. For many years the prevailing belief was that globular clusters were simply formed by the gravitational collapse of density inhomogeneities in the early universe (Peebles & Dicke, 1968; Fall & Rees, 1985), and little was known about their early evolution. However, in the mid 1990’s, observations using the Hubble Space Telescope discovered extremely young, massive, and compact clusters in the local universe, the so-called “super star clusters” (SSCs) that have properties consistent with those expected for adolescent globular clusters (e.g. Whitmore, 2003). The discovery of SSCs precipitated a major shift in our understanding of the conditions required for globular cluster formation.
Although the evidence connecting young SSCs and ancient globular clusters is compelling, a critical issue remains: modern day SSCs and ancient globular clusters were formed in environments with very different metallicities. We have not yet observationally constrained what effect low metal abundances had on the formation of massive star clusters. Much effort has gone into understanding the formation of the first stars in the universe (e.g. those stars formed out of truly primordial material, Bromm & Loeb, 2003; Santoro & Shull, 2006; Tumlinson, 2007), and it is clear that metallicity has a critical role in this regime. Even moderately low metal abundances may affect star formation in a number of ways, including dust formation, cooling and pressure, and the hardness of the resulting stellar spectra.
In an effort to investigate massive star cluster formation in an environment similar to that which might be found in primordial galaxies during the time ancient globular clusters were prolifically formed, we have targeted the galaxy SBS 0335-052 (E) for a detailed multi-wavelength study. SBS 0335-052 is a remarkable blue compact dwarf galaxy at a distance of 54 Mpc (NED222NASA/IPAC Extragalactic Database) that is well-known for its extremely low oxygen abundance of (Izotov et al., 1990; Melnick et al., 1992; Izotov et al., 2001). Unlike I Zw 18 and SBS 0335-052W, which have slightly lower metallicities, SBS 0335-052 is undergoing a vigorous starburst with a star formation rate yr-1 and hosts extremely massive young clusters, making it ideal for this study (Thuan et al., 1997, 1999; Hunt et al., 2001; Dale et al., 2001; Plante & Sauvage, 2002; Hunt et al., 2004; Houck et al., 2004).
Here we present new near-infrared and archival optical high-resolution observations of SBS 0335-052 with the goal of studying SSC formation and evolution at low metallicity. Near-IR observations are particularly important for probing the dusty birth environments of embedded massive star clusters, and the wavelength range of m is well-suited to assessing a cluster’s evolutionary state because it samples the spectral energy distribution (SED) at the nexus of emission between dust and stellar light.
The HST observations and photometry are presented in §2 and §3. In §4, we discuss various properties of the SSCs. Specifically, we derive the physical properties of the SSCs from fitting model SEDs to the optical photometry, as well as from the H, Pa, and thermal radio nebular emission (Johnson, Hunt, & Reines, in prep). In addition, we present evidence for a porous and clumpy ISM in the youngest embedded clusters in SBS 0335-052 which can account for the apparently discrepant extinction estimates found in the literature. We also provide explanations for the observed I-band (m) and near-IR (m) excesses. Evidence for successive cluster formation is given in §5, and finally, our conclusions are summarized in §6.
2. HST Observations
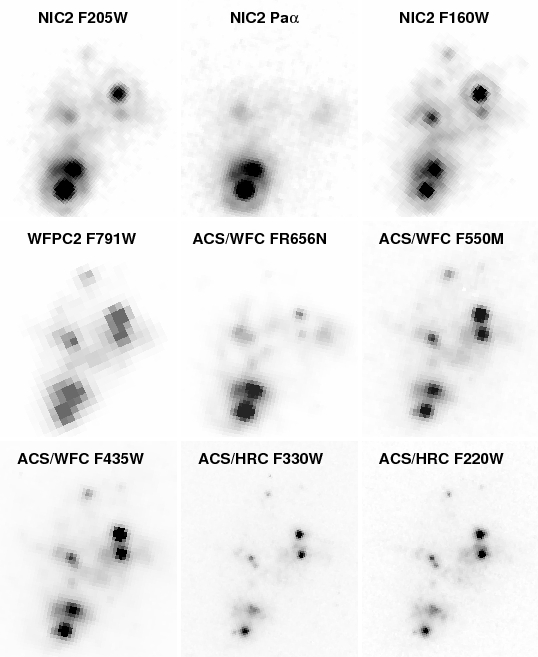
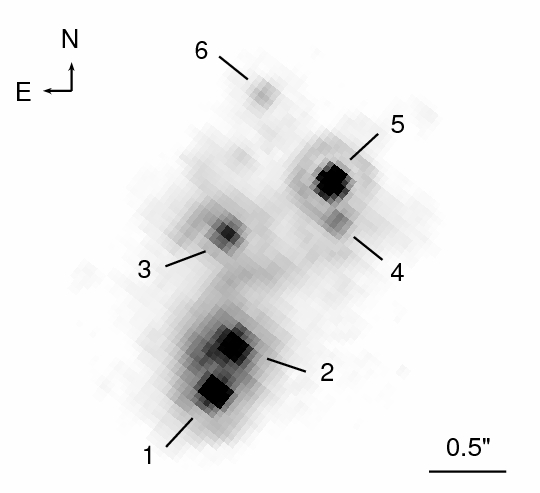
Multi-wavelength imaging of SBS 0335-052 has been obtained with the Hubble Space Telescope333Based on observations made with the NASA/ESA Hubble Space Telescope, obtained at the Space Telescope Science Institute, which is operated by the Association of Universities for Research in Astronomy, Inc., under NASA contract NAS 5-26555. These observations are associated with program #10894, 10575, & 5408.. New high-resolution near-IR observations are presented along with archival UV and optical images of the galaxy. A summary of the observations used in this work is given in Table 1 and the images are shown in Figure 1. The SSCs (1-6) are identified in Figure 2 using the notation of Thuan et al. (1997).
| Filter | Instrument | Description | Exp. Time (s) |
|---|---|---|---|
| New Near-IR ObservationsaaThe NIC 2 observations are associated with Proposal ID 10894 (this work). | |||
| F160W | NIC 2 | m, H | 2431 |
| F187N | NIC 2 | Pa continuum | 4862 |
| F190N | NIC 2 | P (redshifted) | 4606 |
| F205W | NIC 2 | m, K | 2175 |
| Archival UV and Optical ObservationsbbThe ACS and WFPC2 observations are associated with Proposal IDs 10575 (PI G. Ostlin) and 5408 (PI T. Thuan), respectively. | |||
| F220W | ACS/HRC | Near-UV | 1660 |
| F330W | ACS/HRC | HRC U | 800 |
| F435W | ACS/WFC | Johnson B | 680 |
| F550M | ACS/WFC | Narrow V | 430 |
| FR656N | ACS/WFC | H | 680 |
| F791W | WFPC2 | I | 4400 |
2.1. Near-IR Imaging with NICMOS
High-resolution near-IR observations of SBS 0335-052 were obtained with the Near Infrared Camera and Multiobject Spectrometer (NICMOS) on 2006 September 28 and 2006 December 25-26. Using the NIC 2 Camera, broad-band images at m () and m () were obtained through the F160W and F205W filters, respectively, and narrow-band Paschen line and continuum images were obtained through the F190N and F187N filters, respectively444At the redshift of SBS 0335-052, the Pa line falls in the F190N filter and the F187N filter is used to obtain the continuum.. A spiral dither pattern was implemented to allow improvement of the spatial resolution of the observations by better sampling the point spread function (PSF) of the NIC 2 Camera. In addition, off-source observations were obtained in the F187N, F190N, and F205W filters in order to mitigate the effects of the thermal background.
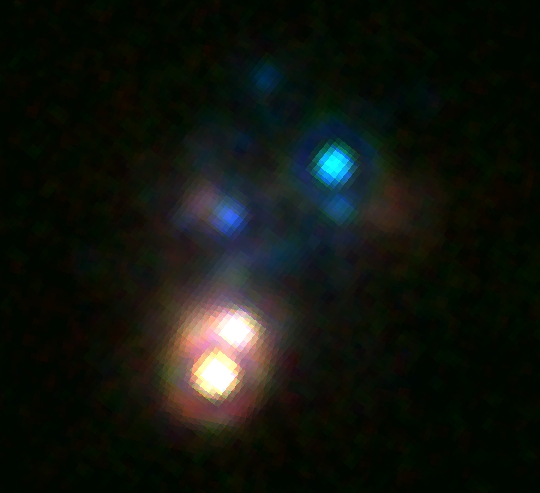
The raw data were processed with the calnica NICMOS calibration pipeline. The calibrated NICMOS data were further reduced using a combination of custom IDL programs and the Drizzle software (Fruchter & Hook, 2002) available in the STSDAS555The Space Telescope Science Data Analysis System DITHER package in IRAF666The Image Reduction and Analysis Facility is distributed by the National Optical Astronomical Observatories, which are operated by the Association of Universities for Research in Astronomy (AURA) Inc., under cooperative agreement with the National Science Foundation (NSF).. The residual flat imprint and “pedestal effect” that can plague NICMOS observations were effectively removed by subtracting off-source “sky” images from on-source images for each dither position777 This step was not applied to the F160W images since thermal fluctuations are minimal at m and we did not chop to sky for these observations. and then subtracting the quadrant-dependent bias levels. The resulting images (8 for each of the F160W and F205W filters and 16 for each of the F187N and F190N filters) were then combined using the Drizzle software to remove cosmic rays and improve the spatial resolution of the images. The drizzle parameter scale was set to 0.5 to reduce the native NIC 2 plate scale of 0075 pixel-1 to 00375 pixel-1. The final drizzled images are essentially diffraction limited, with spatial resolutions in the range 015 (m) to 02 (m). Figure 3 shows a three-color NICMOS image: F160W (blue), F205W (green), and Pa (red).
2.2. Archival UV and Optical Images
Optical and UV observations of SBS 0335-052 have been obtained with the Advanced Camera for Surveys (ACS) and we have retrieved the pipeline-produced calibrated and drizzled images from the archive. Images through the F220W ( Near-UV) and F330W () filters were obtained with the High Resolution Channel (HRC) and images through the F435W (), F550M (), and FR656N (H) filters were obtained with the Wide Field Channel (WFC). The HRC and WFC have plate scales of 0027 pixel-1 and 005 pixel-1, respectively. The HRC UV images have a resolution of 006 and the WFC optical images have a resolution of 0125. SSC 3 is actually two sources at the resolution of the ACS/HRC.
Two images of SBS 0335-052 through the F791W () filter were obtained with the Wide Field and Planetary Camera 2 (WFPC2) and we combined the pipeline-produced calibrated images from the archive and rejected cosmic rays. The galaxy was placed on the WF3 chip which has a plate scale of 01 pixel-1. The resolution of the F791W image is 02.
3. Photometry of the Super Star Clusters in SBS 0335-052
We performed aperture photometry on the super star clusters identified by Thuan et al. (1997) using a custom IDL photometry program (SURPHOT) allowing for consistent apertures and background annuli across multiple wavebands. A full description of SURPHOT is given in Reines et al. (2008).
The SSCs are identified in the F160W image (using the notation of Thuan et al., 1997, see Figure 2) and the flux density at each wavelength is measured within a circular aperture of radius 015. The background contribution at each wavelength is determined within an annulus of inner and outer radii equal to 045 and 065, respectively. Aperture corrections are determined from simulated PSFs for each camera-filter combination and position on the detector using the Tiny Tim software package (v6.3) distributed by the Space Telescope Science Institute (Krist & Hook, 2004). Final aperture-corrected flux densities are obtained by multiplying the measured background-subtracted flux densities within a 015 radius aperture by the following factors: 1.29(F220W), 1.21(F330W), 1.23(F435W), 1.22(F550M), 1.22(FR656N), 1.68(F791W), 1.85(F160W), 1.87(F187N), 1.88(F190N), and 1.94(F205W).
Final aperture-corrected flux densities and HST system magnitudes with Vega zeropoints of the SSCs are listed in Table 2. Pa fluxes, H fluxes, and H equivalent widths of the SSCs are given in Table 3. The width of the FR656N (131 Å) filter is such that it would contain any [NII] emission in addition to H. The [NII] emission in SBS 0335-052, however, is negligible (Izotov et al., 1990). The H equivalent widths are obtained by dividing the total (continuum subtracted) H flux in the FR656N filter by the continuum flux density at the redshifted wavelength of H (6651 Å), which is found by interpolating between the F550M and F791W filters. We note that the Pa flux measured in the entire line-emitting region containing SSCs 1 and 2 is equal to that found by Thompson et al. (2006), erg s-1 cm-2. The H flux in this region is erg s-1 cm-2.
| Source | F220W | F330W | F435W | F550M | F791W | F160W | F187N | F205W |
|---|---|---|---|---|---|---|---|---|
| Log Flux Density (erg s-1 cm-2 Å-1 ) | ||||||||
| SSC 1 | -15.66 | -15.90 | -16.10 | -16.51 | -16.65 | -17.56 | -17.51 | -17.35 |
| SSC 2 | -15.69 | -15.98 | -16.20 | -16.58 | -16.83 | -17.60 | -17.68 | -17.49 |
| SSC 3 | -15.86 | -16.28 | -16.53 | -16.86 | -17.11 | -17.88 | -18.09 | -18.08 |
| SSC 4 | -15.39 | -15.87 | -16.15 | -16.55 | -16.87 | -18.06 | -18.13 | -18.18 |
| SSC 5 | -15.34 | -15.78 | -15.98 | -16.27 | -16.56 | -17.58 | -17.64 | -17.73 |
| SSC 6 | -16.31 | -16.71 | -16.91 | -17.18 | -17.41 | -18.37 | -18.54 | -18.46 |
| HST System Magnitude with Vega Zeropoint | ||||||||
| SSC 1 | 18.29 | 18.53 | 19.78 | 20.11 | 19.29 | 19.16 | 18.37 | 17.65 |
| SSC 2 | 18.37 | 18.73 | 20.02 | 20.28 | 19.75 | 19.27 | 18.79 | 18.01 |
| SSC 3 | 18.79 | 19.48 | 20.85 | 20.98 | 20.44 | 19.96 | 19.82 | 19.49 |
| SSC 4 | 17.62 | 18.45 | 19.90 | 20.20 | 19.85 | 20.41 | 19.92 | 19.75 |
| SSC 5 | 17.50 | 18.24 | 19.47 | 19.52 | 19.07 | 19.20 | 18.68 | 18.61 |
| SSC 6 | 19.91 | 20.54 | 21.80 | 21.79 | 21.20 | 21.17 | 20.95 | 20.43 |
Note. — We adopt a distance modulus of 33.66 for SBS 0335-052. The uncertainties in the flux densities are .
| Source | Pa Flux ( | H Flux ( | H Equivalent |
|---|---|---|---|
| erg s-1 cm-2) | erg s-1 cm-2) | Width (Å) | |
| SSC 1 | 7.26(0.78) | 61.17(6.48) | 2300(410) |
| SSC 2 | 4.65(0.50) | 37.69(4.05) | 1870(330) |
| SSC 3 | 0.55(0.07) | 6.18(0.78) | 580(110) |
| SSC 4 | 0.23(0.04) | 1.55(0.56) | 80(30) |
| SSC 5 | 0.18(0.07) | 1.19(0.96) | 30(20) |
| SSC 6 | 0.08(0.01) | 0.23(0.13) | 50(30) |
4. Properties of the SSCs
4.1. Spectral Energy Distributions
We estimate the physical properties of the SSCs in SBS 0335-052 by comparing their spectral energy distributions (SEDs) to the latest STARBURST99 population synthesis models (v5.1) of Leitherer et al. (1999). We have run two simulations using different evolutionary tracks and metallicities: (1) the Geneva tracks with high mass loss and Z=0.001 and (2) the Padova tracks with AGB stars and Z=0.0004. In both cases, we adopt an instantaneous burst of with a Kroupa IMF (Kroupa, 2001) and the Pauldrach/Hillier atmospheres. The two simulations use the lowest metallicity evolutionary tracks available in STARBURST99 from the Geneva and Padova groups, appropriate for SBS 0335-052. The high mass loss tracks are recommended by the Geneva group and the inclusion (or exclusion) of AGB stars in the Padova tracks is not critical since we are modelling very young clusters. We have run the two simulations for comparison and as a consistency check.
Ages, extinctions, and masses of the SSCs are estimated by comparing a grid of model SEDs (separately for each simulation) to the broad-band HST flux densities. The grids consist of model SEDs with ages up to 20 Myr in increments of Myr and extinctions up to mag in increments of 0.1 mag. The work of Reines et al. (2008) on young massive clusters in the dwarf starburst galaxy NGC 4449 showed that model SEDs modified by a 30 Doradus extinction curve888The 30 Doradus extinction curve is adopted from Misselt et al. (1999, Table 3) and Fitzpatrick (1985, Table 6), using the parameterization given by Fitzpatrick & Massa (1990). fit the clusters’ broadband flux densities significantly better than the Galactic extinction curve (Cardelli et al., 1989) and the starburst obscuration curve (Calzetti et al., 2000). Therefore, we first apply the 30 Doradus extinction curve with a given to the model SEDs. Next, we simulate Galactic foreground extinction towards SBS 0335-052 ( mag, Schlegel et al., 1998) using the extinction curve of Cardelli et al. (1989). Each model SED, of a given age and , is then convolved with the HST total throughput curves of the appropriate filters before it is compared to the measured flux densities. The best-fit model SED is determined by minimizing a goodness-of-fit parameter, , equal to the standard deviation of the logarithmic residuals of the observed and model flux densities. A mass estimate is obtained by scaling the model mass by the mean logarithmic offset between the observed and best-fit model flux densities.
We include the F220W, F330W, F435W, and F550M flux densities in the SED fitting. The strongest Balmer lines, H and H, are not contained in this filter set, although the F435W filter does include H and H. Since Reines et al. (2008) revealed excesses in the - and -band flux densities of the young clusters in NGC 4449 compared to model SEDs, we did not include data at wavelengths longer than the F550M filter () in the fitting process here. The observed and best-fitting model SEDs of the SSCs in SBS 0335-052 are shown in Figure 4. The grids of are also shown to give a sense of the uncertainty in the estimates of ages and extinctions. Black indicates lower values of sigma (better fits) and red indicates higher values of sigma (worse fits). The best-fitting model is indicated by a white cross-point. Figure 4 also shows that there is a clear excess in the -band and at near-IR wavelengths compared to the model SEDs. We will return to this in §4.3.
Estimates of the ages, masses, and extinctions of the SSCs are found by averaging these physical properties of the best-fitting model SEDs from the two STARBURST99 simulations and the results are listed in Table 4. We note that the derived extinctions for SSCs 1 and 2, , are consistent with the extinction from the optical recombination line ratio H/H found by Izotov et al. (1997). There is no significant difference between the goodness-of-fits using the two different STARBURST99 simulations. The quoted errors reflect the variations in the results using the two simulations, although they represent the minimum uncertainties since the models are somewhat degenerate in age and extinction (see Figure 4). Despite this degeneracy, we still have confidence in the physical properties of the SSCs derived from SED fitting for the following reasons. First, the ages are consistent with those we derive from H equivalent widths in the following section (with the exception of SSC 4, see below). Also, as noted above, the are in agreement with the work of Izotov et al. (1997), although we emphasize that caution must be applied when interpreting the meaning of extinction estimates of the embedded SSCs (1 and 2). We will address this issue in detail in §4.2.3.
| Source | Age | Mass | |
|---|---|---|---|
| (Myr) | () | (mag) | |
| SSC 1 | aaThe SEDs are insensitive to ages Myr. | 1.0(0.1) | 0.5(0.1) |
| SSC 2 | aaThe SEDs are insensitive to ages Myr. | 1.1(0.1) | 0.5(0.1) |
| SSC 3 | 5.7(3.8) | 0.4(0.2) | 0.2(0.1) |
| SSC 4 | a,a,footnotemark: bbThis young age is probably incorrect since copious amounts of H and P emission would be expected for such a young cluster and this is not observed. The age of SSC 4 inferred from the H equivalent width is Myr. | 1.1(0.1) | 0.1(0.1) |
| SSC 5 | 11.8(1.1) | 1.8(0.2) | 0.0(0.1) |
| SSC 6 | 12.2(3.2) | 0.2(0.1) | 0.1(0.1) |
Note. — Estimates of the physical properties of the SSCs in SBS 0335-052 derived from SED fitting. The values listed are averages from the best-fitting model SEDs using the two STARBURST99 simulations described in the text (there was no significant difference in the fits using either of the model simulations). The quoted errors in parenthesis reflect the variations in the results using the two simulations. Also see Figure 4.
4.2. Nebular Emission from the SSCs
4.2.1 Ages
In addition to SED fitting to the stellar continuum, the nebular emission from a starburst region can also provide estimates of the physical properties of the host cluster. Age estimates can be obtained from the equivalent width of H emission since this quantity measures the ratio of ionizing flux (from massive, short-lived stars) to the total continuum flux density. This ratio is strongly dependent on age for stellar populations between approximately 3 and 20 Myr old. The insensitivity before Myr arises because the most massive stars must begin to die in order for the ionizing flux (and H equivalent width) to decrease. Clusters older than Myr are not strong H emitters.
In addition, if the dusty interstellar medium (ISM) surrounding the clusters is uniform and every Lyman continuum photon ionizes a hydrogen atom, rather than getting absorbed by dust or escaping the cluster altogether, then H equivalent width will be independent of reddening (since the continuum is measured at the wavelength of H). If, however, the surrounding ISM is porous and a significant fraction of ionizing and non-ionizing photons escape the cluster, the equivalent width of H will be artificially low and only provide an upper limit on the age of the cluster. This is because we would detect all of the stellar continuum photons at 6563 Å that escape, but the H flux would be reduced due to the leakage of ionizing photons (which do not actually ionize the gas).
Age estimates from comparing the H equivalent widths of the SSCs with the STARBURST99 models are given in Table 5 and a significant age spread between the clusters is found ( to Myr). These age estimates are consistent with those obtained from SED fitting (within the errors), with the exception of SSC 4. In this case, the age from SED fitting ( Myr) is most likely incorrect since we would expect copious amounts of H and Pa emission from such a young cluster and this is not observed. The age of SSC 4 from the H equivalent width is Myr. It is not entirely clear why such a young age was found from SED fitting, although contamination by the diffuse emission surrounding SSC 4 (see Figure 1) at short wavelengths may be responsible.
4.2.2 Ionizing Luminosities
The production rate of Lyman continuum photons, , from the SSCs can be estimated from their H and Pa fluxes. From Equations 2 and 3 in Condon (1992), the ionizing photon rate as a function of H luminosity, , is given by
| (1) |
This equation provides only a lower limit since a fraction of the ionizing photons may be absorbed by dust, or escape the cluster altogether before ionizing hydrogen atoms if the ISM is porous and clumpy. For Case B recombination, an electron temperature of 20,000 K (Izotov et al., 1997), and an electron density between and , the expected (reddening-free) flux ratios of H and Pa to H are given by Condon (1992) and Osterbrock (1989): , . We use Equation 1 and the predicted line ratios with our observed (not extinction corrected) H and Pa fluxes to obtain estimates of the ionizing luminosities, , produced by the SSCs in SBS 0335-052 (see Table 5).
In addition to the H and Pa fluxes, we use new measurements of the (thermal) free-free radio flux densities at 1.3 cm (Johnson, Hunt, & Reines, in prep) to estimate the ionizing luminosities of SSCs 1 and 2 (the other clusters do not have significant detections at 1.3 cm). Johnson, Hunt, & Reines (in prep) find that the radio flux densities at 1.3 cm are optically thin and equal to 0.17 mJy and 0.12 mJy for SSCs 1 and 2, respectively. We adopt a distance of 54 Mpc to calculate the radio luminosity densities, , and follow Condon (1992)
| (2) | |||
to estimate the ionizing luminosities of SSCs 1 and 2 (see Table 5).
| Age | |||||||
|---|---|---|---|---|---|---|---|
| (Myr) | ( s-1) | ( s-1) | ( s-1) | ||||
| SSC 1**The age estimates for these young clusters are upper limits since H equivalent width is insensitive to ages Myr and also possibly due to the leakage of ionizing photons through a porous ISM (see discussion in the text). The ionizing fluxes for SSCs 1 and 2 are lower limits because they do not reflect ionizing photons that either escape through a porous ISM or are absorbed by dust. Correcting the by the ’s imply SSCs 1 and 2 each have ionizing fluxes of . | 0.76(0.16) | 0.43(0.09) | 0.38(0.08) | ||||
| SSC 2**The age estimates for these young clusters are upper limits since H equivalent width is insensitive to ages Myr and also possibly due to the leakage of ionizing photons through a porous ISM (see discussion in the text). The ionizing fluxes for SSCs 1 and 2 are lower limits because they do not reflect ionizing photons that either escape through a porous ISM or are absorbed by dust. Correcting the by the ’s imply SSCs 1 and 2 each have ionizing fluxes of . | 0.51(0.11) | 0.26(0.06) | 0.22(0.05) | ||||
| SSC 3 | 6.8(2.5) | 160(20) | 190(20) | ||||
| SSC 4 | 12.4(1.7) | 70(10) | 50(20) | ||||
| SSC 5 | 15.1(2.3) | 50(20) | 40(30) | ||||
| SSC 6 | 13.9(1.9) | 20(10) | 10(10) |
Note. — Age estimates of the SSCs from H equivalent widths, as well as measured ionizing fluxes () and recovered fractions of ionizing fluxes () from H, Pa and 1.3 cm radio flux densities (Johnson, Hunt, & Reines, in prep). A three-dot ellipsis indicates sources that do not have detections at 1.3 cm.
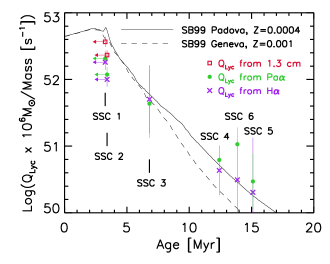
The ionizing luminosities of the SSCs should decrease as they age. Since we have established an age spread between the different clusters, we can check this prediction. However, ionizing luminosity is also a function of mass (in addition to age) so we need to scale the measured values to a common mass and remove the mass dependence. To achieve this, we divide the measured values by the masses derived from SED fitting (Table 4) and multiply by to scale the ionizing luminosities to those expected for a cluster. Figure 5 shows the scaled ionizing luminosities versus cluster age (derived from H equivalent widths). The two STARBURST99 models are also shown for comparison.
From Figure 5, we see that the ionizing luminosities of SSCs 3-6, derived from their H and Pa fluxes, are consistent with the model predictions. However, the ionizing luminosities of SSCs 1 and 2 (ages 3 Myr), derived from their H and Pa fluxes, are well below the expected values. In other words, these recombination lines are only sampling a fraction of the ionizing photons relative to the number expected from the non-ionizing stellar continuum inferred from the UV and optical photometry (recall that we have normalized the values by the masses derived from SED fitting to the UV and optical photometry). Equivalently, the masses inferred from the recombination line fluxes are less than those derived from SED fitting.
Interestingly, the optically-thin, free-free radio emission from SSCs 1 and 2 (Johnson, Hunt, & Reines, in prep) also underpredicts the ionizing luminosities (see Figure 5). This may suggest the ISM surrounding the young SSCs is clumpy and porous, with virtually unobscured lines-of-sight to the cluster stars. Clearly, some fraction of stellar continuum photons escape the clusters through low-extinction regions: we observe copious amounts of UV and optical photons and the derived from SED fitting is a modest mag for SSCs 1 and 2. The lower than expected suggest ionizing photons also escape the immediate vicinity of the clusters (without ionizing hydrogen), resulting in the loss of H, Pa and radio emission. This in turn, implies the H equivalent widths are lower limits and the ages of SSCs 1 and 2 are Myr.
We can calculate the recovered fractions of the ionizing luminosities from SSCs 1 and 2 by comparing the data points to the models in Figure 5. The fraction of ionizing luminosity recovered by H, , is for SSC 1 and for SSC 2. These values are consistent with previous estimates that, in the optical, only about 1/4 of the total ionized gas emission is observed for the region containing SSCs 1 and 2 (Hunt et al., 2001). From Pa, . Using the radio-derived ionizing luminosities, we find equals and for SSCs 1 and 2, respectively. The increase of with wavelength naturally follows from differential absorption (i.e. reddening) of the ionized gas as probed by the H, Pa and radio emission.
The measured ionizing luminosities and the recovered fractions of the intrinsic ionizing luminosities are summarized in Table 5. Correcting the measured ionizing luminosities (i.e. dividing the ’s by ’s) implies the intrinsic ionizing luminosities of SSCs 1 and 2 are each , or the equivalent of O7.5 V stars (Vacca et al., 1996). The inferred masses of these SSCs are (see Table 4).
4.2.3 Extinctions of the Embedded SSCs
The youngest SSCs in SBS 0335-052 (1 and 2) are still embedded in their natal birth material: they are the strongest emitters of H and Pa and the only clusters in the galaxy detected in the radio via free-free emission (Johnson, Hunt, & Reines, in prep). Various studies have provided extinction estimates from recombination lines of the region encompassing these two clusters (previous studies were not able to resolve the two sources) and the derived values appear to be discrepant: from H/H (Izotov et al., 1997), from H/Br (Vanzi et al., 2000), from H/Br (Hunt et al., 2001), and from Br/Br (Hunt et al., 2001). Mid-IR observations complicate the situation further. Thuan et al. (1999) found that the mid-IR SED is well-described by a modified blackbody spectrum extinguished by a screen of dust with mag. A qualitatively similar result was found by Plante & Sauvage (2002) and Hunt et al. (2005). These authors model the observed mid-IR SED using DUSTY (Ivezic & Elitzur, 1997; Ivezic et al., 1999), a program that solves the radiation transfer equations in a spherical environment, and conclude that the embedded starburst suffers magnitudes of visual extinction. Houck et al. (2004) also find a large extinction, , from the 9.7 m silicate absorption feature assuming a screen model and a blackbody background source. In this section, we attempt to reconcile the apparently discrepant extinction estimates assuming all of the emission (at all wavelengths) is associated with the optically visible SSCs 1 and 2.
We begin by estimating the extinctions of the recombination lines H (Izotov et al., 1997), H (this work), Pa (Thompson et al., 2006, and this work), Br (Vanzi et al., 2000), and Br (Hunt et al., 2001) relative to the (thermal) free-free radio emission from this region (Johnson, Hunt, & Reines, in prep). The radio emission does not suffer from extinction per se, although again we note that the far-UV photons can be absorbed by dust or escape the boundaries of the clusters before ionizing the gas. In either of these scenarios, the ionizing flux probed by the optical and IR lines would also be reduced by the same amount and the relative extinction between these lines and the radio would not be affected. To obtain the extinction estimates, we compare the measured fluxes to the expected values predicted by the free-free radio emission at 1.3 cm. Following Condon (1992), the predicted H flux is given by
| (3) | |||
where is the thermal free-free radio flux density (= 0.56 mJy). To obtain the predicted fluxes for the other recombination lines, we use the theoretical (reddening-free) line ratios appropriate for SBS 0335-052 (Case B, T=20000 K) given by Condon (1992) and Osterbrock (1989). The observed recombination line fluxes and the radio-predicted values are listed in Table 6. We give the flux ratios (observed to predicted) and the corresponding extinctions of these lines at their native wavelengths, .
| Line | Rest | Observed | Predicted | Flux | |
|---|---|---|---|---|---|
| (m) | FluxaaUnits are erg s-1 cm-2. | FluxaaUnits are erg s-1 cm-2. | Ratio | (mag) | |
| H | 0.486 | 6.1 | 14.3 | 0.4 | 0.9 |
| H | 0.656 | 16.6 | 40.8 | 0.4 | 1.0 |
| Pa | 1.875 | 1.77 | 4.05 | 0.4 | 0.9 |
| Br | 2.166 | 0.15 | 0.34 | 0.4 | 0.9 |
| Br | 4.052 | 0.90 | 0.88 | 1.0 | 0.0 |
Note. — Observed recombination line fluxes for H (Izotov et al., 1997), H (this work), Pa (Thompson et al., 2006, and this work), Br (Vanzi et al., 2000), and Br (Hunt et al., 2001) were measured in a aperture. The predicted values are from the free-free radio flux density at 1.3 cm (Johnson, Hunt, & Reines, in prep).
It is quite intriguing that, relative to the free-free radio emission, the calculated extinctions of the H, H, Pa, and Br emission are all mag (at their native wavelengths between m). The similar estimates of (or equivalently, the observed to predicted flux ratios) for these lines appear to indicate that there is not a significant amount of reddening (i.e. differential absorption with short wavelengths suffering more absorption) of the ionized gas between m.
The value then gives the total amount of absorption of these lines compared to the radio (i.e. the ratio of the ionized gas probed by the optical/near-IR lines to the total amount of ionized gas inferred from the free-free radio emission). If the ISM is clumpy as we have previously suggested (§4.2.2) and no optical or near-IR light gets through dense dust clumps (i.e. the light is completely absorbed), the ratio of the optical (and near-IR) emission to the radio emission is equivalent to the ratio of the amount of flux that emerges through the “holes” (optical/near-IR) to the amount of flux that emerges through both the holes and the clumps (radio). This ratio equals 0.4 for H, H, Pa, and Br. In other words, of the dust cocoon is void of clumps (low extinction regions) and is covered by clumps of dust that totally absorb light shortward of m (high extinction regions). In effect, there is a clumpy dust covering factor of .
These values are strikingly similar to our estimates of the fraction of ionizing luminosity recovered by the radio emission ( on average for SSCs 1 and 2) and the fraction of ionizing luminosity that escapes the clusters undetected (, see §4.2.2). This may suggest that the dust clumps and the neutral gas clumps are coincident, although this is not necessarily the case.
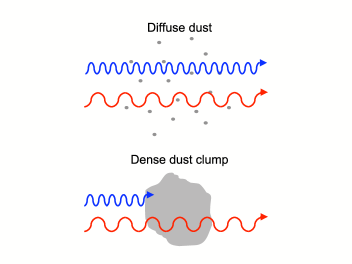
The picture outlined above is illustrated schematically in Figure 6. The large extinctions () derived from mid-IR observations (Thuan et al., 1999; Plante & Sauvage, 2002; Houck et al., 2004; Hunt et al., 2005) would be a natural consequence if the mid-IR emission originates from the dense dust clumps and not a uniform screen. In our proposed scenario, the dust would be heated by the strong UV stellar continuum impinging on the clumps. This would help explain the large extinction derived from the mid-IR spectral energy distributions. Also, if the extinctions inferred from the mid-IR describe absorption from dust clumps rather than a screen of dust, they may actually underestimate the absorption because of beam dilution effects. In addition, diffuse dust in the interclump regions could provide the modest reddening measured at optical wavelengths (since the optical light only emerges through the low extinction regions). The scenario described here is similar to the one proposed by Gordon et al. (1997) in which a dust-free star cluster is surrounded by a clumpy shell of dust and gas.
Moreover, the extinction curve in SBS 0335-052 appears to be anomalous. It is roughly constant up to m with , then drops to at m. This behavior is qualitatively similar to extinction curves along lines of sight with high gas densities. Such regions have typically flatter extinction curves, thought to be due to larger dust grains than in the diffuse ISM (e.g., Kim et al., 1994). In the case of SBS 0335-052, the grains may be as large as m; however the silicate absorption feature at m (e.g., Houck et al., 2004) makes grains larger than this rather unlikely, because in that case the absorption feature would be absent (Maiolino & Natta, 2002).
4.3. -band and Near-IR Excesses
| Source | F791W | F160W | F187N | F205W |
|---|---|---|---|---|
| SSC 1 | 0.7 | 1.2 | 2.0 | 2.7 |
| SSC 2 | 0.5 | 1.3 | 1.8 | 2.6 |
| SSC 3 | 0.6 | 1.5 | 1.6 | 2.0 |
| SSC 4 | 0.5 | 0.3 | 0.8 | 1.1 |
| SSC 5 | 0.5 | 0.4 | 0.9 | 1.1 |
| SSC 6 | 0.6 | 0.6 | 0.8 | 1.3 |
Note. — Near-IR excesses (in magnitudes) of the SSCs with respect to the best-fitting model SEDs (to the UV and optical data). An excess is defined as 2.5log(), where and are the observed and model flux densities, respectively. The values listed are averages from the best-fitting model SEDs using the two STARBURST99 simulations described in the text (there was no significant difference in the fits using either of the model simulations).
The SSCs in SBS 0335-052 exhibit excesses in the -band and at near-IR wavelengths with respect to model SEDs (Figure 4). Excesses in the F791W (), F160W (), F187N (m continuum), and F205W () filters are given in Table 7, where an excess in magnitudes is defined as 2.5log() ( and are the observed and best-fitting model flux densities (§4.1), respectively). In this section, we investigate the nature of these excesses. We emphasize that the -band (m) and near-IR (m) excesses likely have different origins.
4.3.1 Excess in the -band: Extended Red Emission?
The -band excess observed in the clusters of SBS 0335-052 ranges from 0.5–0.7 mag, similar to the excess found in the young massive clusters of NGC 4449999We note that the -band observations of SBS 0335-052 and NGC 4449 come from different instruments and slightly different filters (WFPC2/F791W for this work and ACS/F814W for NGC 4449). ( mag on average; Reines et al., 2008). The primary origin of the -band excess in these two systems is quite possibly the same. An extensive discussion of possible origins of the -band excess observed in the young clusters of NGC 4449 is given in Reines et al. (2008) and the favored hypothesis is Extended Red Emission (ERE) (for a review of ERE, see Witt & Vijh, 2004). ERE is a photoluminescent process in which an interstellar particle absorbs a UV photon and then ultimately emits a photon in the Å wavelength range. ERE is typically observed as a broad ( Å) emission feature and it has been detected in many astrophysical environments where both dust and UV photons are present, including the Orion Nebula (Perrin & Sivan, 1992) and the 30 Doradus Nebula (Darbon et al., 1998). ERE provides a favorable hypothesis for the -band (m) excess observed in the SSCs of SBS 0335-052, but it cannot explain the excesses seen at near-IR wavelengths (m).
4.3.2 Excess in the Near-IR: Hot Dust in the Younger SSCs and Red Supergiants in the Older SSCs
A near-IR/optical color-color diagram can provide insight into the origin of the near-IR (m) excesses observed in the SSCs of SBS 0335-052. Figure 7 shows a plot of [F550M][F205W] () versus [F550M][F160W] () with the SSCs labeled. The line [F160W][F205W]=0 is also shown, approximating the color of main sequence stars throughout their lives and consistent with the STARBURST99 evolutionary models. In addition, we plot the line [F160W][F205W]=0.5, a characteristic red supergiant (RSG) color (McCrady et al., 2003; Pickles, 1998)101010McCrady et al. (2003) calculate a synthetic [F160W][F222M] color of 0.52 for a M2 I star in the Pickles (1998) library.. Note that in this color-color diagram, the F550M magnitudes are dominated by the hot, unevolved cluster stars.
Figure 7 illustrates that SSCs 3-6 have [F160W][F205W] colors consistent with RSGs. This is in agreement with other studies showing these evolved stars are the dominant source of near-IR light in SSCs older than Myr (e.g. McCrady et al., 2003). We should also point out that RSGs could also contribute to the observed -band excess in these older clusters. The two youngest SSCs in SBS 0335-052 (1 and 2) have extremely red [F160W][F205W] colors that are quantitatively different from the other clusters: and , respectively (Table 2). The origin of these red colors is not consistent with RSGs and another mechanism must be responsible. This is not surprising since RSGs should not have had enough time to evolve in these Myr old clusters.

Emission lines have been observed in the and spectra of SBS 0335-052 (Vanzi et al., 2000) in the region containing SSCs 1 and 2, however the line contribution to the broad-band photometry here is negligible. In addition, the near-IR excesses observed in SSCs 1 and 2 (Figure 4) are so large ( mag in F160W, mag in F187N, and mag in F205W; Table 7), and an excess is present in the narrow-band continuum filter F187N, that continuum emission must be the dominant cause.
Although ionized gas continuum emission may be important (see e.g. Vanzi et al., 2000; Hunt et al., 2001), we propose that hot dust is the main origin of the red [F160W][F205W] colors for SSCs 1 and 2. To investigate this hypothesis further, we add a modified blackbody with a dust opacity curve given by Whitney et al. (2003) and Kim et al. (1994) to the best-fitting model SEDs (to the UV and optical data) presented in §4.1. The results are positive and are shown in Figure 8. Temperatures of 800 and 850 K for the hot dust components in SSCs 1 and 2 respectively, are effective at reproducing the observed near-IR SEDs. Vanzi et al. (2000) also concluded that hot dust was necessary to explain the red colors they observed in SBS 0335-052.
5. Evidence for Successive Cluster Formation in SBS 0335-052
We have already established a significant age spread between the SSCs in SBS 0335-052 (§4.2.1). In this section, we investigate the possibility of successive cluster formation in the galaxy. Thuan et al. (1997) demonstrated a systematic increase in the [F569W][F791W] color away from SSC 1. They attributed this trend to a combination of differential extinction by dust and evolutionary effects arising from sequential (self) propagating star formation. Thompson et al. (2006) also suggest that each star-formation event has positive feedback on subsequent star formation.
In the top of Figure 9, we plot [F550M][F791W] color versus projected distance from SSC 1, similar to Figure 2 in Thuan et al. (1997). We use the same -band (F791W) filter here, but a different (line-free) -band filter (F550M). The F569W filter used by Thuan et al. (1997) contains significant contamination from gaseous emission lines, whereas the F550M filter does not. We do not observe the same strong trend of redder [F550M][F791W] colors with distance from SSC 1.
We do, however, observe a strong correlation between cluster age (from H equivalent width) and distance from SSC 1 in the bottom of Figure 9. This is clear evidence for successive cluster formation from the northern end of SBS 0335-052 (SSC 6) to the southern end of the galaxy (SSC 1): we calculate a “propagation” speed of pc Myr km s-1. It should be emphasized that successive cluster formation does not necessarily imply self-propagating cluster formation (i.e. SSCs triggering the formation of more SSCs through supernovae shocks), although this is a possibility. Alternatively, the SSCs in SBS 0335-052 may have been sequentially triggered by a large-scale disturbance sweeping through the galaxy from roughly north to south, the origin of which is presently unknown, but could be related to an interaction with neighboring galaxies SBS 0335-052W and NGC 1376 (Pustilnik et al., 2001).
6. Conclusions
We have presented a multi-wavelength study of the super star clusters in SBS 0335-052, the lowest metallicity galaxy with a star formation rate yr-1 known. We use new near-IR and archival optical HST observations as well as free-free radio continuum measurements (Johnson, Hunt, & Reines, in prep) of the galaxy to probe the stellar populations and the gas and dust components of the clusters. The main results of our work are summarized below:
-
1.
There is a significant age spread between the SSCs in SBS 0335-052 that is correlated with position in the galaxy. The ages are in the range Myr to Myr with the youngest clusters located in the south and the oldest clusters in the north. A large-scale disturbance, with a velocity of km s-1, appears to have triggered the successive cluster formation that we observe.
-
2.
We find evidence for a porous and clumpy ISM surrounding the youngest SSCs in SBS 0335-052 (1 and 2). The measured ionizing luminosities from H, Pa, and optically-thin, free-free radio emission (Johnson, Hunt, & Reines, in prep) are lower than expected compared to the optical SEDs, suggesting a fraction of ionizing photons from the stellar continuum are escaping the strict confines of the clusters before ionizing hydrogen, that would have otherwise contributed to the measured ionized gas emission (i.e. H, Pa, and radio). The ’s of SSCs 1 and 2 derived from SED fitting ( mag) also indicate the existence of low-extinction regions that provide relatively unobscured lines-of-sight into the embedded clusters. The corrected, intrinsic ionizing luminosities of SSCs 1 and 2 are each (the equivalent of O7.5 V stars) and they each have total stellar masses of .
-
3.
An -band (F791W, m) excess with respect to model SEDs is observed for all of the SSCs in SBS 0335-052. The -band magnitudes are mag brighter than the model predictions. A similar result was found in the young massive clusters in NGC 4449 (Reines et al., 2008) and attributed to a photoluminescent process known as Extended Red Emission. We hypothesize that the same mechanism dominates the -band excess in SBS 0335-052.
-
4.
All of the SSCs have red near-IR (m) colors and large near-IR excesses with respect to model SEDs fit to the optical photometry. The red near-IR colors, however, are quantitatively different (redder) in the youngest SSCs (1 and 2) compared to the older SSCs (3-6), clearly indicating a different origin for the red colors. We have demonstrated that the near-IR light from the older clusters is dominated by evolved red supergiants, whereas the near-IR light from the youngest clusters is dominated by hot dust emission. The young SSCs 1 and 2 are also the only radio-detected clusters in the galaxy (Johnson, Hunt, & Reines, in prep).
-
5.
We have proposed a scenario that can account for the apparently discrepant extinction estimates found in the literature for the starburst region encompassing the youngest SSCs (1 and 2) in SBS 0335-052. Our picture is consistent with all of the emission (at all wavelengths) being associated with the optically visible SSCs 1 and 2, and is based on our calculated absorptions of the optical and IR recombination lines relative to the (thermal) free-free radio emission (Johnson, Hunt, & Reines, in prep). We find that an ISM containing dense dust clumps harbouring large grains (m), with a dust clump covering factor of , can account for the absorption of the optical/near-IR recombination lines relative to the radio, as well as the large extinctions derived from previous mid-IR observations. Interclump regions containing diffuse dust can account for the low measured extinctions derived from optical/near-IR observations.
The main goal of this case study was to investigate the formation of massive star clusters in an extremely low metallicity environment that might be analogous to conditions in which the now ancient globular clusters were born. In general, the formation of massive star clusters in SBS 0335-052 appears to be similar to that found in higher metallicity counterparts, e.g. Henize 2-10 and Haro 3 (Johnson & Kobulnicky, 2003; Johnson et al., 2004). These galaxies are all blue compact dwarfs (BCDs), and each of them currently hosts radio-detected massive star clusters with ages Myr and masses of , all of which are consistent with evolving into globular clusters in several billion years. Perhaps even the low metal abundance in SBS 0335-052 is insufficiently extreme to reflect primordial star formation; in fact, models predict that the transition from metal-free massive Population III stars to “normal” (less massive) Population II occurs at (Mackey et al., 2003; Bromm & Larson, 2004). On the other hand, large metallicity fluctuations because of radiative feedback effects may enable “hidden” Population III star formation at slightly higher metal abundances (Tornatore et al., 2007). Clearly more detailed studies need to be carried out on metal-poor star-forming galaxies in the Local Universe, and comparative samples need to be obtained in order to investigate interactions and trends among star cluster and dust formation, environment, and metal enrichment.
References
- Brodie & Strader (2006) Brodie, J. P., & Strader, J. 2006, ARA&A, 44, 193
- Bromm & Larson (2004) Bromm, V., & Larson, R. B. 2004, ARA&A, 42, 79
- Bromm & Loeb (2003) Bromm, V., & Loeb, A. 2003, Nature, 425, 812
- Calzetti et al. (2000) Calzetti, D., Armus, L., Bohlin, R. C., Kinney, A. L., Koornneef, J., & Storchi-Bergmann, T. 2000, ApJ, 533, 682
- Cardelli et al. (1989) Cardelli, J. A., Clayton, G. C., & Mathis, J. S. 1989, ApJ, 345, 245
- Condon (1992) Condon, J. J. 1992, ARA&A, 30, 575
- Dale et al. (2001) Dale, D. A., Helou, G., Neugebauer, G., Soifer, B. T., Frayer, D. T., & Condon, J. J. 2001, AJ, 122, 1736
- Darbon et al. (1998) Darbon, S., Perrin, J.-M., & Sivan, J.-P. 1998, A&A, 333, 264
- Fall & Rees (1985) Fall, S. M., & Rees, M. J. 1985, ApJ, 298, 18
- Fall & Zhang (2001) Fall, S. M., & Zhang, Q. 2001, ApJ, 561, 751
- Fitzpatrick (1985) Fitzpatrick, E. L. 1985, ApJ, 299, 219
- Fitzpatrick & Massa (1990) Fitzpatrick, E. L., & Massa, D. 1990, ApJS, 72, 163
- Freeman & Bland-Hawthorn (2002) Freeman, K., & Bland-Hawthorn, J. 2002, ARA&A, 40, 487
- Fruchter & Hook (2002) Fruchter, A. S., & Hook, R. N. 2002, PASP, 114, 144
- Gordon et al. (1997) Gordon, K. D., Calzetti, D., & Witt, A. N. 1997, ApJ, 487, 625
- Harris (1991) Harris, W. E. 1991, ARA&A, 29, 543
- Houck et al. (2004) Houck, J. R., et al. 2004, ApJS, 154, 211
- Hunt et al. (2005) Hunt, L., Bianchi, S., & Maiolino, R. 2005, A&A, 434, 849
- Hunt et al. (2004) Hunt, L. K., Dyer, K. K., Thuan, T. X., & Ulvestad, J. S. 2004, ApJ, 606, 853
- Hunt et al. (2001) Hunt, L. K., Vanzi, L., & Thuan, T. X. 2001, A&A, 377, 66
- Ivezic & Elitzur (1997) Ivezic, Z., & Elitzur, M. 1997, MNRAS, 287, 799
- Ivezic et al. (1999) Ivezic, Z., Nenkova, M., & Elitzur, M. 1999, User Manual for DUSTY (Lexington: Dept. Phys. Astron., Univ. Kentucky)
- Izotov et al. (2001) Izotov, Y. I., Chaffee, F. H., & Schaerer, D. 2001, A&A, 378, L45
- Izotov et al. (1990) Izotov, I. I., Guseva, N. G., Lipovetskii, V. A., Kniazev, A. I., & Stepanian, J. A. 1990, Nature, 343, 238
- Izotov et al. (1997) Izotov, Y. I., Lipovetsky, V. A., Chaffee, F. H., Foltz, C. B., Guseva, N. G., & Kniazev, A. Y. 1997, ApJ, 476, 698
- Johnson, Hunt, & Reines (in prep) Johnson, K. E., Hunt, L. K., & Reines, A. E. 2008, in prep
- Johnson et al. (2004) Johnson, K. E., Indebetouw, R., Watson, C., & Kobulnicky, H. A. 2004, AJ, 128, 610
- Johnson & Kobulnicky (2003) Johnson, K. E., & Kobulnicky, H. A. 2003, ApJ, 597, 923
- Kennicutt (1998) Kennicutt, R. C., Jr. 1998, ARA&A, 36, 189
- Kim et al. (1994) Kim, S.-H., Martin, P. G., & Hendry, P. D. 1994, ApJ, 422, 164
- Krist & Hook (2004) Krist, J., & Hook, R. 2004, The Tiny Tim User’s Guide (Baltimore: STScI)
- Kroupa (2001) Kroupa, P. 2001, MNRAS, 322, 231
- Leitherer et al. (1999) Leitherer, C., et al. 1999, ApJS, 123, 3
- Mackey et al. (2003) Mackey, J., Bromm, V., & Hernquist, L. 2003, ApJ, 586, 1
- Maiolino & Natta (2002) Maiolino, R., & Natta, A. 2002, Ap&SS, 281, 233
- McCrady et al. (2003) McCrady, N., Gilbert, A. M., & Graham, J. R. 2003, ApJ, 596, 240
- Melnick et al. (1992) Melnick, J., Heydari-Malayeri, M., & Leisy, P. 1992, A&A, 253, 16
- Misselt et al. (1999) Misselt, K. A., Clayton, G. C., & Gordon, K. D. 1999, ApJ, 515, 128
- Osterbrock (1989) Osterbrock, D. E., Astrophysics of Gaseous Nebulae and Active Galactic Nuclei (Mill Valley: University Science Books)
- Peebles & Dicke (1968) Peebles, P. J. E., & Dicke, R. H. 1968, ApJ, 154, 891
- Perrin & Sivan (1992) Perrin, J.-M., & Sivan, J.-P. 1992, A&A, 255, 271
- Pickles (1998) Pickles, A. J. 1998, PASP, 110, 863
- Plante & Sauvage (2002) Plante, S., & Sauvage, M. 2002, AJ, 124, 1995
- Pustilnik et al. (2001) Pustilnik, S. A., Brinks, E., Thuan, T. X., Lipovetsky, V. A., & Izotov, Y. I. 2001, AJ, 121, 1413
- Reines et al. (2008) Reines, A. E., Johnson, K. E., & Goss, W. M. 2008, AJ, 135, 2222
- Santoro & Shull (2006) Santoro, F., & Shull, J. M. 2006, ApJ, 643, 26
- Schlegel et al. (1998) Schlegel, D. J., Finkbeiner, D. P., & Davis, M. 1998, ApJ, 500, 525
- Thompson et al. (2006) Thompson, R. I., Sauvage, M., Kennicutt, R. C., Jr., Engelbracht, C. W., & Vanzi, L. 2006, ApJ, 638, 176
- Thuan et al. (1997) Thuan, T. X., Izotov, Y. I., & Lipovetsky, V. A. 1997, ApJ, 477, 661
- Thuan et al. (1999) Thuan, T. X., Sauvage, M., & Madden, S. 1999, ApJ, 516, 783
- Tornatore et al. (2007) Tornatore, L., Ferrara, A., & Schneider, R. 2007, MNRAS, 382, 945
- Tumlinson (2007) Tumlinson, J. 2007, ApJ, 665, 1361
- Vacca et al. (1996) Vacca, W. D., Garmany, C. D., & Shull, J. M. 1996, ApJ, 460, 914
- Vandenberg et al. (1996) Vandenberg, D. A., Stetson, P. B., & Bolte, M. 1996, ARA&A, 34, 461
- van Hoof et al. (2004) van Hoof, P. A. M., Weingartner, J. C., Martin, P. G., Volk, K., & Ferland, G. J. 2004, MNRAS, 350, 1330
- Vanzi et al. (2000) Vanzi, L., Hunt, L. K., Thuan, T. X., & Izotov, Y. I. 2000, A&A, 363, 493
- Whitmore (2003) Whitmore, B. C. 2003, A Decade of Hubble Space Telescope Science, 153
- Whitmore et al. (2007) Whitmore, B. C., Chandar, R., & Fall, S. M. 2007, AJ, 133, 1067
- Whitney et al. (2003) Whitney, B. A., Wood, K., Bjorkman, J. E., & Wolff, M. J. 2003, ApJ, 591, 1049
- Witt & Vijh (2004) Witt, A. N., & Vijh, U. P. 2004, Astrophysics of Dust, 309, 115