Spectrophotometric properties of pre-main sequence stars: the Chamaeleontis cluster
Abstract
We present a study of flux-calibrated low-resolution optical spectroscopy of ten stars belonging to eight systems in the Myr-old Chamaeleontis ( Cha) pre-main-sequence (PMS) star cluster. Using synthetic broadband colours, narrow-band continuum, atomic and molecular lines derived from the spectra, we compare the Cha stars to a slightly older PMS cluster, the Myr-old Cha cluster, and to main-sequence dwarfs. Using synthetic VRI colours and other indices, we find that the relationship between broadband colours and spectroscopic temperature indicators for Cha cluster members is indistinguishable from that of Gyr-old dwarfs. This result is identical to that found earlier in Cha. Gravity-sensitive line indices place the cluster between the giant and dwarf sequences, and there is clear evidence that Cha stars have lower surface gravity than Cha stars. This result is consistent with Cha being the slightly younger PMS association, a few Myr younger according to the Hertzsprung-Russell (HR) diagram placement of these two clusters and comparison with PMS evolutionary grids. Late M-type Cha cluster members show a -band flux excess of mag compared to observations of standard dwarfs, which might be related to enhanced magnetic activity. A similar level of excess -band emission appears to be a ubiquitous feature of low mass members of young stellar populations with ages less than a few hundred Myr, a very similar timescale to the PMS phase of elevated relative X-ray luminosity.
keywords:
stars: pre-main-sequence — stars: fundamental parameters — open clusters and associations: individual: Chamaeleontis1 Introduction
Analysis of flux-calibrated low-resolution optical spectra is a useful method for investigating the physical properties of stars in comparison with spectra of standard stars with well-defined properties. For nearby stars and stellar associations, such observations are readily obtained even with telescopes of modest aperture (e.g., Bessell 1991; Lyo, Lawson & Bessell 2004). Using synthetic broadband colours, narrow-band continuum, atomic and molecular line indices derived from calibrated spectra, we can study temperature, surface gravity and metallicity effects, e.g. Lyo et al. (2004) showed that the relationship between colours and spectroscopic temperature indicators for the Myr-old Cha cluster was indistinguishable from that for Gyr-old disk dwarfs, although the spectra showed some evidence for higher metallicity and clear evidence for lower gravity. The latter is a consequence of the elevated location of these stars, several mag above the zero main sequence in the HR diagram. The Cha stars also displayed, like other young stellar populations, a -band flux excess attaining 0.2 mag for late-M cluster members.
By studying PMS clusters of different isochronal ages, we can use spectrophotometric techniques to address various stellar evolutionary issues, e.g. is there evidence in the spectroscopy for differences in the temperature-spectral type sequence as a function of age? Do gravity-dependent features scale with age as stellar low mass stars descend their Hayashi tracks? Is the observed -band excess in late-M PMS stars a general property of young stellar populations, and does it vary as a function of spectral type and age?
In this paper, our target group is the young Cha cluster associated with the early-type system Cha AB and the codistant, comoving star HD104237 (DX Cha). HD104237 is the nearest-known Herbig Ae star and forms at least a quintet with low mass companions based upon Chandra X-ray Observatory observations, optical/infrared imaging and spectroscopic study, some of which are likely multiple themselves (Feigelson et al. 2003; Grady et al. 2004). HD104237A itself is a spectroscopic binary with a K3 companion in an eccentric 20-d orbit (Böhm et al. 2004). The group is nearby ( pc), compact in extent ( pc) and sparsely populated, containing eight stellar systems in its central region with stars ranging in spectral type from B9 to M5. HR diagram placement of the members ages the group at Myr (Feigelson et al. 2003) when compared to Siess, Dufour & Forestini (2000) evolutionary tracks, and Myr (Luhman 2004) when using a mix of Palla & Stahler (1999), Baraffe et al. (1998) and Chabrier et al. (2000) tracks. Both the HR diagram comparisons of Feigelson et al. (2003) and Luhman (2004) assign younger ages to the early-type members of Myr. This discrepancy in age with spectral type might be a consequence of nearby low-mass companions elevating the luminosities of the early-type stars, or might serve to highlight differences between model isochrones and observational isochrones, or indicate a genuine age difference between the high-mass and low-mass stars in this cluster. Kinematic study indicates the group is another out-lying population of the Oph-Sco-Cen OB association (Feigelson et al. 2003), following groups and associations such as Cha, the TW Hya association, and the Pic moving group.
The Cha cluster presents itself then, as a slightly younger analogue of the Cha star cluster (Mamajek, Lawson & Feigelson 1999, 2000), an Myr-old compact, sparse PMS group that was studied using spectrophotometric techniques by Lyo et al. (2004). The ages of PMS clusters derived by HR diagram comparisons using competing evolutionary grids are unreliable; differences can exceed several Myr at Myr (see fig. 8 of Lyo et al. 2004). However, comparison between PMS groups using techniques such as spectrophotometry ought to reveal differences that can be interpreted as age-related trends. With an age difference of only a few Myr, comparison between the Cha and Cha groups is a demonstration of the sensitivity of such methods to rank in age various PMS populations.
2 Observations and data reduction
2.1 Calibration of the spectra
We obtained low-resolution spectra of ten members of the Cha star cluster during 2005 March using the 2.3-m telescope and double beam spectrograph (DBS) at Siding Spring Observatory (SSO). Cluster members range in spectral type from B9 to M5 (Feigelson et al. 2003; Luhman 2004). For comparison with the early-type cluster members, we obtained DBS spectra of several early-type B- and A-type stars from the Bright Star Catalogue. For comparison with the late-type members, we obtained DBS spectra of main-sequence F- to M-type dwarfs from the Gliese catalogue (Table 1). Bessell (1990) lists Gliese stars with photoelectric photometry and spectral types.
In the blue arm of the DBS, the 300B (300 line mm-1) grating gave a 2-pixel resolution of 4 Å with coverage from Å. In the red arm, the 158R (158 line mm-1) grating gave a 2-pixel resolution of 8 Å from Å. The blue and red spectra were obtained simultaneously in a pseudo-spectrophotometric mode, with the slit width set to maximize the spectral resolution and oriented to the parallactic angle to eliminate differential refraction.
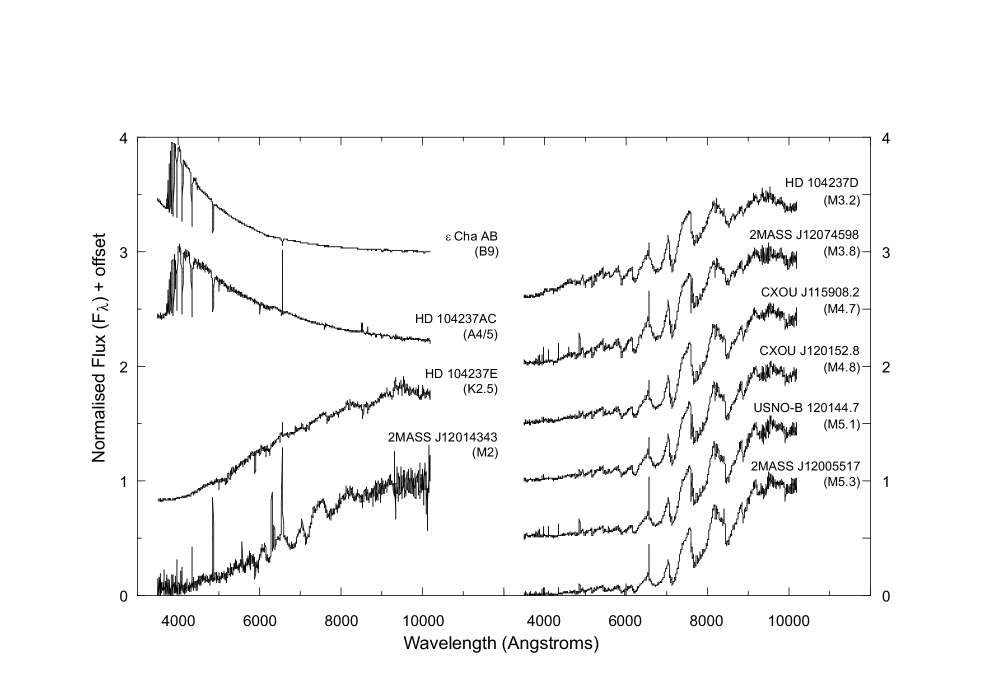
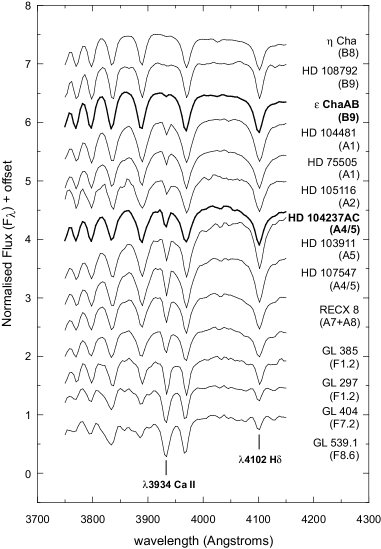
The spectra were first reduced using dome flats, bias frames and Cu-Ar arc frames after removing cosmic rays (using the automatic IRAF cosmic ray routine, or manually using imedit) and making use of standard IRAF library routines such as ccdproc and apall. Further details of the spectroscopic reduction process, in particular the removal of telluric absorption features, are described in Lyo et al. (2004). The reduced DBS flux-calibrated spectra of members of the Cha cluster are shown in Fig. 1111A file containing these spectra can be downloaded from http://www/mso.anu.edu.au/bessell/FTP/EpsCha_spectra/..
2.2 Derivation of the synthetic colours
We then obtained synthetic colours from the flux-calibrated spectra of the Cha cluster stars and the Gliese dwarfs. First, we obtained instrumental colours by integrating the spectra with normalized filter response functions in the Cousins BVRI system. Using published photoelectric photometry for the Gliese stars from Bessell (1990), reproduced in Table 1, we then derived transformation equations to convert the instrumental colours to the Cousins system. For all of the colours, the transformation equation was a linear function with a regression coefficient . Comparison of the synthetic colours derived from the spectra, to the colours obtained from the photoelectric photometry, shows the scatter of the colours averages 0.05 mag (1).
We adopted the colour as the primary broadband colour for characterizing the Cha stars since a single epoch measurement appears to better describe the stars than other colours more-affected by variability (Bouvier et al. 1993; Lawson et al. 2001, 2002), and also because the colour has been employed before to characterize the late-type dwarf spectral sequence (Bessell 1991).
| Gliese | Sp. Type | |||||||
|---|---|---|---|---|---|---|---|---|
| GL 385 | 10 11 08 | –84 50.1 | 10.28 | 0.337 | 0.226 | 0.210 | 0.431 | F1.2 |
| GL 297 | 08 05 21 | –04 22.6 | 11.22 | 0.380 | 0.216 | 0.238 | 0.452 | F1.2 |
| GL 404 | 10 51 12 | –44 08.7 | 8.08 | 0.520 | 0.300 | 0.320 | 0.620 | F7.2 |
| GL 539.1 | 14 03 48 | –74 36.9 | 6.03 | 0.580 | 0.330 | 0.320 | 0.650 | F8.6 |
| GL 550 | 14 24 10 | –51 42.6 | 7.84 | 0.700 | 0.365 | 0.345 | 0.710 | G2.7 |
| GL 500 | 13 07 00 | –21 55.3 | 7.34 | 0.730 | 0.385 | 0.370 | 0.755 | G5.3 |
| GL 511 | 13 23 56 | –24 02.0 | 8.78 | 0.930 | 0.523 | 0.465 | 0.988 | K1.9 |
| GL 545.1 | 14 18 18 | –40 09.9 | 9.00 | 1.108 | 0.641 | 0.513 | 1.152 | K4.1 |
| GL 340.3 | 09 18 16 | –05 32.4 | 9.07 | 1.156 | 0.680 | 0.568 | 1.249 | K4.4 |
| GL 489 | 12 55 07 | –14 11.6 | 9.13 | 1.120 | 0.674 | 0.585 | 1.256 | K4.4 |
| GL 542.2 | 14 16 20 | –06 22.1 | 9.09 | 1.316 | 0.799 | 0.711 | 1.508 | K6.3 |
| GL 296 | 07 58 15 | –39 53.5 | 9.65 | 1.350 | 0.823 | 0.765 | 1.589 | K6.8 |
| GL 334 | 09 04 20 | –08 36.5 | 9.50 | 1.470 | 0.914 | 0.905 | 1.820 | M0.2 |
| GL 508.3 | 13 21 07 | –13 46.8 | 11.79 | 1.410 | 0.900 | 0.987 | 1.885 | M0.5 |
| GL 341 | 09 20 42 | –60 04.5 | 9.49 | 1.502 | 0.941 | 1.008 | 1.949 | M0.9 |
| GL 433 | 11 32 58 | –32 15.1 | 9.84 | 1.521 | 1.000 | 1.150 | 2.154 | M2.0 |
| GL 333 | 08 57 54 | –47 15.0 | 12.18 | 1.560 | 1.015 | 1.190 | 2.208 | M2.2 |
| GL 298 | 08 08 42 | –52 49.7 | 11.81 | 1.515 | 1.083 | 1.384 | 2.473 | M3.0 |
| GL 543 | 14 16 36 | –07 03.8 | 13.48 | 1.622 | 1.095 | 1.392 | 2.486 | M3.0 |
| GL 300 | 08 10 31 | –21 23.5 | 12.16 | 1.640 | 1.257 | 1.648 | 2.902 | M4.1 |
| GL 514.1 | 13 27 29 | –08 26.6 | 14.33 | 1.680 | 1.320 | 1.720 | 3.040 | M4.3 |
| GL 473 | 12 30 51 | 09 17.6 | 12.49 | 1.840 | 1.555 | 1.960 | 3.520 | M5.2 |
| GL 406 | 10 54 06 | 07 19.2 | 13.53 | 1.990 | 1.856 | 2.177 | 4.032 | M5.9 |
3 Temperature sequence with age
Greene & Lada (1997) suggested that the effective temperature scale of PMS stars is likely to be similar to that appropriate for dwarfs or subgiants since the surface gravities of PMS stars are more like those of main-sequence dwarfs, than those of giants. However, Luhman (1997) suggested that the correct T Tauri temperature scale should be constrained between that of dwarfs and giants since the surface gravity of T Tauri stars appears to be intermediate between that of dwarfs and giants.
In Lyo et al. (2004), we concluded that the relationship between colours and spectroscopic temperature indicators for members of the Myr-old Cha star cluster is indistinguishable from that of the Gyr-old main-sequence dwarfs. Accordingly, in that paper we adopted dwarf colour-spectral type conversions for the Cha stars. This result was obtained through studies of the broad-band colours, narrow-band continuum and temperature-sensitive spectral indices, using spectra obtained with the same telescope and instrument as we have used to obtain observations of members of the Cha star cluster.
In the following sub-sections, we investigate how spectroscopic temperature indicators behave in a younger, Myr-old, PMS star cluster, in comparison to the results obtained previously for Cha.
3.1 Broad-band synthetic colours
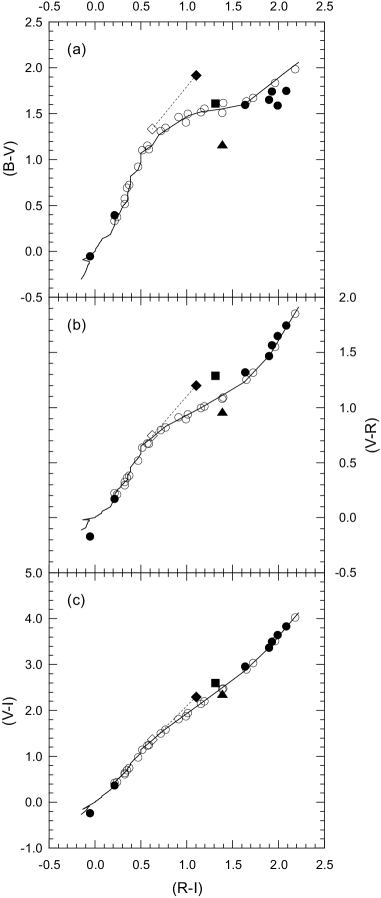
In Fig. 2, we show colour-colour diagrams for Cha cluster stars and Gliese dwarfs produced using synthetic colours derived from our calibrated spectra. In these panels, the solid lines represent the locus of B0 – M6 dwarfs in each of these colour-colour planes, using photoelectric photometry compiled by Kenyon & Hartmann (1995) and Bessell (1991). We generally see very close agreement between the synthetic colours of both groups of stars and the locus of main-sequence colours. In particular, the Gliese dwarfs we observed have colours that are well-matched to the dwarf photometric sequences. This is important for our later discussion, as we will compare indices derived from the spectra of the Gliese stars, to those derived from the spectra of the Cha stars.
In Fig. 2(a) the principal difference of note is the lower colour seen in low mass Cha stars compared to the dwarf sequence. This is indicative of a -band excess of mag in the PMS stars, since their colours are indistinguishable from the dwarf sequence. We further discuss the -band excess in Section 5.
Three other Cha stars show deviations from the dwarf sequence in one or more of the panels. Filled diamonds represent the observed colours of HD104237E, whereas open diamonds show extinction-corrected colours assuming mag (Feigelson et al. 2003). The extinction-corrected colours show good agreement with the dwarf sequence. Filled squares represent 2MASS J12014343-7835472; the abnormal colours (and spectrum; see Fig. 1) of the star might be due to the star being observed through an edge-on disk (Luhman 2004). We confirm the youth of the star through an observed high level of H emission ((H) 80 Å) and 6300, 6360 Å [OI] forbidden emission (Fig. 1). Filled triangles represent HD104237D; the apparent blue excess in the observed colours of the star is due to contamination from its Herbig Ae primary HD104237A, 8 mag brighter in -band than HD104237D and only 10′′ distant. Other late-type Cha stars show no evidence for reddening, as they display broadband colours consistent with their spectral type (Feigelson et al. 2003; Luhman 2004).
3.2 Temperature-sensitive narrow-band continuum and spectral line indices
Each spectral line stores information about the pressure (surface gravity), effective temperature and chemical abundance (metallicity) of a star, important parameters in understanding stellar structure and evolution. However, it is not straightforward to obtain individual physical properties because in each line all of these properties are intermixed and affect the strength of these features together.
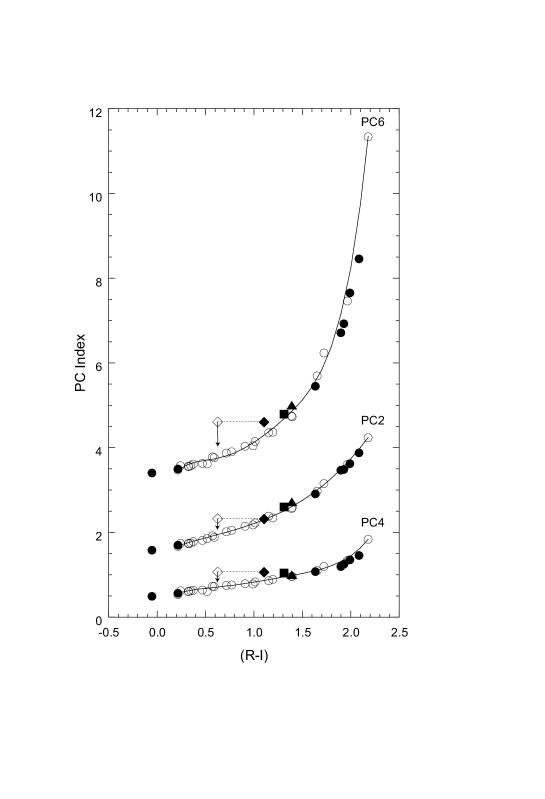
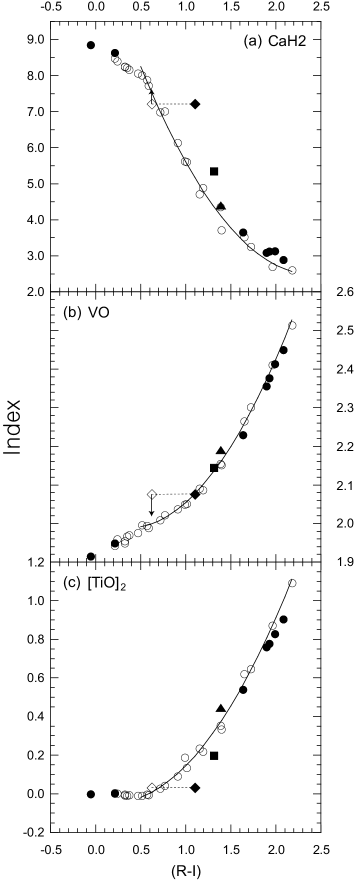
In this section, we consider temperature-sensitive narrow-band continuum and spectral line indices which ought to give correlations comparable to broadband colours, since these are usually interpreted astrophysically as a temperature sequence. We adopted six temperature-sensitive indices and list them in Table 2. Three are ’pseudo-continuum’ (PC) spectral ratios that measure the average continuum levels of the spectrum across restricted wavelength intervals in a manner comparable to narrow-band photometry (Martín et al. 1996, 1999), and three are temperature-sensitive spectral line indices defined from CaH (Reid, Hawley & Gizis 1995), VO (Martín et al. 1999) and TiO (Kenyon et al. 1998) molecular band flux ratios.
Figs 3 and 4 compare these six indices for Cha cluster stars and main-sequence dwarfs from the Gliese catalogue as a function of their broadband colour. Solid-lines in each panel are a consequence of fitting the dwarf data with a low-order polynomial in order to define the dwarf sequence. In both figures, we see that the three PC indices and the three molecular spectral indices are well-matched between the two groups of stars, except sometimes for 2MASS J12014343-7835472, HD104237D and HD104237E for reasons that were discussed in Section 3.1.
| Index | Definition |
|---|---|
| Temperature-sensitive indices | |
| PC2 | / |
| PC4 | / |
| PC6 | / |
| CaH2 | / |
| VO1 | / |
| VO2 | / |
| VO | VO1 + VO2 |
| TiO | log[/()] |
| Gravity-sensitive indices | |
| NaI | / |
| FeH2 | / |
| Temperature index for A-type stars | |
| CaII | / |
| H | / |
3.3 Spectral types of the late-type stars
Table 3 lists the synthetic colours for the late-type stars, along with spectral types derived from the colour (Fig. 2), the average of the PC ratios (Fig. 3), and the CaH, VO and TiO molecular band strengths (Fig. 4) in comparison to the dwarf sequence provided by observations of Gliese disk dwarfs. The adopted spectral types for these stars are average values. Overall, there is good agreement between the different temperature indices, with scatter for most stars at the sub-type level. The exceptions are 2MASS J12014343-7835472 (star with a possible edge-on disk) and HD104237E (star with significant reddening). For 2MASS J12014343-7835472 we adopt a spectral type based on molecular line information only, not from the broad- and narrow-bands colours since their continua are affected by the presence of the disk. For HD104237E, the adopted K2.5 spectral type is the average of spectral estimates given by Feigelson et al. (2003) and Grady et al. (2004). For the other star with some unusual colours, HD104237D, the temperature-sensitive indices appear unaffected as we see no evidence that the spectrum is contaminated at wavelengths beyond 6000Å by the nearby bright HD104237A.
| Synthetic Colours | Spectral Types | |||||||||||
|---|---|---|---|---|---|---|---|---|---|---|---|---|
| Star | PC | CaH2 | VO | [TiO]2 | CaII(H) | Adopted | ||||||
| ChaAB | – | – | – | – | – | – | – | – | – | B9 | B9 | |
| HD 104237A | – | – | – | – | – | – | – | – | – | A4(A5) | A4/5 | |
| HD 104237E | 1.92: | 1.20: | 2.31: | 1.10: | – | – | K5.7: | M1.4: | K6.6: | – | K2.5 | |
| 2MASS J12014343–7835472 | 1.62: | 1.40(1.29): | 2.59(2.61): | 1.19(1.31): | – | – | M1.2: | M2.9: | M1.6: | – | M2: | |
| HD 104237D | 1.17: | 0.97: | 2.37: | 1.39 | M3.0 | M3.3 | M2.9 | M3.3 | M3.4 | – | M3.2 | |
| 2MASS J12074597–7816064 | 1.60 | 1.32 | 2.97 | 1.63 | M4.1 | M3.9 | M3.3 | M3.8 | M3.8 | – | M3.8 | |
| CXOU J115908.2–781232 | 1.66 | 1.47 | 3.38 | 1.89 | M5.0 | M4.6 | M4.6 | M4.8 | M4.8 | – | M4.7 | |
| CXOU J120152.8–781840 | 1.75 | 1.57 | 3.51 | 1.92 | M5.1 | M4.8 | M4.4 | M4.9 | M4.8 | – | M4.8 | |
| USNO-B120144.7–781926 | 1.60 | 1.65 | 3.66 | 1.99 | M5.2 | M5.2 | M4.4 | M5.2 | M5.0 | – | M5.1 | |
| 2MASS J12005517–7820296 | 1.76 | 1.75 | 3.85 | 2.08 | M5.5 | M5.3 | M4.8 | M5.4 | M5.3 | – | M5.3 | |
3.4 Spectral types of the early-type stars
For the two early-type systems in the cluster, Cha AB and HD104237A, we adopted line indices derived from the 3934Å Ca II and 4102Å H absorption lines as temperature-sensitive and therefore spectral type indicators (Hernández et al. 2004). Table 2 lists the working definition of each index.
Instead of plotting the indices, we show the spectra of the stars stacked by derived spectral type. Fig. 5 shows low-resolution spectra () obtained from blue arm DBS observations of the two early-type stars in the Cha cluster ( ChaAB and HD 104237A), the three early-type in the Cha cluster ( Cha, HD 75595 and RS Cha), five B- and A-type stars listed in the Bright Star Catalogue, and four F-type stars from the Gliese Catalogue. We can clearly see that the strength of Ca II absorption line becomes stronger with later spectral type (decreasing temperature), while the strength of H becomes weaker. However, we need to exercise caution when estimating the spectral types for Herbig stars, since these lines can be filled with emission. We discuss the effect of emission in-fill further below.
ChaAB is a binary system consisting of a B9 primary and an early A-type secondary with separation variously reported between 0.45′′ and 1.9′′ (McAlister et al. 1990; ESA 1997; Worley & Douglass 1997; Dommanget & Nys 2002). The primary star is not a Herbig Be star even though it is likely coeval with the other early-type cluster member, the Herbig Ae star HD104237 (Hu et al. 1991; Knee & Prusti 1996; Eggen 1998). Accordingly we assume there is no contamination of the Ca II and H lines due to emission, and we can confirm the published spectral type, B9, for this star by comparison with those of standards.
There has been a discrepancy in the spectral type of HD 104237A, perhaps a consequence of different spectral typing methods. Published spectral types include: A4IVe (Hu et al. 1991), A4 – A5Ve (Blondel et al. 1993), A7IVe (Brown et al. 1997), and A7.5 – A8Ve (Grady et al. 2004). In deriving a spectral type for this object using Ca II and H absorption lines we should consider the possibility of contamination from emission. Other spectral features are clearly in emission; Fig. 1 shows emission in H and the Ca II triplet (8498 Å , 8542 Å , 8662 Å ). However, for A-type stars such as HD104237A the reverse relationship in the strength of Ca II and H with increasing spectral type (decreasing temperature) enables us to constrain the spectral type of this star, even if these lines are partly filled by emission. Contamination by emission of the Ca II line would lead to the deduction of a earlier spectral type since the equivalent width of the line increases with increasing spectral type, whereas contamination by emission of H would lead to a later spectral type since the equivalent width of the line decreases with increasing spectral type. For HD104237A we obtained a spectral type of A4 from the Ca II line and A5 from the H line, suggesting that emission is not significantly distorting the profiles of these lines. Therefore we adopt a spectral type of A4/A5 for this star, and note that this result is consistent with the majority of the spectral types assigned by previous studies.
4 Gravity trend with age
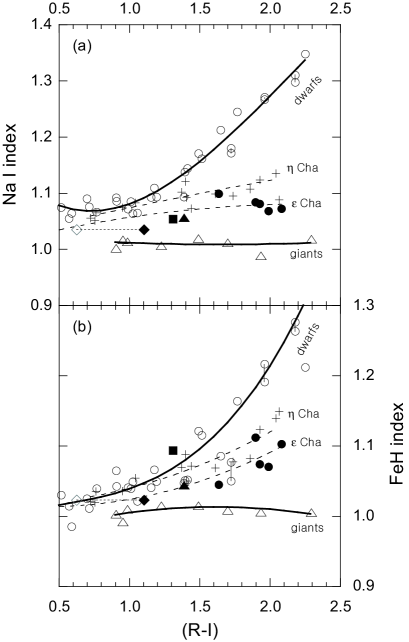
From comparison of the broadband synthetic colours (), narrowband continuum (PC indices), and molecular spectral bands (CaH, VO and TiO) between the young Cha cluster and old disk dwarfs, we found the spectroscopic properties of these two groups of stars to be essentially identical; see Figs 2, 3 and 4 and their associated text. However, in detail we see the difference in gravity sensitive atomic- and molecular lines between these two groups of objects. Fig. 6 shows the difference in the strength of the 8183, 8195 Na I doublet and 9896 FeH molecular band for the Cha cluster, the Cha cluster, disk dwarfs, and M giants. Table 2 lists the working definition for each index.
For both gravity-sensitive indices, the distribution for Cha stars, like that for Cha stars, occupies the region between well-defined dwarf and giant sequences. This indicates, for both these PMS groups, intermediate surface gravities between those of giants and dwarfs. Amongst the late-M stars, there is also a clear tendency for Cha stars to have weaker gravity indicators than Cha stars of similar spectral type. This result is consistent with the Cha stars being a younger PMS group than Cha.
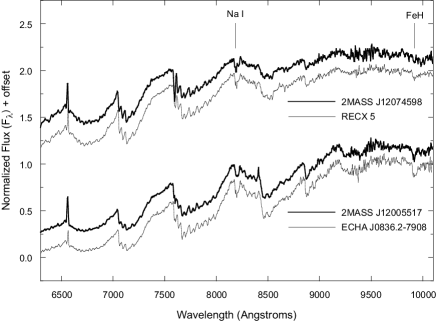
We provide a visual comparison of the gravity-sensitive features in Fig. 7, where we compare spectra of two late-type Cha and two Cha cluster members of similar spectral type, as determined from their broad-band colours and temperature-sensitive indices. The comparison clearly shows that the strength of gravity-sensitive spectral lines such as the 8183, 8195 Na I doublet and 9896 FeH is weaker in the younger Cha stars compared to the Cha stars.
5 Blue excess in low-mass PMS stars
Late-M stars in the Cha cluster show a colour excess of mag compared to observations of Gliese stars and the dwarf colour sequence; see Fig. 2(a). This result is consistent with that seen in late-M stars in the Cha cluster (Lyo et al. 2004; see their fig. 2), suggesting that it might be a general property of young stellar objects.
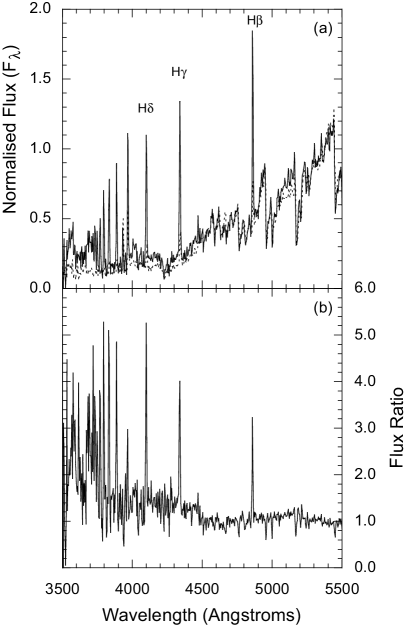
Fig. 8 shows that the flux excess is in the -band (centred at Å) and -band (centred at Å) and not the result of a flux deficit in the -band (centred at Å). In Fig. 8(a) we compare spectra of the Cha cluster member USNO-B120144.7–781926 and a Gliese main-sequence dwarf of similar spectra type, GL 473 . In Fig. 8(b), where we show the ratio of these spectra after normalizing them at Å, we see that the main source of the blue excess is enhanced blue continuum, though the spectrum of the cluster member shows prominent Balmer and Ca II H and K emission as well. Despite the presence of these strong blue emission lines, the star shows a typical level of -band excess in Fig. 2(a).
A blue excess has been documented in Pleiades K-type stars for over 40 years (Herbig 1962; Jones 1972; Landolt 1979; Stauffer 1980; van Leeuwen et al. 1987) and in G- to K-type stars in other intermediate-aged open clusters, such as Persei, NGC 2516, IC 2602 and Lyrae. Combined results for the Myr-old Cha cluster (this paper), Myr-old Cha cluster (Lyo et al. 2004), Myr-old Pleiades (Stauffer et al. 2003) and the Myr-old NGC 2516 (Sung et al. 2002), show a tendency for increasing blue excess with decreasing stellar mass/temperature, i.e. a 0.1 mag excess for K- to early M-type stars increasing to a 0.2 mag excess for late-M stars. However, for stars of a given type there appears to be no significant dependence on the level of excess as a function of stellar age in systems that have been studied with ages between several Myr and Myr.
The cause of the blue excess in young stellar populations has been suggested to be the result of enhanced chromospheric activity (Sung et al. 2002), or alternatively the spottedness of stars resulting from convection and rapid rotation (Stauffer et al. 2003). We consider each of these possibilities in turn.
Enhanced X-ray activity exceeding the solar level by several orders of magnitude (measured as a function of the fractional X-ray luminosity ) is a general property of low-mass PMS stars (Feigelson & Montmerle 1999; Feigelson et al. 2002; Favata & Micela 2003; Güdel 2004). From observations of stars in the Orion Nebular Cloud, NGC 2264, Chamaeleon I, Pleiades, Hyades, and Gyr-old disk stars, i.e. stellar populations ranging in age from 1 Myr to several Gyr, Preibisch & Feigelson (2005) found that for M-type stars the ratio and the X-ray surface flux decreases only mildly for the first Myr. The decay in X-ray activity was found to be more-pronounced for G-, F-, and K-type stars. However, the maintenance of high X-ray activity levels until Myr suggests that the enhanced chromospheric activity might be the dominant mechanism responsible for the blue excess, since this timescale closely corresponds to our finding that the blue excess is present across the PMS phase from ages of several Myr to a few hundred Myr.
In much older populations, X-ray activity is seen to have decayed significantly in the Myr-old Hyades cluster and in Gyr-old Galactic field stars, particularly amongst the higher-mass objects. This result seems consistent with the non-detection of the blue excess for K-types stars in the Myr-old Praesepe group (Stauffer et al. 2003). Studying K- and M-type stars in clusters with ages between 200 Myr and Gyr would be useful to investigate the decay in the blue excess as a function of stellar mass and X-ray activity.
Light-curve studies of weak-lined T Tauri (WTT) stars of the Taurus-Auriga cloud region (Bouvier et al. 1993) and the TW Hydrae Association (Lawson & Crause 2005) show a increase in photometric amplitude with decreasing wavelength. However, there is no observational evidence that starspots induce bluer colours in low-mass PMS stars. The observations of Bouvier et al. suggest that the colour becomes redder due to the presence of cool starspots, if they are the primary source of the photometric variability in PMS stars as is the case in non-accreting or low-level accreting WTT stars. High levels of mass accretion resulting in variability driven by accretion hotspots as seen in classical T Tauri stars is a phenomenon of only the youngest PMS populations. Accretion largely disappears in PMS stars by 10 Myr and this cannot be a universal solution for the blue excess.
6 Summary and Conclusions
Flux-calibrated low-resolution optical spectroscopy is an indispensable tool for investigating the physical properties of stars by comparison with other stellar groups and standard star calibrators. In this paper, we characterized the stellar population of the Myr-old Cha cluster via a number of temperature- and gravity-sensitive spectroscopic indicators, and compared its properties to the slightly older PMS group associated with Cha, and to those of Gyr-old disk dwarfs.
Using synthetic broadband colours, narrow-band continuum, atomic and molecular line indices derived from the spectra, we find that the relationship between the broadband colours and spectroscopic temperature indicators for the Cha cluster stars is indistinguishable from that of the Gyr-old dwarfs. We had previously reached the same conclusion for the slightly-older Cha cluster (Lyo et al. 2004). However, there is a clear evidence that Cha cluster stars have lower surface gravity than Cha cluster stars from measurement of the gravity-sensitive 8183, 8195 Na I doublet and FeH molecular spectral lines. This result is consistent with the Cha cluster being slightly younger than Cha, a few Myr younger according to the HR diagram placement of these two clusters and comparison with PMS evolutionary model grids.
We also found a -band excess of mag in the late M-type cluster members, similar to that found in Cha and in other PMS populations with ages less than Myr. This result suggests that the blue excess is an ubiquitous property of low-mass young stellar objects, with the most-likely origin being enhanced magnetic activity. The presence of significant excess blue emission appears to closely parallel the phase of high relative X-ray luminosity seen in low-mass Myr-old PMS populations.
Acknowledgments
ARL and WAL thank the REsearch School of Astronomy and Astrophysics for the award of telescope time at SSO for this project. WAL’s research is supported by UNSW@ADFA Faculty Research and Special Research Grants. We thank the referee, Dr R. D. Jeffries, for making a number of very useful comments on the paper.
References
- Baraffe et al. (1998) Baraffe I., Chabrier G., Allard F., Hauschildt P.H., 1998, A&A, 337, 403
- Bessell (1990) Bessell M. S., 1990, A&AS, 83, 357
- Bessell (1991) Bessell M. S., 1991, AJ, 101, 662
- Blondel (1993) Blondel P. F. C., Talavera A., Tjin A Djie H. R. E., 1993, A&A, 268, 624
- Boḧm et al. (2004) Böhm T., Catala C., Balona L., Carter B., 2004, A&A, 427, 907
- Bouvier et al. (1993) Bouvier J., Cabrit S., Fernández M., Martín E. L., Matthews J. M., 1993, A&A, 272, 176
- Charbrier (2000) Chabrier G., Baraffe I., Allard F., Hauschildt P., 2000, ApJ, 542, 464
- Dommanget (2002) Dommanget J., Nys O., 2002, Observations et Travaux, 54, 5
- Eggen (1998) Eggen O. J., 1998, AJ, 116, 1314
- ESA (1997) ESA 1997, The Hipparcos and Tycho Catalogues, ed. M. A. C. Perryman (ESA SP-1200; Noordwijk: ESA)
- Favata (2003) Favata F., Micela G., 2003, Space Sci. Rev., 108, 577
- Feigelson (2002) Feigelson E. D., Garmire G. P., Pravdo S. H., 2002, ApJ, 572, 335
- Feigelson (1999) Feigelson E. D., Montmerle T., 1999, ARA&A, 37, 363
- Feigelson, Lawson & Garmire (2003) Feigelson E. D., Lawson W. A., Garmire G. P., 2003, ApJ, 599, 1207
- Grady et al. (2004) Grady C. A., Woodgate B., Torres Carlos A. O., Henning Th., Apai D., Rodmann J., Wang Hongchi, Stecklum B., Linz H., Williger G. M., Brown A., Wilkinson E., Harper G. M., Herczeg G. J., Danks A., Vieira G. L., Malumuth E., Collins N. R., Hill R. S., 2004, ApJ, 608, 809
- Greene (1997) Greene T. P., Lada C. J., 1997, AJ, 114, 2157
- Gudel (2004) Güdel M., 2004, A&A Rev., 12, 71
- Herbig (1962) Herbig G. H., 1962, ApJ, 135, 736
- Hernandez (2004) Hernández J., Calvet N., Briceño C., Hartmann L., Berlind P., 2004, AJ, 127, 1682
- Hu et al. (1991) Hu J. Y., Blondel P. F. C., Catala C., Talavera A., Thé P. S., Tjin A Djie H. R. E., de Winter D., 1991, A&A, 248, 150
- Jones (1972) Jones B. F., 1972, ApJ, 171, L57
- Kenyon et al. (1998) Kenyon S. J., Brown D. I., Tout C. A., Berlind P., 1998, AJ, 115, 2491
- Kenyon & Hartmann (1995) Kenyon S. J., Hartmann L., 1995, ApJS, 101, 117
- Knee (1996) Knee L. B. G., Prusti T., 1996, A&A, 312, 455
- Landolt (1979) Landolt A. U., 1979, ApJ, 231, 468
- Lawson (2005) Lawson W. A., Crause L. A., 2005, MNRAS, 357, 1399
- Lawson et al. (2001) Lawson W. A., Crause L. A., Mamajek E. E., Feigelson E. D., 2001, MNRAS, 321, 57
- Lawson et al. (2002) Lawson W. A., Crause L. A., Mamajek E. E., Feigelson E. D., 2002, MNRAS, 329, L29
- Luhman (1997) Luhman K. L., 1997, Am Astr Soc., 29, 1360
- Luhman (2004) Luhman K. L., 2004, ApJ, 616, 1033
- Lyo et al. (2004) Lyo A-R., Lawson W. A., Bessell M. S., 2004, MNRAS, 355, 363
- Mamajek et al. (1999) Mamajek E.E., Lawson W.A, Feigelson E.D., 1999, ApJ, 516, L77
- Mamajek et al. (2000) Mamajek E.E., Lawson W.A, Feigelson E.D., 2000, ApJ, 544, 356
- Martín et al. (1999) Martín E. L., Delfosse X., Basri G., Goldman B., Forveille T., Zapatero-Osorio M. R., 1999, AJ, 118, 2466
- Martín et al. (1996) Martín E. L., Rebolo R., Zapatero-Osorio M. R., 1996, ApJ, 469, 706
- McAlister (1990) McAlister H., Hartkopf W. I., Franz O. G., 1990, AJ, 99, 965
- Palla & Stahler (1999) Palla F., Stahler S.W., 1999, ApJ, 525, 772
- Preibisch (2005) Preibisch T., Feigelson E. D., 2005, ApJS, 160, 390
- Reid et al. (1995) Reid I. N., Hawley S. L., Gizis J. E., 1995, AJ, 110, 1838
- Siess, Dufour & Forestini (2000) Siess L., Dufour E., Forestini M., 2000, A&A, 358, 593
- Stauffer (1980) Stauffer J. R., 1980, AJ, 85, 1341
- Stauffer et al. (2003) Stauffer J. R., Jones B. F., Backman D., Hartmann L. W., Barrado y Navascués D., Pinsonneault M. H., Terndrup D. M., Muench A. A., 2003, AJ, 126, 833
- Sung et al. (2002) Sung H., Bessell M. S., Lee B-W., Lee S-G., 2002, AJ, 123, 290
- vanLeeuwen (1987) Van Leeuwen F., Alphenaar P., Meys J. J. M., 1987, A&AS, 67, 483
- Worley (1997) Worley C. E., Douglass G. G., 1997, A&AS, 125, 523