11email: katrien@iac.es 22institutetext: Instituto de Astrofísica de Canarias, Calle Via Láctea s/n, 38205 La Laguna, Spain 33institutetext: UMR 6525 H. Fizeau, UNS, CNRS, OCA, Campus Valrose, 06108 Nice Cedex 2, France 44institutetext: Instituto de Astrofísica de Andalucía (CSIC), Apartado 3004, 18080 Granada, Spain 55institutetext: Institute of Astronomy, KULeuven, Celestijnenlaan 200D, 3001 Leuven, Belgium 66institutetext: Astronomical Institute of the Wroclaw University, ul. Kopernika 11, 51-622 Wroclaw, Poland 77institutetext: Department of Physics and Astronomy, University of Canterbury, Private Bag 4800, Christchurch, New Zealand 88institutetext: Konkoly Observatory, P.O. Box 67, 1525 Budapest, Hungary
The Dor CoRoT target HD 49434
I-Results from the ground-based campaign††thanks: Based on observations made with ESO Telescopes at the La Silla Observatory under the ESO Large Programme: LP178.D-0361, and on data collected
at the Centro Astronómico Hispano Alemán (CAHA) at Calar Alto, operated jointly by the Max-Planck
Institut für Astronomie and the Instituto de Astrofísica de Andalucía (CSIC). Also based on observations obtained at Observatorio de Sierra Nevada (Spain), at Observatorio Astronómico Nacional San Pedro Mártir (Mexico), at the Piszkéstetõ Mountain Station of Konkoly Observatory (Hungary), at Observatoire de Haute Provence (France) and at Mount John University Observatory (New Zealand).
Abstract
Context. We present the results of an extensive ground-based photometric and spectroscopic campaign on the Dor CoRoT target HD 49434. This campaign was preparatory to the CoRoT satellite observations, which took place from October 2007 to March 2008.
Aims. Whereas satellite data will be limited to the detection of low-degree pulsation modes with poor identification (no filters), ground-based data will provide eventually the identification of additional modes and, through the spectroscopic data, detection of additional high-degree modes as well as an estimate of the azimuthal number . Our aim was to detect and identify as many pulsation modes as possible from the ground-based dataset of the Dor star HD 49434, to anticipate the CoRoT results.
Methods. We searched for frequencies in the multi-colour variations, the pixel-to-pixel variations across the line profiles and the moments variations of a large dataset consisting of both multi-colour photometric and spectroscopic data from different observatories, using different frequency analysis methods. We performed a tentative mode identification of the spectroscopic frequencies using the Moment Method and the Intensity Period Search Method. We also carried out an abundance analysis.
Results. The frequency analysis clearly shows the presence of four frequencies in the 0.2–1.7 d-1 interval, as well as six frequencies in the 5–12 d-1 domain. The low frequencies are typical for Dor variables while the high frequencies are common for Sct pulsators. We propose the frequency 2.666 d-1 as a possible rotational frequency. All modes, for which an identification was possible, seem to be high-degree modes (). We did not find evidence for a possible binary nature of HD 49434. The element abundances we derived are consistent with the values obtained in previous analyses.
Conclusions. We classify the Dor star HD 49434 as a hybrid pulsator, which pulsates simultaneously in – and –modes. This finding makes HD 49434 an extremely interesting target for asteroseismic modelling.
Key Words.:
Stars: oscillations - Stars: individual: HD 49434 - Line: profiles - Stars: variables: Sct1 Introduction
We currently are in a challenging era of asteroseismology. Observers and theoreticians are preparing for the promising output of the CoRoT satellite mission (Baglin et al. 2006), which has been launched successfully in December 2006. The CoRoT science programme is twofold. A first goal of the mission involves the detection of extrasolar planets by using the transit method. The asteroseismic goal, on the other hand, aims at probing the internal structures of stars by extracting information from detected pulsation frequencies (several tens, even hundreds, of frequencies, depending on the pulsational class), and, in general, to understand better the process of stellar evolution. To this end, a selection of stars of a wide range of masses, with different evolutionary status, of different spectral type and belonging to different pulsation classes are monitored.
The CoRoT satellite mission goes hand in hand with a huge observational effort from the ground. Not only have preparatory observations been a key stone in the selection process of suitable targets for asteroseismology (Poretti et al. 2003, 2005), also now the satellite is operating from space, simultaneous ground-based observations are very important and complementary. Indeed, as CoRoT provides high-precision time-series in white light, multi-colour photometry provides colour information, which allows identification of the degree by means of amplitude ratios and phase shifts. High-resolution spectroscopy allows the detection of high-degree modes and the identification of both the degree and the azimuthal order by means of, for example, the Moment or Doppler Imaging methods. With the goal of obtaining multi-colour and spectroscopic time-series of a selection of Sct, Dor, Cep and Be CoRoT primary and secondary targets, an extended ground-based campaign, involving both high-resolution spectrographs and multi-colour photometric instruments, has been included in the scientific plan of the CoRoT mission (Catala et al. 2006; Uytterhoeven & Poretti 2007; Uytterhoeven et al. 2008).
The Dor stars are a challenging class of pulsators for several reasons. They are a fairly recently discovered pulsational group (Kaye et al. 1999) and, even though the number of class members is rapidly increasing (more than 130 candidates are known), the number of well-studied cases based on extended time-series is small. Obtaining a good phase coverage from the ground is an observationally challenging task as the intrinsic variations show periods of the order of a day (0.4–3 days). Moreover, only a few frequencies have been detected so far in individual stars, and amplitudes are fairly small (below 0.05 mag; 2 km s-1). Nevertheless, the Dor stars are promising targets for seismic studies as they show –modes, which can be used to probe the deep interior of the star. Over the last few years progress has been made in the understanding of the pulsational mechanism. Probably a flux modulation induced by the upper convective layer is the driving source for the pulsations (Guzik et al. 2000; Dupret et al. 2004; Grigahcène 2004). However, some details need clarification, such as the the thickness and the depth of the convection zone and the importance of diffusion.
The Dor stars (Spectral Type F0V-F2V) occupy an interesting region along the Main-Sequence in the Hertzsprung-Russell (HR-) diagram, being enclosed by the classical instability strip and the instability strip of the solar-like stars. An interesting investigation concerns the presence of hybrid stars, i.e. stars that exhibit both –mode and –mode oscillations, in the overlap region of the Dor and Sct instability strips (Dupret et al. 2005). Observational evidence for self-excited hybrid stars is scarce, and less than a handful genuine hybrid candidates exist, including HD 8801 (Henry & Fekel 2005), HD114839 (King et al. 2006) and BD+18 4914 (Rowe et al. 2006). The hybrid stars are of particular interest as both the envelope and the deep interior of the star can be probed through the study of –modes and –modes, respectively.
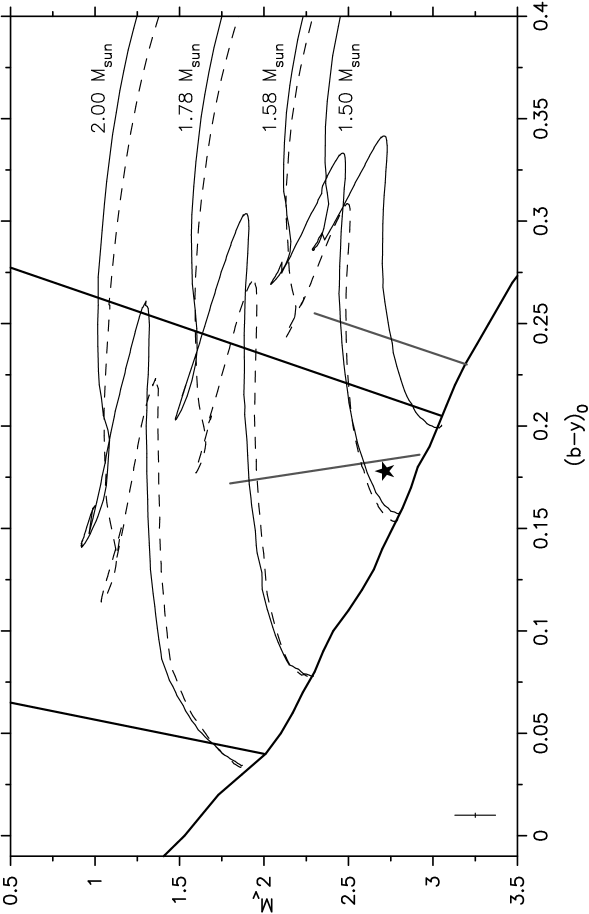
In this paper we focus on the ground-based data of the Dor star HD 49434 (V=5.75, F1V). As HD 49434 is a primary CoRoT target of a 150-days Long Run (LRa1; October 2007 – March 2008), several teams performed a detailed study of abundances and fundamental parameters of this star in the preparatory framework of the mission. Summarising their fairly consistent results, we find K, dex, , vi km s-1(Lastennet et al. 2001; Bruntt et al. 2002, 2004; Mathias et al. 2004; Masana, Jordi & Ribas 2006). Gillon & Magain (2006) derived the slightly higher values K and dex. In addition, we estimated these parameters from and Geneva photometry taken from the GCPD catalogue (General Catalogue of Photometric Data, Mermilliod et al. 1997). From the calibration of Napiwotzki et al. (1993) we obtained K, K and dex. From the Geneva indices , and as proposed by Künzli et al. (1997), we determined K and dex. Taking into account all these values of the atmospheric parameters, we will adopt in our analysis effective temperature and surface gravity equal to K and dex, respectively. From 2MASS IR photometry Masana, Jordi & Ribas (2006) estimate an angular semi-diameter of mas, and . An estimate of the mass of HD 49434 is obtained from evolutionary tracks by Bruntt et al. (2004). A first study of the intrinsic variability of HD 49434 is presented by Bruntt et al. (2002). In a time series of Strömgren data they found no clear frequencies, but reported a power excess in the frequency range typical for Dor pulsators. A line-profile analysis suggested the presence of one or several high-degree modes, in the same low frequency range. Line-profile variations were confirmed by Mathias et al. (2004). In Fig. 1 we show the position of HD 49434 in a Colour-Magnitude diagram, based on the value derived from the HIPPARCOS satellite and , calculated from the photometric indices taken from Hauck & Mermilliod (1998) using the TempLogg method (Kupka & Bruntt 2001). We used the evolutionary tracks, instability strips and ZAMS as described by Poretti et al. (2003). As can be seen, HD 49434 lies close to the blue border of the Dor instability strip, and inside the instability strip of Sct stars.
2 Observations
2.1 Multi-colour photometry
Strömgren observations were made with the twin Danish six-channel uvby photometers at Sierra Nevada Observatory (SNO), Spain, and at San Pedro Mártir Observatory (SPMO), Mexico. The instruments are mounted on the 90-cm and 1.5-m telescopes, respectively. The data were collected in the four uvby filters and exposure times were 30 s. We used HD 48922 (=6.77 mag, A0) as comparison star and HD 43913 (=7.88 mag, A0) as check star. In total we obtained 1353 data points of HD 49434 in 62 clear nights at SNO (January 2005; December 2005; January–March 2006; November 2006; January–March 2007; November–December 2007; January 2008) and 614 data points in 29 clear nights at SPMO (November 2005; November–December 2006; November-December 2007). We note that an important step in the reduction process was the correction for the instantaneous extinction coefficient, in order to suppress artificial/spurious frequencies in the 0–5 d-1 range (Poretti & Zerbi 1993). The standard deviations of the magnitude differences between the comparison and check stars (both measured in the same observational cycle) give an indication of the precision of the data. We obtained values near 12.3 mmag and 6.5 mmag ( light), 3.0 mmag and 4.2 mmag ( light), 3.0 mmag and 3.8 mmag ( light), and 3.0 mmag and 4.7 mmag ( light) for SPMO and SNO, respectively. The large scatter observed in the –light at SPMO is due to some instrumental problems with the photo-multiplier of the channel.
1
| Date | JD | data points | Date | JD | data points | Date | JD | data points | ||||||
|---|---|---|---|---|---|---|---|---|---|---|---|---|---|---|
| SNO | SPMO | KO | SNO | SPMO | KO | SNO | SPMO | KO | ||||||
| 21Mar2003 | 2720.2 | 4 | 03Mar2006 | 3798.4 | 13 | 13Mar2007 | 4173.3 | 9 | ||||||
| 22Mar2003 | 2721.2 | 7 | 06Mar2006 | 3801.4 | 7 | 17Mar2007 | 4177.3 | 16 | ||||||
| 23Mar2003 | 2722.2 | 7 | 07Mar2006 | 3802.3 | 17 | 18Mar2007 | 4178.3 | 9 | ||||||
| 24Mar2003 | 2723.2 | 7 | 08Mar2006 | 3803.3 | 10 | 22Mar2007 | 4182.3 | 15 | ||||||
| 25Mar2003 | 2724.2 | 6 | 10Nov2006 | 4049.5 | 30 | 15Nov2007 | 5519.6 | 20 | ||||||
| 20Jan2005 | 3391.3 | 32 | 11Nov2006 | 4050.5 | 25 | 16Nov2007 | 5520.5 | 25 | ||||||
| 21Jan2005 | 3392.3 | 57 | 12Nov2006 | 4051.5 | 32 | 17Nov2007 | 5521.5 | 21 | ||||||
| 22Jan2005 | 3393.3 | 59 | 13Nov2006 | 4052.5 | 32 | 28Nov2007 | 5533.4 | 39 | ||||||
| 12Nov2005 | 3686.7 | 16 | 14Nov2006 | 4053.5 | 36 | 30Nov2007 | 5535.4 | 39 | ||||||
| 13Nov2005 | 3687.7 | 22 | 15Nov2006 | 4054.6 | 17 | 02Dec2007 | 5537.4 | 12 | ||||||
| 14Nov2005 | 3688.7 | 25 | 18Nov2006 | 4057.6 | 15 | 03Dec2007 | 4437.8 | 19 | ||||||
| 15Nov2005 | 3689.7 | 23 | 20Nov2006 | 4059.6 | 21 | 23 | 04Dec2007 | 4438.6 | 12 | 27 | ||||
| 06Dec2005 | 3711.4 | 26 | 21Nov2006 | 4060.6 | 9 | 17 | 05Dec2007 | 4439.6 | 14 | 28 | ||||
| 07Dec2005 | 3712.4 | 31 | 22Nov2006 | 4061.8 | 18 | 06Dec2007 | 4440.6 | 12 | 22 | |||||
| 12Dec2005 | 3717.4 | 10 | 23Nov2006 | 4062.6 | 18 | 9 | 07Dec2007 | 4441.9 | 7 | |||||
| 13Dec2005 | 3718.4 | 8 | 24Nov2006 | 4063.6 | 13 | 16 | 08Dec2007 | 4442.8 | 5 | |||||
| 14Dec2005 | 3719.4 | 10 | 26Nov2006 | 4065.7 | 15 | 10Dec2007 | 4444.6 | 18 | ||||||
| 15Dec2005 | 3720.4 | 9 | 27Nov2006 | 4066.7 | 13 | 11Dec2007 | 4445.6 | 14 | ||||||
| 17Dec2005 | 3722.4 | 11 | 28Nov2006 | 4067.7 | 22 | 12Dec2007 | 4446.6 | 10 | ||||||
| 18Dec2005 | 3723.4 | 5 | 29Nov2006 | 4068.7 | 30 | 13Dec2007 | 4447.7 | 25 | ||||||
| 20Dec2005 | 3725.4 | 26 | 30Nov2006 | 4069.7 | 20 | 14Dec2007 | 4448.8 | 16 | ||||||
| 21Dec2005 | 3726.3 | 49 | 01Dec2006 | 4070.7 | 30 | 15Dec2007 | 4449.8 | 16 | ||||||
| 22Dec2005 | 3727.4 | 20 | 02Dec2006 | 4071.7 | 31 | 29Dec2007 | 4463.6 | 10 | ||||||
| 02Jan2006 | 3738.4 | 11 | 03Dec2006 | 4072.7 | 28 | 31Dec2007 | 4465.6 | 12 | ||||||
| 04Jan2006 | 3740.4 | 14 | 04Dec2006 | 4073.7 | 25 | 10Jan2008 | 4476.4 | 33 | ||||||
| 11Jan2006 | 3747.3 | 20 | 05Dec2006 | 4074.7 | 25 | 12Jan2008 | 4478.3 | 42 | ||||||
| 01Feb2006 | 3768.3 | 33 | 06Dec2006 | 4075.7 | 28 | 18Jan2008 | 4484.4 | 35 | ||||||
| 04Feb2006 | 3771.3 | 47 | 24Jan2007 | 4125.3 | 44 | 19Jan2008 | 4485.3 | 37 | ||||||
| 27Feb2006 | 3794.4 | 12 | 26Feb2007 | 4158.3 | 15 | 20Jan2008 | 4486.3 | 37 | ||||||
| 01Mar2006 | 3796.4 | 15 | 11Mar2007 | 4171.3 | 12 | |||||||||
In addition, Johnson UBVRI measurements were obtained with a single channel Peltier-cooled photo-electric photometer on the 50-cm Cassegrain telescope at the Piszkéstetõ Mountain Station of Konkoly Observatory (KO) from March 21 to 25, 2003. The comparison star used was again HD 48922, as well as HD 49933 (=5.78 mag, F2V). The latter comparison star, a solar-like oscillator, is actually a primary target of the CoRoT mission. Exposure times for individual data points were 15 s. Consecutive three data points were binned together to create 31 measurements with 45 s integration time each.
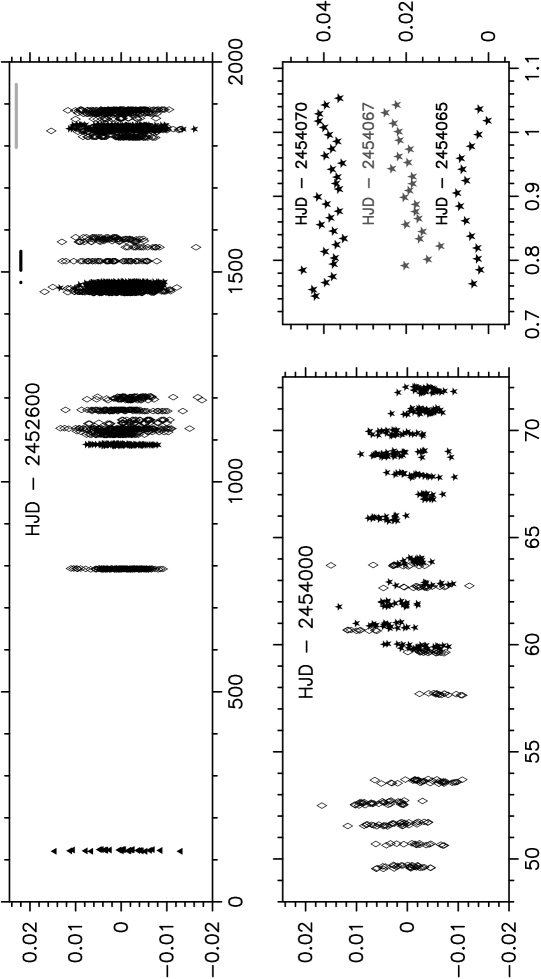
A logbook of the photometric observations is given in Table 1, which is only available in the on-line version of the paper. An example of the lightcurve is given in Fig. 2. The differential lightcurves of HD 49434 show a complicated variable behaviour with variations at different timescales.
We also included the data of the HIPPARCOS satellite (Perryman et al. 1997) in our photometric analysis.
2.2 High-resolution spectroscopy
The spectroscopic observations include data taken with FEROS@2.2-m ESO/MPI telescope, La Silla, Chile, with SOPHIE@1.93-m telescope at Observatoire de Haute Provence (OHP), France, with FOCES@2.2-m at Calar Alto Astronomical Observatory (CAHA), Spain, and with HERCULES@1.0-m McLellen Telescope at Mount John University Observatory (MJUO), New Zealand. A general logbook of the spectroscopic data of HD 49434 is given in Table 2, while a log file of the individual observing nights, only available in the on-line version of the paper, is presented in Table 3. The time distribution of the spectroscopic observations can be seen from Fig. 7. The time-span with respect to the photometric observations is indicated by a black full line in Fig. 2.
| instrument | # | # nights | T | SN | SN-range | Texp | resolution | range | spectral gaps |
|---|---|---|---|---|---|---|---|---|---|
| FOCES | 47 | 1 | 185 | 300 | 40,000 | 3500–10280 | y, redder then 8450 Å | ||
| FEROS | 71 | 14 | 240 | 120,180 | 48,000 | 3500–9200 | n | ||
| SOPHIE | 377 | 14 | 165 | 600,500,450 | 70,000 | 3870–6940 | n | ||
| HERCULES | 194 | 9 | 172 | 600,480,420 | 35,000 | 4500–7300 | y |
2.2.1 The SOPHIE instrument
The new SOPHIE spectrograph, attached to the 1.93-m telescope at OHP, is the successor of ELODIE. One of its main properties is its stability for performing asteroseismic observations. The SOPHIE spectrum, recorded on 39 non-overlapping spectral orders, ranges from 3870 to 6940 Å. The spectra were extracted and automatically reduced in real-time using a data reduction software package directly adapted from HARPS. Only the normalisation process was conducted manually, after a correction to the heliocentric frame, typically using a fit with a cubic spline.
Telescope time was attributed from January 11-20 and January 27- February 1, 2007, representing 14 nights. Only 1.5 night was lost due to meteorological conditions. The 410 SOPHIE spectra of HD 49434 were obtained in the High-Resolution mode (), as we want to focus on the study of line-profile variations (LPV).
3
| FEROS | SOPHIE | FOCES | ||||||
|---|---|---|---|---|---|---|---|---|
| Date | JD | spectra | Date | JD | spectra | Date | JD | spectra |
| 03Jan2007 | 4103.7 | 5 | 11Jan2007 | 4112.4 | 22 | 04Dec2006 | 4074.4 | 50 |
| 04Jan2007 | 4104.6 | 7 | 12Jan2007 | 4113.4 | 30 | |||
| 05Jan2007 | 4105.6 | 6 | 13Jan2007 | 4114.4 | 40 | |||
| 06Jan2007 | 4106.6 | 5 | 14Jan2007 | 4115.4 | 30 | HERCULES | ||
| 07Jan2007 | 4107.6 | 5 | 15Jan2007 | 4116.4 | 18 | Date | JD | spectra |
| 08Jan2007 | 4108.6 | 6 | 17Jan2007 | 4118.4 | 19 | 01Feb2007 | 4132.9 | 6 |
| 09Jan2007 | 4109.5 | 8 | 18Jan2007 | 4119.4 | 13 | 04Feb2007 | 4135.9 | 19 |
| 10Jan2007 | 4110.5 | 7 | 19Jan2007 | 4120.4 | 24 | 05Feb2007 | 4136.9 | 23 |
| 11Jan2007 | 4111.6 | 5 | 20Jan2007 | 4121.4 | 23 | 06Feb2007 | 4137.9 | 26 |
| 25Jan2007 | 4125.6 | 3 | 27Jan2007 | 4128.3 | 31 | 12Feb2007 | 4143.9 | 11 |
| 26Jan2007 | 4126.6 | 4 | 28Jan2007 | 4129.3 | 36 | 13Feb2007 | 4144.9 | 22 |
| 27Jan2007 | 4127.6 | 5 | 29Jan2007 | 4130.3 | 41 | 14Feb2007 | 4145.9 | 28 |
| 28Jan2007 | 4128.6 | 5 | 30Jan2007 | 4131.3 | 42 | 16Feb2007 | 4147.9 | 30 |
| 29Jan2007 | 4129.7 | 2 | 31Jan2007 | 4132.3 | 41 | 17Feb2007 | 4148.9 | 29 |
2.2.2 FEROS data
The Fiber-fed, Extended Range, Échelle Optical Spectrograph (FEROS), mounted at the 2.2-m ESO/MPI telescope at La Silla (ESO), has a resolution of and records almost the complete range of 3500–9200 Å on 39 échelle orders. The detector is a EEV 2kx4k CCD. For the observations of HD 49434 we used the following set-up: the object+sky fiber combination, 1x1 binning mode and the Atmospheric Dispersion Corrector enabled. We reduced the spectra using an improved version of the standard FEROS pipeline, written in MIDAS, developed by Rainer (2003). The main improvements of this pipeline concern the blaze and flat-field correction of the spectra, by using an accurate definition of the blaze function extracted from a well-exposed spectrum of a hot star. The reduced spectra were subsequently corrected to the heliocentric frame. We used an automated continuum normalisation procedure developed by M. Bossi (INAF OAB-Merate) to normalise the spectra with continuum at unity. As the resulting normalised spectra have to be treated with caution when performing a study of individual line-profiles, selected spectral regions (e.g. near Ti ii 4501.273 Å and Fe ii 4508.288 Å) were also normalised manually by fitting cubic splines.
HD 49434 was one of the selected CoRoT targets observed during the 15 nights, from January 1–10 and from January 24–28, 2007, awarded in the framework of an ESO Large Programme (LP178.D-0361; PI: E. Poretti). We could observe 85% of the total available time in good weather conditions, resulting in 73 spectra.
2.2.3 HERCULES data
The High Efficiency and Resolution Canterbury University Large Echelle Spectrograph (HERCULES) is fibre-fed from the 1.0-m McLellan telescope at MJUO. The instrument has a resolution of and records selected regions of the spectral range of 3800–8800 Å on 48 orders. A description of the gaps in the spectral coverage is given by Hearnshaw et al. (2002). Unfortunately, the Ti ii and Fe ii profiles near 4500 Å belong to one of those gaps. The spectra were reduced with a semi-automated procedure using the HERCULES Reduction Software Package version 2.3 (Skuljan 2004). After a correction to the heliocentric frame, the spectra were normalised using the automated continuum normalisation procedure as described in Sect. 2.2.2.
Observing time was awarded on HERCULES from February 1–18, 2007, but half of the nights were lost due to bad weather. In total 194 spectra were observed. Exposure times ranged from 8 to 10 minutes in clear sky conditions, and up to 20 minutes when observing through thin clouds.
2.2.4 FOCES data
The FOCES échelle spectrograph on the 2.2-m telescope at CAHA has a spectral coverage of 3820–10280Å in 93 spectral orders. The CCD is a Loral 2kx2k CCD with a pixel size of 15m. For the observations of the Dor target we used the mode. As there is no pipeline available, the spectral reduction and subsequent heliocentric correction were performed using standard IRAF échelle spectral reduction procedures. The spectra were normalised using an automated continuum normalisation procedure.
A total of 25 nights were awarded on FOCES to observe HD 49434. The time was distributed over two campaigns in December 2006 and 2007, with 5 more nights in February 2008. Unfortunately, bad weather hampered these runs reducing the usable data to only one night. A total of 47 FOCES spectra of HD 49434 were observed on December 4, 2006.
3 Analysis
3.1 Multi-colour analysis
The Strömgren dataset consists of 4 seasons of SNO observations and 3 seasons of SPMO data, of which the most continuous dataset (361 datapoints in 18 nights) was observed at SPMO in November-December 2006 (see also Fig. 2). We first searched for frequencies in all filters of the individual seasons, using SCARGLE (Scargle 1982) and Phase Dispersion Minimisation (PDM, Stellingwerf 1978) analysis, and the least-squares power spectrum method (Vaníček 1971). The runs in 2005 at SNO and SPMO were too short (a time span of 2 and 4 days, respectively) to resolve Dor type periods. In the other seasons, except in the SNO subset obtained in November 2007–January 2008, we detected a frequency near 0.24 d-1, which is present in all filters. In the SNO datasets a frequency of 1.73 d-1 is also detected.
As all individual seasons have different zero points due to instrumental effects, we aligned the data before merging them. The alignment was performed in a delicate and iterative process. We calculated the preliminary frequency solution of the individual subsets (i.e. we performed a least-squares fit with the frequency 0.24 d-1), and used the constant of the fit as a measure to re-align the subsets at the same mean brightness level. In a next step we determined an improved frequency solution from the merged dataset, and calculated from the individual subsets the least-squares fit with this new solution to obtain an improved value of the constant, which was then used to construct an improved merged dataset. We continued this iterative process until an optimized multi-periodic solution was found (see below). The value of the constant of the least-squares fit at the end of the iterative process did not differ more than 0.2 mmag from the constant calculated in the first iteration step, in all filters. We are aware that this artificial alignment can remove or modify long-period variations, if present. To quantify the artificial shifts, we give a list, for each filter, of the relative correction between the subsets of the SPMO data and SNO data separately, as well as the relative offset between SPMO and SNO datasets. The relative corrections between the SPMO subsets are of the order of 18.1 mmag ( filter), 21.9 mmag ( filter), 24.7 mmag ( filter), and 6.8 mmag ( filter). For the SNO subsets the corrections are 20.3 mmag ( filter), 9.7 mmag ( filter), 6.3 mmag ( filter), and 6.7 mmag ( filter). The offset between the SPMO and SNO subsets are of the order of 20.0 mmag ( filter), 21.0 mmag ( filter), 41.0 mmag ( filter), and 9.0 mmag ( filter).
In the aligned datasets the frequency near 1.7348 d-1 appears besides 0.2342 d-1, and, moreover has the highest amplitude. More low-amplitude frequencies seem to be present in the light variations (near 2.538 d-1 and 2.253 d-1), but without further evidence we only accept the two frequencies that satisfy the SN4 criterion (Breger et al. 1993; Kuschnig et al. 1997): 1.73480(3) d-1 and 0.23427(5) d-1. The SN-level was computed as the average amplitude over a frequency interval with a width of 5 d-1 in an oversampled SCARGLE periodogram obtained after final prewhitening. We carefully checked if the two frequencies are independent (their sum is close to, but significantly different from, 2 d-1), and found convincing evidence that they indeed both independently contribute to the variability. Different stages in the prewhitening procedure resulted in the detection of both frequencies. Moreover, the same results are obtained when applying the Vaníček method (Vaníček 1971), which does not rely on the concept of prewhitening, since the amplitudes and phases of the known terms are recalculated for each new trial frequency. The frequency errors listed in Table 4 are calculated using the formula described by Montgomery& O’Donoghue (1999).
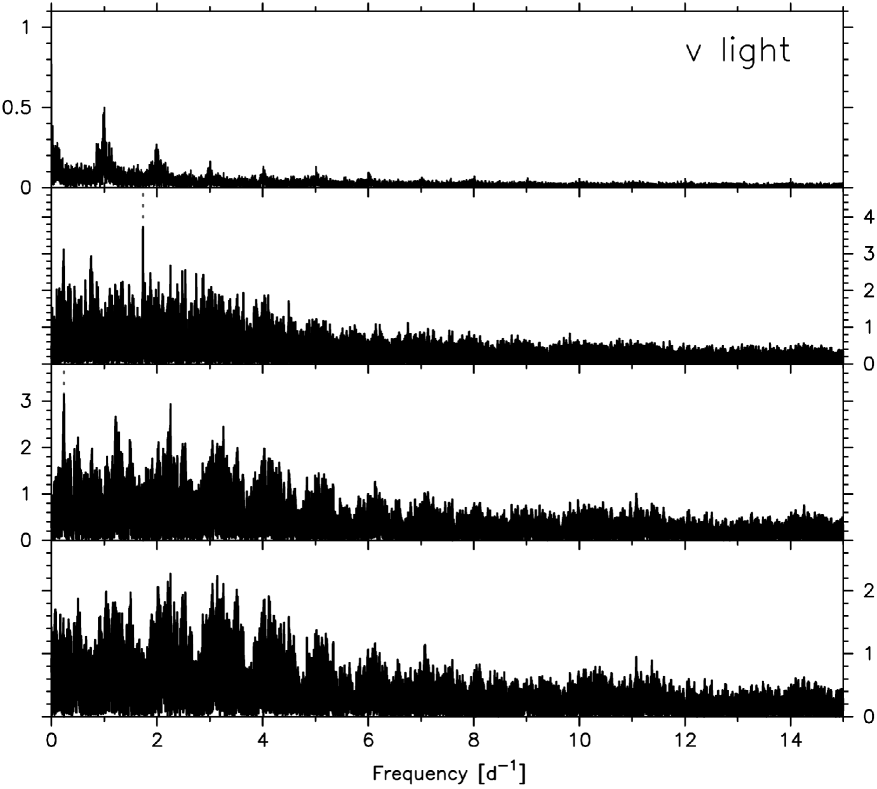
We also derived merged datasets (V light) consisting of Strömgren data (SPMO and SNO), Johnson V data (KON) and/or HIPPARCOS data. For adding the KON and/or HIPPARCOS data we used the same alignment procedure as listed above. We note that the individual KON Johnson dataset was too short to detect accurate frequencies. Unfortunately, an analysis of the HIPPARCOS dataset only (d; 104 datapoints) resulted in the non-detection of frequencies. The frequency search was hampered by a combination of a bad observing window (the highest frequency in the observing window is 0.2311 d-1, which is exactly of the order of the Dor-type frequencies we are looking for) and the low-amplitudes of the intrinsic frequencies of HD 49434, which got lost in the noise. In the merged V light datasets we did not find other frequencies than the ones detected in the Strömgren datasets alone. Given the inconvenient time sampling of the HIPPARCOS data, and the small sample of KON data, we decide to be conservative and, despite the larger time-span, to maintain the frequency accuracy derived from the Strömgren dataset. The SCARGLE periodograms of the Strömgren light can be found in Fig. 3. The solution of the least-squares fit of this bi-periodic model is given in Table 4.
It is striking to discover that we cannot explain the major part of the observed light intensity variations of HD 49434 in our ground-based photometric dataset. Several other low-amplitude oscillations probably also contribute to the light variability. From the nightly variations (see bottom right panel in Fig. 2) we suspect the presence of periods of the order of a few hours as well. As can be seen at the bottom panel of Fig. 3, the power excess at this spectral region is low. To give a quantitative comparison, we computed the mean level of the noise in the residual dataset for three separate regions: 0–5 d-1, 5–10 d-1 and 10–15 d-1. We obtain a mean noise level of 0.45 mmag, 0.25 mmag and 0.22 mmag, respectively. We refer to Sect. 3.3 for a further discussion on the subject.
| Strömgren | Strömgren | Strömgren | Strömgren | |||||
|---|---|---|---|---|---|---|---|---|
| ampl | phase | ampl | phase | ampl | phase | ampl | phase | |
| 1.73480 d-1 | 2.5(3) | 5.8(1) | 3.4(2) | 5.84(5) | 3.1(2) | 5.86(5) | 2.4(1) | 5.89(6) |
| 0.23427 d-1 | 1.8(3) | 3.5(2) | 2.5(2) | 3.80(7) | 2.1(2) | 3.80(8) | 1.6(1) | 3.80(8) |
| Var. Red. | 5.9% | 24.7% | 24.4% | 21.2% | ||||
| Residual r.m.s. [mmag] | 9.0 | 6.0 | 6.0 | 5.0 | ||||
3.2 Spectroscopic analysis
In addition to individual line profiles, in particular the Ti ii 4501.273 Å and Fe ii 4508.288 Å profiles (right panel Fig. 4), we also considered deconvoluted profiles computed through the Least-Squares Deconvolution (LSD) method (Donati et al. d97 (1997),d99 (1999)). The LSD method extracts an ’average’ line profile from several hundreds of individual lines by comparing them with synthetic line masks. We used the spectral line list from the VALD database (Piskunov et al. 1995, Ryabchikova et al. 1999, Kupka et al. 1999). We chose a mask with K and and included all elements except He and H. We calculated the LSD profiles from the regions 4380–4814 Å and 4960–5550 Å, which resulted in combining the information of more than 3100 lines for the FEROS, SOPHIE and FOCES spectra, and 1700 lines for the HERCULES spectra. Through this method we increased the relatively low SN-ratio of the spectra by creating for each spectrum a single profile with an average SN-ratio of 5000, 2800, 1900 and 1400 for the FEROS, SOPHIE, HERCULES, and FOCES spectra, respectively. As the created ’average’ line profiles do not have a continuumlevel at 1.0, the LSD profiles were subsequently normalised. It turned out that the LSD profiles calculated from different instruments have different depths, while the depth of the LSD profiles from the same instrument are comparable. In order to homogenize the profiles observed with different instruments, a scale-factor was computed from the average LSD profile per dataset, and subsequently applied, to rescale all the profiles to comparable line depths. We note here that the absolute RV values calculated from the LSD profiles do not have a physical meaning, but the relative RV changes are intrinsic to the star. A selection of the resulting LSD profiles is presented in Fig. 4. The RV step of the individual LSD profiles were 1 km s-1 (SOPHIE), 2 km s-1 (FEROS and FOCES) and 2.5 km s-1 (HERCULES). We did not find evidence for a possible binary nature of HD 49434 in the line profiles. We discovered the existence of systematic instrumental differences between the FEROS, SOPHIE, HERCULES and FOCES spectra. For instance, the FOCES spectra seem to be blue shifted over km s-1 with respect to the profiles obtained with the FEROS and SOPHIE instruments, while the HERCULES spectra are slightly shifted towards the red. To correct for the instrumental effects, we shifted the spectra from each dataset with a fixed RV value (’aligned profiles’). The values were determined as the average of the first normalised moment, and were -12.8327 km s-1, -13.3156 km s-1, -13.7354 km s-1 and -15.1830 km s-1 for HERCULES, SOPHIE, FEROS and FOCES spectra, respectively.
We computed the first zero point position of the Fourier transform of the mean LSD profile of each instrument, which is an indication for the vi of the star (Gray 2005), assuming that rotation is the chief contributor to the line broadening. We obtained the same value vi km s-1 from all FEROS, SOPHIE, HERCULES and FOCES spectra, within error bars.
We searched for intrinsic frequencies in two line-diagnostics: the pixel-to-pixel variations across the line profile and the moment variations.

|

|
3.2.1 Variations across the line profile
To find variable signals in each pixel along its time variation we used the two-dimensional Fourier transform analysis method (Intensity Period Search (IPS) Method, Telting & Schrijvers 1997). To optimise the frequencies and to remove false peaks from the power spectra, we applied the CLEANEST algorithm (Foster 1995) at the positions of the first and second zeros of the Fourier transform of the individual profiles.
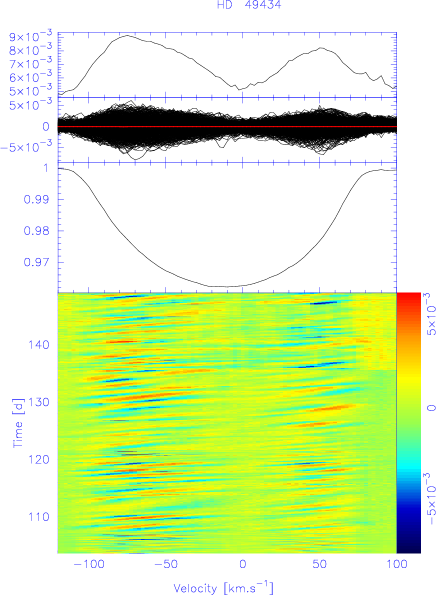
Figure 5 presents the two-dimensional dynamic spectra evolution of the FEROS, SOPHIE and HERCULES LSD profiles. Travelling bumps are easily seen moving from blue to red. It attracts the attention that the variations in the blue wing have higher amplitudes than the ones in the red wing. This fact has already been reported on individual line profiles (Mathias et al. m04 (2004)), and is probably caused by equivalent width (EW) variations of the intrinsic profile due to local temperature variations on the stellar surface, which are on their turn resulting from the pulsations (Schrijvers & Telting 1999). Indeed, they showed that non-adiabatic modes can cause a non-adiabatic phase-lag in the temperature (or EW) response, which is observable as an asymmetry in the IPS (see also Fig. 9).
We analysed all individual datasets, as well as the combined sets. Unfortunately, the combination of the datasets resulted in loss of RV resolution as we had to rebin the profiles to the same RV step. The total time span of the joined FEROS, SOPHIE and HERCULES spectra (648 spectra) measures 45.4 days. Adding the 47 FOCES spectra as well we obtain a time base of 75 days.
The frequency search across the LSD line profiles (region from -105 to 101 km s-1 in the aligned profiles) resulted in the discovery of at least six frequencies (see Table 6). We accepted only frequencies that clearly were present in the individual datasets, as well as frequencies for which we found additional evidence in the moment variations (see Sect. 3.2.2). The dominant frequency is 9.3070(3) d-1, followed by 5.3311(3) d-1, 12.0332(3) (or 11.0332) d-1, 10.1527(7) (or 9.1527) d-1, 6.6841(7) (or 7.6841) and 1.4831(8) d-1. For three of the frequencies we cannot decide between the frequency and one of the aliases at d-1. The errors on the frequencies as calculated from Montgomery & O’Donoghue (1999) are given in parentheses. The residual signal after removing the six frequencies reveals the presence of other periodicities, but given the low-amplitudes and the fact that we cannot decide between a frequency and several of its aliases we take a conservative attitude. Candidate frequencies that we do not accept without additional evidence are 3.182 d-1 and 3.720 d-1, or one of their aliases.
The averaged Fourier power spectrum for the combined dataset of FEROS, SOPHIE and HERCULES LSD profiles is given in Fig. 6. The bottom two panels give the Fourier spectra after prewhitening with the dominant first frequency (9.3070 d-1) and the residuals after prewhitening the six frequencies described above, which are indicated by dashed gray lines.
Similar and hence consistent frequencies are obtained from the pixel-to-pixel analysis of the individual Ti ii 4501.273 Å and Fe ii 4508.288 Å profiles.

3.2.2 Moment variations
A moment analysis was performed considering the EW and the first three normalised moments (, e.g. Aerts et al. 1992), calculated from the Ti ii 4501.273 Å, Fe ii 4508.288 Å and LSD line profiles, using fixed integration boundaries (integration domains were Å, Å, and km s-1, respectively). We analysed the resulting time-series using the least-squares power spectrum method and SCARGLE and PDM analyses. Figure 7 shows the first normalised moments calculated from the LSD profiles (upper panel) and from the Ti ii and Fe ii profiles (bottom panel). It is clear that due to the low SN-ratio of the individual spectra, the different instrumental properties and the strong dependence of the moment measurements on the SN value and the normalisation accuracy, the scatter of the moments calculated from the Ti ii and Fe ii profiles is very high, and very different for individual instruments (FEROS and SOPHIE measurements are represented by stars and bullets, respectively). A moment analysis of the individual profiles did not give satisfactory results. Therefore we describe only the results obtained from the much more accurate LSD profiles.

Again we considered the individual as well as the combined data sets. We could not detect a clear periodicity in the EW variations. The individual FEROS, HERCULES and FOCES moments present a strong noise, with no dominant signals. We present an overview of the frequencies found in the moments of the combined FEROS, SOPHIE and HERCULES data, which is illustrated by Table 5, Table 6 and Fig. 8. Adding the one night of lower quality FOCES data did not improve the frequency solution and as they merely added noise to the dataset we omitted them in the analysis. We accepted frequencies that satisfied the SN4 criterion, as well as low-amplitude frequencies for which we found evidence in more than one line-diagnostics and/or in the multi-colour variations.
The dominant frequency in all moments is 1.2732(8) d-1. In the first moment we additionally find 2.666(2) d-1, 0.234(1) d-1, 1.489(2) d-1 and 5.58(1) d-1. The latter two frequencies have low amplitudes, but we accept them as they are confirmed in the variations of the second and higher order () moments and/or by the line-profile analysis. On the other hand, the frequency 2.666 d-1 is only detected in the variations of the first moment, and not in any other diagnostics. However, the first harmonic of this frequency fairly equals 5.3311 d-1, which is found in the line-profile analysis. We note that the contribution of 5.3311 d-1 to the variations of the first moment is not significant. The frequency 0.234 d-1 is also present in multi-colour variations (see Sect. 3.1). In the residuals of the first moment indications for several other periodicities (e.g. 1.369 d-1 and 2.024 d-1) occur, but we need confirmation from a more extended and accurate dataset, such as CoRoT, before accepting them as real. Figure 8 shows the SCARGLE periodogram calculated from the first moment of the combined dataset.

Besides the dominant frequency 1.2732(8) d-1, the second moment shows variations with 1.489(1) d-1 and 5.583(1) d-1. The frequency 1.489 d-1 was also detected in the line-profile analysis (see Sect. 3.2.1). We currently accept only these three frequencies, even though the residual time-series seems to hide other periodicities (e.g. 4.629 d-1).
In the third moment we detect only one additional frequency, 9.308(2) d-1, which is the dominant frequency found in the pixel-to-pixel variations across the line-profile.
In summary, in the moment variations we find evidence for a total of five frequencies, of which two were already detected in the line-profile variations (see Sect. 3.2.1) and one was discovered in the photometric dataset (see Sect. 3.1). Additionally, we detected the frequency 2.666 d-1 in the variations of the first moment, which seems to be the double period of frequency 5.3311 d-1. A possible explanation for the detection of both frequencies is a rotational effect caused by the presence of a surface inhomogeneity, with the rotational frequency d-1. Given a stellar radius of (Masana, Jordi & Ribas 2006) and a vi value of 87 km s-1(see Sect. 3.2), we find the lower limit d-1 for HD 49434. These values of and vi, and assuming d-1, imply an inclination angle and an equatorial velocity km s-1. These results would make HD 49434 a fast rotator. Obviously, the status of the 2.666 d-1 frequency as the rotational frequency needs further investigation.
The solution of the least-squares fit of the model with six frequencies is given in Table 5. This model accounts for 37%, 30% and 28% of the total observed variability in the first, second and third moment, respectively. We expect that HD 49434 oscillates in other additional modes with amplitudes below our current detection limit. The continuous and accurate CoRoT lightcurves might shed a light on this matter.
| frequency [d-1] | ampl s.e. | ampl s.e. | ampl s.e. |
|---|---|---|---|
| frac. var. | 36.8 % | 30.0 % | 28.4.0 % |
3.3 Frequency summary
Table 6 gives an overview of all the detected frequencies together with an indication about the diagnostic (moments, line profiles or light variations) in which the variation is prominently present. In total we find nine ’bona fide’ frequencies, of which three show an ambiguity concerning their value. The frequency 2.666(2) d-1 can possibly be interpreted as the rotational frequency of the star. The frequency 5.3311 d-1 might be the first harmonic of the rotational frequency, and might point towards the presence of surface inhomogeneities. This hypothesis needs confirmation. In addition, we propose other candidate frequencies 3.182 d-1 and 3.720 d-1 or one of their aliases, for which we need additional evidence. We did not find obvious relations (combination effects or aliases) between the proposed frequencies. In particular, the frequencies at 1.27 d-1 and at 1.73 d-1(their sum gives 3 d-1) seem to be really independent, since the photometric (spectroscopic) data are not well fitted by the 1.27 d-1(1.73 d-1) term.
It immediately attracts the attention that we detected excess power in two separate regions of the frequency spectrum: one centered on 1.5 d-1 and one at higher frequencies, between 5 and 12 d-1. The first region is characteristic for Dor pulsators and the second range is typical for Sct stars. The presence of both - and -types pulsation is not completely unexpected, given the location of the star very close to the hot border of the Dor instability strip, and within the Sct one (see Fig. 1). We therefore propose HD 49434 as a new hybrid Dor/ Sct variable. In the multi-colour variations we detected only Dor type of variations at significantly high amplitudes. We barely find traces of the spectroscopic frequencies in the photometric data (amplitudes 0.6 mmag), probably because the high-degree modes (see Sect.4) are canceled out in the integrated light. It is puzzling that the dominating frequency of the moments 1.2732 d-1 is not detected in the pixel-to-pixel variations. As our frequency model only explains a small portion of the total observed variability, which is a common problem in Dor star studies (Mathias et al. 2004), we expect that other pulsation frequencies are present, but could not be detected due to the limitations of our ground-based dataset, such as non-continuous time sampling and a restricted amplitude accuracy. The exploitation of the continuous CoRoT space data of HD 49434 promises a break-through in the understanding of this puzzling, challenging and very interesting target.
| Freq (d-1) | LPV | photometry | |||
|---|---|---|---|---|---|
| 0.23427(5) | x | x | |||
| 1.2732(8) | x | x | x | ||
| 1.4831(8) | x | x | x | ||
| 1.73480(3) | x | ||||
| 2.666(2) | x | ||||
| 5.3311(3) | x | ||||
| 5.583(1) | x | x | |||
| 9.3070(3) | x | x | |||
| 6.6841/7.6841 | x | ||||
| 10.1527/9.1527 | x | ||||
| 12.0332/11.0332 | x |
4 Mode-identification
4.1 Moment Method
We attempted an identification of the dominant frequency in the velocity moments, 1.2732 d-1, using the Moment Method by Briquet & Aerts (2003). This method scans the discrete space and other continuous velocity parameters, such as the inclination angle between the rotation axis and the line of sight and the intrinsic width of the line profile, in search for the combination that leads to the best fit between the observed and the theoretical oscillation amplitude of the first moment. The discriminant value is an indicator of the goodness of fit: the lower , the better the agreement between theoretical and observed moment values. The Moment Method works well for the identification of a single mode if its amplitude is much larger than the other detected signals. The identification of several modes simultaneously is more challenging and requires a very accurate description of the frequencies and the amplitudes. As our target HD 49434 shows several low-amplitude frequencies, we focused only on the identification of the highest amplitude mode, which is also the only mode detected in all three moments. We calculated assuming a stellar mass and radius of and , resulting in a ratio of horizontal to vertical pulsation amplitude for 1.2732 d-1. As HD 49434 is a fairly fast rotator ( km s-1), we used the formalisms with and without taking into account rotational effects (see Townsend 1997). The resulting values did not favour a specific solution and did not discriminate much between the different combinations. The results rule out a zonal mode and indicate a mode, which is probably tesseral. We tried to improve the results by suppressing the contribution of the additional low-amplitude variations by averaging the moments in phase bins of 0.025 of the oscillation cycle. Such an approach has been successfully applied to other stars (e.g. Sco, Uytterhoeven et al. 2004). Unfortunately this did not lead to satisfactory results for HD 49434. Note that 1.2732 d-1 only accounts for 21% of the total variability in the first moment. Reducing the scatter on the mono-periodic fit, we calculated for a perfect theoretical time series with the same amplitude and phase properties as observed, which resulted in similar identification results as described above. Therefore we conclude that 1.2732 d-1 is probably a tesseral mode.
4.2 Intensity Period Search Method
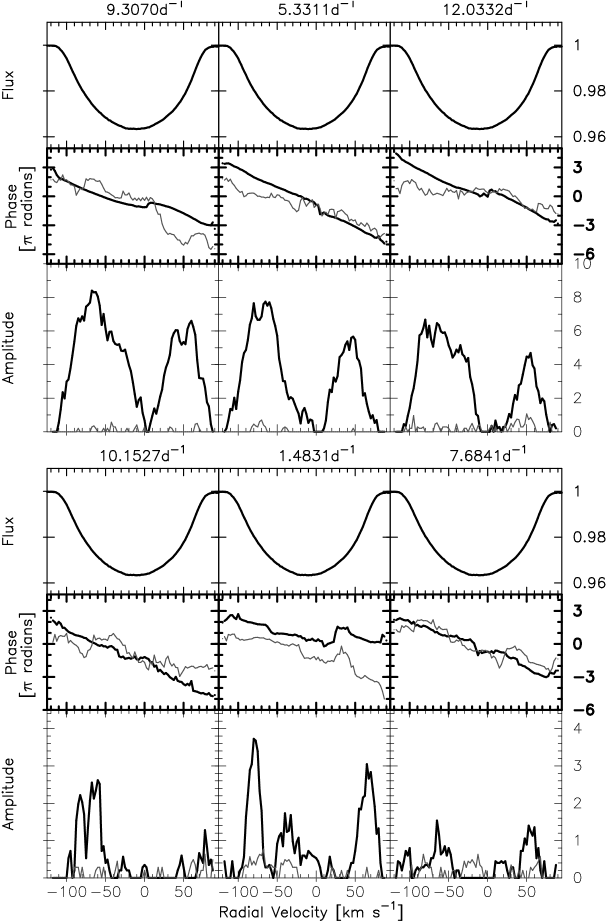
The modes detected in the pixel-to-pixel variations of HD 49434 can be identified using information on their phase distribution and on the phase distribution of their first harmonic across the line profile (IPS Method, Telting & Schrijvers 1997 ). From the relations between the quantum numbers and , and the phase differences with regard to the frequency and its first harmonic, and , given by and , as derived by Telting & Schrijvers (1997), we find that all modes have a high degree (). The formal errors on and are and , respectively. For the detailed results we refer to Table 7. We note that we attempted to identify the frequency 5.3311 d-1 as well, even though this frequency might be interpretable in terms of surface homogeneities in combination with rotational effects. As this hypothesis needs confirmation, we explore also an explanation in terms of a non-radial pulsation mode. Figure 9 shows the mean profile of the observed data (top), the phase distribution (middle) and amplitude distribution (bottom) across the line profile for each of the six frequencies detected in the pixel-to-pixel variations across the line profiles, listed in Table 6. As can be seen in Figure 9, the amplitudes of most modes are low. We note that the candidate frequencies 3.182 d-1 and 3.720 d-1(or one of their aliases), which we did not accept without additional evidence, show well defined phase distributions, and can be associated to modes with and , respectively.
| frequency | ||||
| frequency | ||||
We postpone the identification of the two photometric modes by means of the amplitude and frequency ratio methods to a subsequent paper, as the theoretical description of the pulsational character of HD 49434 is delicate, given its fast rotation ( km s-1).
5 Abundance analysis
We performed an abundance analysis on the average normalised FEROS spectrum, due to its relatively high mean SN-value compared to the other data sets. The synthetic spectra we used, were computed with the SYNTHE code (Kurucz 1993) ported under GNU Linux by Sbordone et al. (2005). All the atmospheric models were computed with the line-blanketed LTE ATLAS9 code, which handles line opacity with the opacity distribution function method (ODF). We adopted the atomic line list from the VALD database (Vienna Atomic Line Database, Kupka et al. 1999; Ryabchikova et al. 1999).
For the analysis of the data an efficient spectral synthesis method based on the least-squares optimalisation algorithm was used (Takeda 1995, Bevington 1969). This method allows for the simultaneous determination of various parameters involved with stellar spectra and consists in minimisation of the deviation between the theoretical flux distribution and the observed one. The synthetic spectrum depends on stellar parameters such as effective temperature , surface gravity , microturbulence , rotational velocity vi, radial velocity, and relative abundances of the elements , where denotes the individual element. The first three parameters were not determined during the iteration process but were considered as input values. All the other above-mentioned parameters can be determined simultaneously because they produce detectable and different spectral signatures. The theoretical spectrum was fitted to the average normalised FEROS spectrum. All spectra were normalised using MIDAS procedures. In some parts of the blue wavelength range the continuum level was corrected by comparison between theoretical and observed spectra.
We fixed the input and values to K and dex, respectively (see Sect. 1). The abundances and rotational velocity resulting from our analysis are given in Table 8. In all calculations we assumed a microturbulence velocity equal to km s-1 (Bruntt et al. 2002). The obtained abundances are compared with the previous results in Fig. 10. As we can see, the determined chemical composition of HD 49434 is close to the solar one. We derived a metallicity of for HD 49434, assuming solar values from Grevesse & Sauval (1998) for all elements not considered in our work. The most important discrepancy was found for Ba, but for this element only three lines were considered. Our results are consistent with all values obtained in previous analyses. The influence of changes in , and microturbulence (e.g. Bruntt et al 2002) on the derived abundances are shown in Table 9, available in the on-line version of the paper. We derived the abundances of elements for K changed by K, dex, and km s-1. The influence of effective temperature on the abundance is more important, especially for Mg, V and La, for which the difference is equal to about 0.4 dex. For the other elements, changes in temperature cause differences in obtained abundances of about 0.2 dex or lower.

| N | Sun 1D | Sun 3D | ||
|---|---|---|---|---|
| C | 8.70 | 0.14 | 8.52 | 8.39 |
| O | 8.86 | 8.83 | 8.66 | |
| Na | 6.02 | 6.33 | 6.17 | |
| Mg | 7.67 | 0.09 | 7.58 | 7.53 |
| Si | 7.52 | 0.47 | 7.55 | 7.51 |
| S | 7.31 | 7.33 | 7.14 | |
| Ca | 6.60 | 0.16 | 6.36 | 6.31 |
| Sc | 3.52 | 0.28 | 3.17 | 3.05 |
| Ti | 5.10 | 0.22 | 5.02 | 4.90 |
| V | 4.25 | 0.30 | 4.00 | 4.00 |
| Cr | 5.87 | 0.23 | 5.67 | 5.64 |
| Mn | 5.37 | 0.35 | 5.39 | 5.39 |
| Fe | 7.50 | 0.12 | 7.50 | 7.45 |
| Co | 5.34 | 4.92 | 4.92 | |
| Ni | 6.23 | 0.16 | 6.25 | 6.23 |
| Cu | 4.03 | 4.21 | 4.21 | |
| Y | 2.51 | 0.18 | 2.24 | 2.21 |
| Zr | 2.74 | 0.15 | 2.60 | 2.59 |
| Ba | 3.24 | 0.06 | 2.13 | 2.17 |
| La | 1.17 | 1.17 | 1.13 | |
| Ce | 2.13 | 1.58 | 1.58 | |
| Nd | 1.18 | 1.50 | 1.45 |
9
| 7300 | 7700 | 6900 | 7300 | 7300 | 7300 | 7300 | ||||||||
| 4.20 | 4.20 | 4.20 | 4.10 | 4.30 | 4.20 | 4.20 | ||||||||
| 2 | 2 | 2 | 2 | 2 | 1 | 3 | ||||||||
| vi | ||||||||||||||
| C | 8.70 | 0.14 | 8.79 | 0.11 | 8.79 | 0.17 | 8.69 | 0.15 | 8.73 | 0.15 | 8.48 | 0.52 | 8.68 | 0.22 |
| O | 8.86 | – | 8.65 | – | 9.11 | – | 8.83 | – | 8.89 | – | 8.84 | – | 8.85 | – |
| Na | 6.02 | – | 6.21 | – | 5.84 | – | 6.05 | – | 5.97 | – | 6.35 | – | 5.76 | – |
| Mg | 7.67 | 0.09 | 8.02 | 0.08 | 7.26 | 0.06 | 7.75 | 0.06 | 7.63 | 0.09 | 7.95 | 0.34 | 7.62 | 0.38 |
| Si | 7.52 | 0.47 | 7.58 | 0.37 | 7.25 | 0.42 | 7.55 | 0.27 | 7.53 | 0.28 | 7.37 | 0.62 | 7.46 | 0.45 |
| S | 7.31 | – | 7.53 | – | 7.74 | – | 7.30 | – | 7.33 | – | 7.16 | – | 7.21 | – |
| Ca | 6.60 | 0.16 | 6.70 | 0.14 | 6.38 | 0.13 | 6.62 | 0.07 | 6.65 | 0.10 | 6.77 | 0.57 | 6.48 | 0.16 |
| Sc | 3.52 | 0.28 | 3.60 | 0.17 | 3.53 | 0.24 | 3.45 | 0.20 | 3.53 | 0.21 | 4.18 | 0.89 | 3.35 | 0.26 |
| Ti | 5.10 | 0.22 | 5.21 | 0.21 | 4.83 | 0.25 | 4.97 | 0.21 | 5.03 | 0.23 | 4.85 | 0.82 | 4.94 | 0.22 |
| V | 4.25 | 0.30 | 4.65 | – | 4.45 | – | 4.53 | – | 4.56 | – | 4.38 | – | 4.18 | – |
| Cr | 5.87 | 0.23 | 6.05 | 0.18 | 5.72 | 0.19 | 5.89 | 0.24 | 5.90 | 0.27 | 5.87 | 0.51 | 5.79 | 0.22 |
| Mn | 5.37 | 0.35 | 5.68 | 0.18 | 5.07 | 0.40 | 5.44 | 0.18 | 5.44 | 0.19 | 5.32 | 0.96 | 5.41 | 0.39 |
| Fe | 7.50 | 0.12 | 7.70 | 0.10 | 7.29 | 0.11 | 7.49 | 0.11 | 7.49 | 0.11 | 7.40 | 0.38 | 7.39 | 0.10 |
| Co | 5.34 | – | 5.53 | – | – | – | 5.33 | – | 5.35 | – | 4.65 | – | 5.36 | – |
| Ni | 6.23 | 0.16 | 6.49 | 0.16 | 6.13 | 0.15 | 6.30 | 0.17 | 6.30 | 0.17 | 6.25 | 0.37 | 6.24 | 0.24 |
| Cu | 4.03 | – | 4.12 | – | 3.79 | – | 4.03 | – | 4.03 | – | 3.91 | 0.11 | 4.07 | 0.08 |
| Y | 2.51 | 0.18 | 2.68 | 0.17 | 2.32 | 0.25 | 2.49 | 0.18 | 2.54 | 0.19 | 2.03 | 0.31 | 2.43 | 0.38 |
| Zr | 2.74 | 0.15 | 2.98 | – | 2.79 | – | 2.53 | – | 2.84 | – | 2.78 | 2.30 | 0.71 | |
| Ba | 3.24 | 0.06 | 3.47 | – | 2.89 | – | 3.21 | 0.02 | 3.21 | 0.02 | 3.81 | 0.07 | 2.58 | 0.10 |
| La | 1.17 | – | 1.56 | – | 0.93 | – | 1.16 | – | 1.17 | – | 0.89 | – | – | – |
| Ce | 2.13 | – | 2.30 | – | 1.84 | – | 2.07 | – | 2.20 | – | 2.08 | – | 1.73 | – |
| Nd | 1.18 | – | – | – | – | – | 1.13 | – | 1.27 | – | – | – | – | – |
6 Discussion and conclusion
In this paper we presented frequency analysis and preliminary spectroscopic mode-identification results of HD 49434, obtained from the most extensive ground-based dataset for a Dor star to date. Photometric and spectroscopic observations were performed between 2005 and 2008 in the framework of the CoRoT ground-based support campaign.
Our central finding is the discovery of the hybrid nature of the star: HD 49434 pulsates simultaneously in - and -modes. The frequency analysis clearly shows the presence of at least four Dor-type, as well as six Sct-type of frequencies. Additional frequencies are expected to contribute to the observed variability, but have amplitudes near or below our current detection limit. All modes, for which an identification was possible, seem to be high-degree modes (), which make future modelling extremely challenging.
Also the fairly fast rotation of HD 49434 ( km s-1) will complicate the modelling since the frequencies in the observers frame are rotationally modified with respect to the ones in the stellar rest frame. Actually, a high-degree, mode can shift the observed frequencies by 10 d-1, which means that a –mode may appear with a typical –mode frequency () or vice-versa. We expect that the CoRoT time-series will provide additional information on the rotational frequency through the effect of rotational splitting. In this context, the frequency 2.666(2) d-1 can possibly be interpreted as the rotational frequency of the star. Its first harmonic, 5.3311 d-1, is detected in the line-profile variations, and if the value is confirmed, this could imply the presence of surface inhomogeneities. From the asymmetric behaviour of the amplitude distributions in the IPS diagrams (see Figs. 5 and 9) we find indications for local temperature variations on the stellar surface (Schrijvers & Telting 1999), but we could not detect a clear periodicity in the corresponding EW variations. A similar behaviour has been noted in other stars, such as the Sct star FG Vir (Zima et al. 2006) and the Cep pulsator Cen (Schrijvers et al. 2004).
We encountered several puzzling results. For instance, it is not clear why we failed to detect the dominating frequency from the moment variations, 1.2732 d-1, in the variations across the line profiles, and if this frequency can be linked with the photometric frequency 1.73480 d-1. It is clear that the pulsational behaviour of HD 49434 is very complex and that the fast rotation adds to this. The simultaneous presence of several low-amplitude variations complicates the frequency search, which often results in an ambiguous determination of the frequency values (see Table 6). Moreover, some technical aspects of the analysis add to the confusion, as the delicate process of the alignment of the data.
The detection of the hybrid nature of HD 49434 makes it an interesting asteroseismic target. The asteroseismic importance of hybrid Dor/ Sct stars is obvious as both the envelope and the deep interior of the star can be probed through the study of - and -modes, respectively, and thus giving a unique opportunity to constrain the macro-physics of the stellar interior. The amount of hybrid detections is steadily growing, although still only a handful of cases is known. The first discovery of its kind was made in HD209295 (A9/F0V, Handler et al. 2002). However, this primary of an eccentric binary might be not a ’bona fide’ hybrid variable as the excitation of the Dor-type variations is possibly induced by tidal interaction. To date at least four other hybrid Dor/ Sct stars have been reported, of which two were discovered from MOST satellite data: HD 8801 (A7m, Henry & Fekel 2005), HD114839 (Am, King et al. 2006), BD+18 4914 (F5, Rowe et al. 2006), and HD 44195 (F0, Uytterhoeven et al. 2008). The simultaneous presence of - and -modes has also been theoretically predicted (Dupret et al. 2004), and hence might not be as uncommon as it currently seems. Our results on HD 49434 show that the Sct-type modes have high degrees (, see Table 7), and consequently are only detected in spectroscopic variations (Table 6) as high-degree modes tend to cancel out in the integrated photometric light. This observational selection effect can explain why Handler and Shobbrook (2002) in their systematic survey for Sct variations in Dor stars, using only photoelectric photometry, failed to detect hybrid variables other than HD209295. We can even speculate that actually a large part of all Dor variables pulsate both in - and -modes, but the high-degree -modes need spectroscopic detection. This finding would make the Dor pulsating class extremely suited for asteroseismic studies.
In a subsequent series of papers we will confront the ground-based data, enlarged with a new spectroscopic time-series obtained in January/February 2008, with the actual CoRoT space data with the goal to perform a deeper investigation and to present a modelling of the star.
The combination of continuous and accurate space photometry, and ground-based spectroscopy promises to be the best way to study the frequency spectrum of HD 49434 in detail. Results from the MOST satellite show that not all high-degree spectroscopic modes can be recovered from photometric space data (e.g. Oph, Walker et al. 2005), and consequently the spectroscopic observations will play an important part in the unraveling and understanding of the pulsational behaviour of the star.
As a matter of fact, the CoRoT satellite mission will provide an excellent opportunity to investigate the pulsational behaviour of a large amount of Dor variables, as in the forthcoming years continuous time-series of thousands of stars in the exo-planetary CCD field will become available. Also, with at least two hybrid stars selected in the asteroseismic field of CoRoT, the target of this paper HD 49434 and HD 44195, we have good prospects of making progress in modelling and understanding the relation between - and -mode pulsators.
Acknowledgements.
We thank Peter De Cat, Luciano Mantegazza, Wolfgang Zima and Andrea Miglio and the anonymous referee for useful comments on the first version of the paper. The FEROS data are being obtained as part of the ESO Large Programme: LP178.D-0361 (PI: E. Poretti). This work was supported by the italian ESS project, contract ASI/INAF I/015/07/0, WP 03170, by the Hungarian ESA PECS project No 98022 and by the European Helio- and Asteroseismology Network (HELAS), a major international collaboration funded by the European Commission’s Sixth Framework Programme. KU acknowledges financial support from a European Community Marie Curie Intra-European Fellowship, contract number MEIF-CT-2006-024476. PJA acknowledges financial support from a Ramon y Cajal contract of the Spanish Ministry of Education and ScienceReferences
- (1) Aerts, C., De Pauw, M., & Waelkens, C. 1992, A&A, 266, 294
- (2) Asplund, M., Grevesse, N., & Sauval, A. J. 2005, in ASP Conf. Ser., 336,Cosmic Abundances as Records of Stellar Evolution and Nucleosynthesis in honor of David L. Lambert, eds. Th. G. Barnes III & F. N. Bash, 25
- (3) Baglin, A., Auvergne, M., Boisnard, L,. et al. 2006, in 36th COSPAR Scientific Assembly, 36, 3749
- (4) Bevington, P.R., 1969, ’Data reduction and error analysis for the physical sciences’, McGraw-Hill, New York
- (5) Breger, M., Stich, J., Garrido, R., et al. 1993, A&A, 271, 482
- (6) Briquet, M., & Aerts, C. 2003, A&AS, 398, 687
- (7) Bruntt, H., Catala, C., Garrido, R., et al. 2002, A&A, 389, 345
- (8) Bruntt, H., Bikmaev, I.F., Catala, C., et al. 2004, A&A, 425, 683
- (9) Catala, C., Poretti, E., Garrido, R., et al. 2006, in The CoRoT Mission, eds. M. Fridlung, A. Baglin, J. Lochard & L. L. Conroy, ESA Spec. Publ., 1306, 329
- (10) Claret, A. 1995, A&ASS 109, 441
- (11) Donati, J.-F., Semel, M., Carter, B.D., Rees, D. E., & Collier Cameron, A. 1997, MNRAS, 291, 658
- (12) Donati, J.-F., Catala, C., Wade, G.A., et al. 1999, A&AS, 134, 149
- (13) Dupret, M.-A., Grigahcène, A., Garrido, R., Gabriel, M., & Scuflaire, R 2004, A&A, 414, L17
- (14) Dupret, M.-A., Grigahcène, A., Garrido, R., Gabriel, M., & Scuflaire, R 2005, A&A, 435, 927
- (15) Foster, G. 1995, AJ, 109, 1889
- (16) Gray, D.F. 2005, ’The observation and analysis of stellar photospheres’, Cambridge University press, Cambridge
- (17) Gillon, M., & Magain, P. 2006, A&A, 448, 341
- (18) Grevesse N., & Sauval, A.J. 1998, Space Science Reviews, 85, 161
- (19) Grigahcène, A., Dupret, M.A., Garrido, R., Gabriel, M., & Scuflaire, R. 2004, CoAst, 145, 10
- (20) Guzik, J.A., Kaye, A.B., Bradley, P.A., Cox, A.N., & Neuforge, C. 2000, ApJ, 542, L57
- (21) Handler, G., Balona, L.A., Shobbrook, R.R., et al. 2002, MNRAS, 333, 262
- (22) Handler, G., & Shobbrook, R.R. 2002, MNRAS, 333, 251
- (23) Hauck, B., & Mermilliod, M. 1998, A&AS, 129, 431
- (24) Hearnshaw, J.B., Barnes, S.I., Kershaw, G.M., et al. 2002, Experimental Astronomy, 13, 59
- (25) Henry, G.W, & Fekel, F.C. 2005, AJ, 129, 2026
- (26) Kaye, A.B., Handler, G., Krisciunas, K., Poretti, E., & Zerbi, F.M. 1999, PASP, 111, 840
- (27) King, H., Matthews, J.M., Rowe, J.F., et al. 2006, CoAst, 148, 28
- (28) Künzli, M., North, P., Kurucz, R. L., & Nicolet, B. 1997, A&AS, 122, 51
- (29) Kupka, F., & Bruntt, H. 2001, in ’First COROT/MONS/MOST Ground Support Workshop’, 39
- (30) Kupka, F., Piskunov, N., Ryabchikova, T. A., Stempels, H. C., & Weiss, W. W. 1999, A&AS, 138, 119
- (31) Kurucz, R.L. 1993, ATLAS9, Stellar Atmosphere Programs, CD-ROM No. 18, Smithonian Astrophysical Observatory
- (32) Kuschnig, R., Weiss, W.W., Gruber, R., et al. 1997, A&A, 328, 544
- (33) Lastennet, E., Lignieres, F., Buser, et al. 2001, A&A, 365, 535
- (34) Masana, E., Jordi, C., & Ribas, I. 2006, A&A, 450, 735
- (35) Mathias, P., Le Contel, J.-M., Chapellier, E., et al. 2004, A&A, 417, 189
- (36) Mermilliod, J.-C., Hauck, B., Mermilliod, M. 1997, A&AS 124, 349
- (37) Montgomery, M.H., & O’Donoghue, D. 1999, Delta Scuti Star Newsletter, 13, 28
- (38) Napiwotzki, R., Schoenberner, D., & Wenske, V. 1993, A&A, 268, 653
- (39) Perryman, M.A.C., Lindegren, L., Kovalevsky, J., et al. 1997, A&A, 323, L49
- (40) Piskunov, N.E., Kupka, F., Ryabchikova, T.A, Weiss, W.W. & Jeffery, C.S. 1995, A&ASS, 112, 525
- (41) Poretti, E. & Zerbi, F. 1993, A&A, 268, 369
- (42) Poretti, E., Garrido, R., Amado, P.J., et al. 2003, A&A, 406, 203
- (43) Poretti, E., Alonso, R., Amado, P.J., et al. 2005, AJ, 129, 2461
- (44) Rainer, M. 2003, Analisi spettrofotometriche di stelle da usare come targets per la missione spaziale CoRoT, Laurea Thesis, Universitá degli Studi di Milano
- (45) Rowe, J.F., Matthews, J. M., Cameron, C., et al. 2006, CoAst, 148, 34
- (46) Ryabchikova, T.A., Piskunov, N.E., Stempels, H.C., Kupka, F. & Weiss, W.W. 1999, Physica Scripta, 83, 162
- (47) Sbordone, L. 2005, MSAIS, 8, 61
- (48) Scargle, J. D. 1982, ApJ, 263, 835
- (49) Schrijvers, C., Telting, J.H. 1999, A&A, 342, 453
- (50) Schrijvers, C., Telting, J.H., & Aerts, C. 2004, A&A, 416, 1069
- (51) Skuljan, J. 2004, in ASP Conf. Ser., 188, Variable Stars in the Local Group, eds. D.W. Kurtz & K.R. Pollard, IAU, 193, 575
- (52) Stellingwerf, R.F. 1978, ApJ, 224, 953
- (53) Takeda, Y. 1995, PASJ, 47, 287
- (54) Telting, J.H., & Schrijvers, C. 1997, A&A, 317, 723
- (55) Townsend, R.H.D. 1997, MNRAS, 284, 839
- (56) Uytterhoeven, K., Briquet, M., Aerts, C., et al. 2004, A&A, 432, 955
- (57) Uytterhoeven, K., Poretti, E., & the CoRoT SGBOWG, 2007, CoAst, 150, 371
- (58) Uytterhoeven, K., Poretti, E., Rainer, M., et al. 2008, in ’HelasII international conference: Helioseismology, Asteroseismology and MHD Connections’, Journal of Physics: Conference Series, IOP Publishing, in press (astro-ph 0710.4068)
- (59) Vaníček, P. 1971, Ap&SS, 12, 10
- (60) Walker, G.A.H., Kuschnig R., Matthews, J.M., et al. 2005, ApJ, 623, L145
- (61) Zima, W., Wright, D., Bentley, J., et al. 2006, A&A, 455, 235