Discovery and Interpretation of an X-ray Period in the Galactic Center Source CXOGC J174536.1-285638
Abstract
We present X-ray and infrared observations of the X-ray source CXOGC J174536.1-285638. Previous observations suggest that this source may be an accreting binary with a high-mass donor (HMXB) or a colliding wind binary (CWB). Based on the Chandra and XMM-Newton light curve, we have found an apparent day periodicity with better than 99.997% confidence. We discuss several possible causes of this periodicity, including both orbital and superorbital interpretations. We explore in detail the possibility that the X-ray modulation is related to an orbital period and discuss the implications for two scenarios; one in which the variability is caused by obscuration of the X-ray source by a stellar wind, and the other in which it is caused by an eclipse of the X-ray source. We find that in the first case, CXOGC J174536.1-285638 is consistent with both CWB and HMXB interpretations, but in the second, CXOGC J174536.1-285638 is more likely a HMXB.
1 Introduction
Chandra observations of the Galactic Center (GC) have revealed a large new population of low luminosity X-ray sources with (Muno et al., 2003). In addition, the Swift and INTEGRAL missions have recently revealed a new population of highly-absorbed X-ray sources, believed to be high-mass X-ray binaries (HMXBs; e.g. Beckmann et al., 2005; Bodaghee et al., 2007; Negueruela & Schurch, 2007). In 2005, we identified an infrared (IR) star as the first spectroscopically confirmed IR counterpart to the low luminosity Chandra source CXOGC J174536.1-285638 (Mikles et al., 2006, hereafter Paper I). Based on the X-ray and IR spectra and the X-ray to IR luminosity ratio, we showed that the source is most likely a massive star in a binary system. The source shows strong HeI (2.114-m), Brackett- (1.945-m), and Brackett- (2.166-m) emission lines, typical of both accretion-powered binaries and CWBs. Additionally, we observe Brackett series, HeI, HeII, CIII, and NIII line emission. P Cygni profiles are visible in several HeII lines, suggesting wind activity around a massive star. The X-ray spectrum of this source is particularly intriguing, having prominent Fe-XXV emission centered at 6.7 keV with an equivalent width of 2.2 keV. This is one of the highest equivalent width Fe-XXV lines ever seen (Paper I).
Our initial IR observations were aimed toward the discovery of a short ( d) period in the CXOGC J174536.1-2856 binary. We use IR spectroscopy to search for variations in CXOGC J174536.1-285638’s IR emission features. We analyze Chandra and XMM-Newton archival data to search for X-ray variability over short and long baselines. From the combined X-ray light curve, we find a period of days. We discuss CXOGC J174536.1-2856’s variability in the IR and X-ray, and examine the implications of a 189 d period for the nature of the source. In §2, we summarize our IR and X-ray observations and analysis, detailing both our IR radial velocity study and X-ray period analysis. In §3, we discuss the IR and X-ray variability in CXOGC J174536.1-2856, specifically exploring an orbital period interpretation of the identified X-ray period.
2 Observations and Analysis
2.1 Infrared Counterpart to CXOGC J 174536.1-285638
CXOGC J174536.1-285638 was discovered as part of a Chandra survey of the GC region. The survey, conducted by Muno et al. (2003), identified 2357 serendipitous X-ray sources with within -arcmin of Sgr A*. The coordinates of the source are 266.40060, -28.94407 with positional uncertainty of 0.4-arcsec (Muno et al., 2004b).
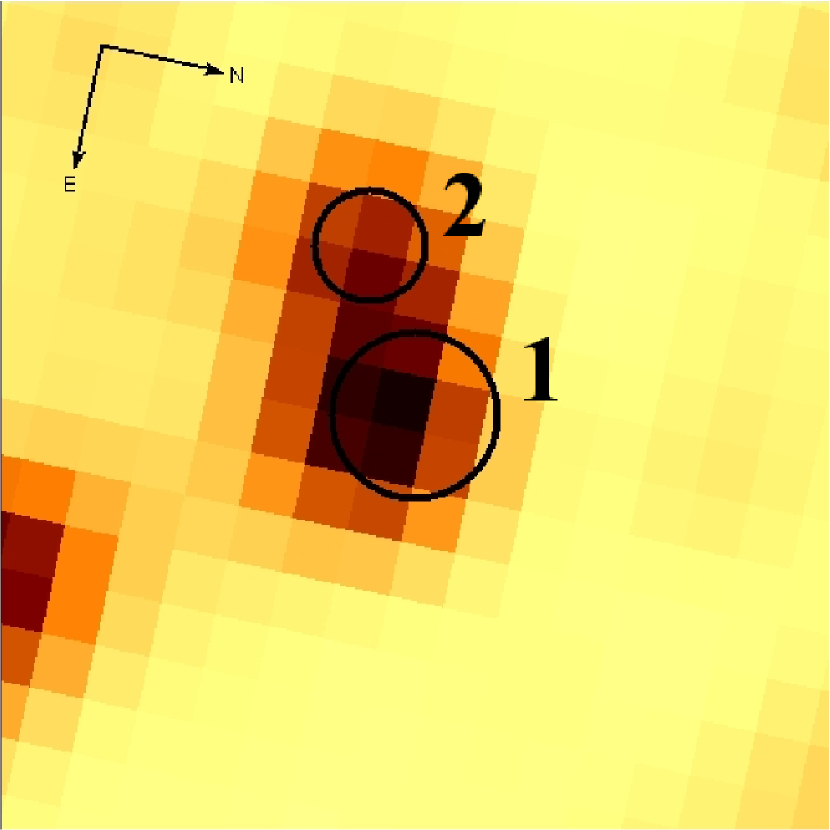
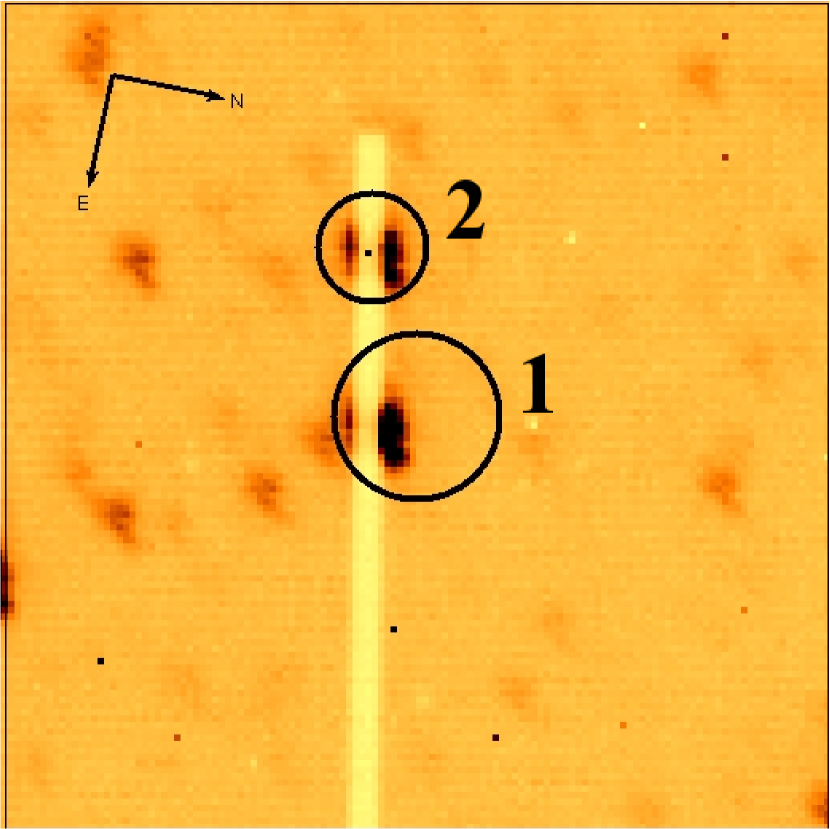
We searched for potential IR counterparts using the 2MASS catalog and identified the 2MASS source 17453612-2856386 as the likely counterpart. The blended 2MASS source is clearly resolved into two stars in our IRTF observations. In Figure 1, we show a 15” x 15” 2MASS image and IRTF SpeX slit image with a 1.5” circle at the Chandra coordinate center. The two stars, blended in 2MASS, are well separated in the IRTF finder image. The IR astrometric solution is derived from 2MASS which has a stated astrometric accuracy of 15mas. Due to the proximity of the two potential IR counterparts, we were able to obtain simultaneous spectra of both stars; we plot both spectra in Figure 2. In Paper I, we identify “star 1,” the emission line source, as “Edd-1,” the counterpart to the Chandra object. The second source is an evolved star of type K or cooler, with no evidence for emission lines which are signatures of high energy processes, such as accretion or wind collison. It thus seems unlikely that this second source is the IR counterpart to the X-ray source.
2.2 Search for short-period IR variability
On 2006 Aug 02-04 UT, we obtained J, H, and K band (1.1-2.4 m) spectra of the IR counterpart to CXOGC J174536.1-285638 using SpeX on IRTF (Rayner et al., 2003), in hopes of finding short period ( d) variability in the source. Dithering along the 0.5 arcsec slit, we obtained 184 exposures of 120 s each over the course of three half-nights, giving us a time baseline of 3-4 hours per night. The procedure for our IR analysis of the SpeX data is described in Paper I. We extract spectra using the standard SpexTool procedure for AB nodded data, resulting in a series of sky-subtracted, wavelength-calibrated spectra (Vacca et al., 2003; Cushing et al., 2004). We interpolate over the intrinsic Brackett absorption features in the G0V-star spectrum, then divide the target spectrum by the G0V-star in order to remove atmospheric absorption bands. We multiply the resultant spectrum by a 5900 K blackbody spectrum, corresponding to the temperature of the G0V-star. Using our previous observations taken on 2005 July 1 UT (Paper I), we adopt a reddening value of mag and apply this correction to all data.
We used spectra from each night to test variability on multiple time scales. Figure 3 shows the series of twenty-one K-band spectra taken over the course of our observations, with integration times between 8 and 20 minutes per spectrum. We list the specific time stamps and exposure times of these spectra in Table 1. To search for radial velocity variations in the emission lines, we track the line centers with two methods: first by taking a statistical mean of the wavelength around the line center, weighted by flux, and second by fitting a Gaussian to the line. We find no radial velocity variations, nor do we find significant flux variations in the lines. We checked for IR variability on 1 year, 3 day, 3 hour, 1 hour, and 30 minute baselines and found no evidence of periodic variability or flares in this sample. The only apparent variation is in the structure of the Br- line complex (see Figure 4), but this does not often vary more than times the RMS spectral difference in the vicinity of the Helium component. Further we note that this region is affected by our data reduction process (i.e., the removal of the intrinsic Brackett absorption in the G0V).
2.3 X-ray Variability
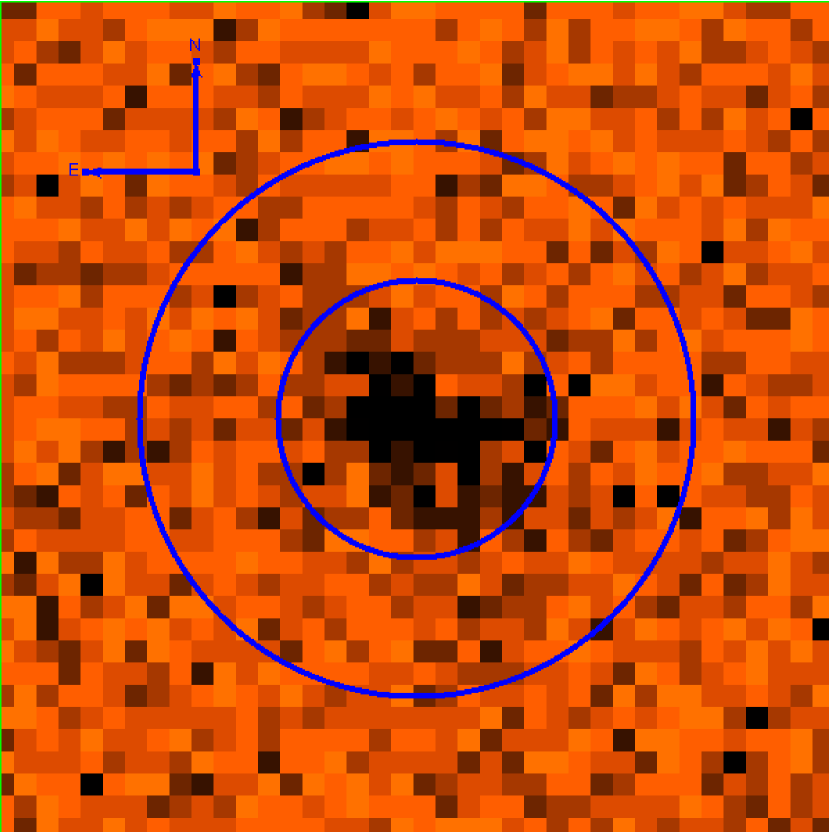
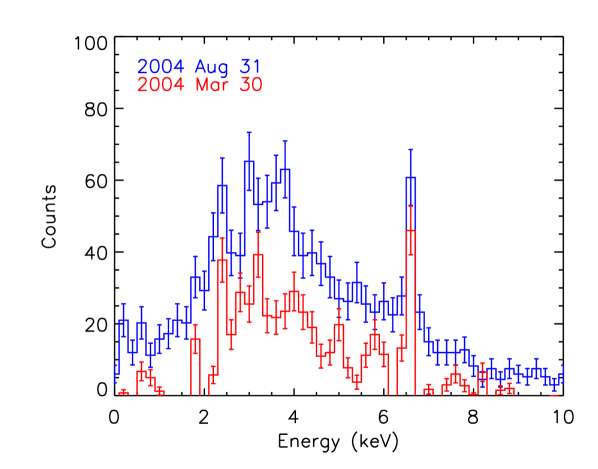
Chandra observations of CXOGC J174536.1-285638 revealed long baseline intensity variations by a factor of 3 in X-ray in the 2-8 keV range. The variation, which was observed initially with Chandra in 2002 as a drop in flux, repeated in 2006 with similar morphology, prompting us to search archival X-ray data for additional information about this source’s long term (month to year) variability. We list the Chandra data used in our analysis in Table 2. We supplement the Chandra observations with XMM-Newton archival data, listed in Table 3. CXOGC J174536.1-285638 is easily identified as an isolated source 10 pc from the GC and is not confused with any other source detection in either the Chandra or XMM images. The positions of the XMM and Chandra sources are consistent within the respective astrometric accuracy of the two instruments (0.4” and 1” respectively; Muno et al., 2004a; Kirsch et al., 2005). We identify the XMM counterpart to the Chandra source and show that in Figure 5. In addition to the astrometric accuracy, strong Fe-emission is detected in both the Chandra and XMM data (see Fig. 6), confirming that the XMM source is the same as the Chandra source. The Fe-XXV emission in this source is unusually strong and it would be extremely unlikely to detect emission in both the Chandra (see Paper 1) and XMM (this paper) spectra were they not the same source.
Due to the relative faintness of CXOGC J174536.1-285638 in the X-ray (usually 20 cts/hr), many of the XMM observations suffer from low signal-to-noise. While the 2001-2002 data consist of fairly short observations (exposure time h), in 2004 there are four observations of 40 consecutive hours each. Following standard XMM data reduction techniques, we generate an astrometrically calibrated event list. From this, we located CXOGC J174536.1-285638 and extracted light curves and spectra from a circle with a 200-pixel radius. The background was calculated from a ring extending 300-500 pixels from the source center. We show the extraction region around the source in Figure 5. We set the spectral bin size at 200 eV and plot two representative spectra in Figure 6. The flux varies by a factor of three between these observations. Because of the extremely low count rate, we cannot meaningfully constrain the fainter spectrum with XSpec models.
We extract light curves at five hour intervals over the full 2-8 keV band, as well as from the “soft” 2-4 keV band and the “hard” 4-8 keV band separately for the 2004 XMM observations. The time resolution is chosen to ensure sufficient counts in each bin to test for variability. The X-ray flux varies aperiodically by less than a factor of 2 over the course of each individual observation and the hardness ratio is consistent with zero. Aperiodic variability is not uncommon in stellar X-ray sources on these timescales. We observe no periodic variability on timescales less than 40 hours.
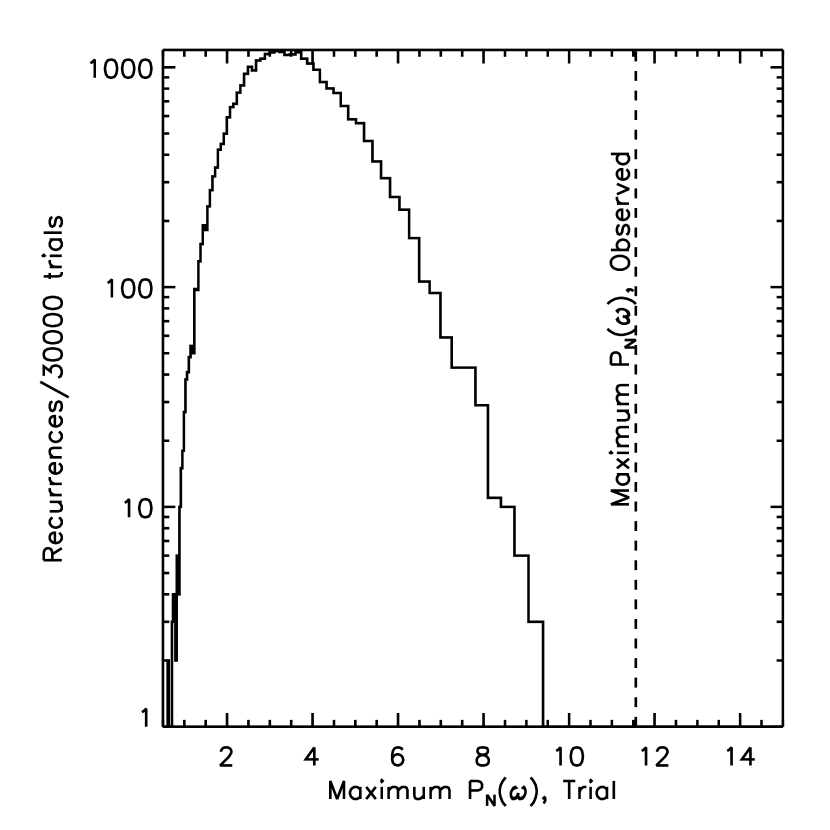
Because the X-ray flux is relatively constant over the course of each XMM observation, we calculate a single flux value for each observation epoch and combine these measurements with the Chandra light curve in Figure 7. Using the combined light curve, we can test for the presence or absence of periodic flux variations on timescales longer than 40 hours. The most notable flux variation in the XMM is a 4 variation in consecutive observations separated by five months (see Fig. 6). If periodic, this suggests a longer timescale variability. Using the method of Horne & Baliunas (1986), we perform a periodogram analysis of the combined Chandra and XMM light curve and find a period of days. In Figure 8, we show the resultant periodogram which tests for periodicity on scales of 1-1500 days. The peak at 189 d is clearly distinct and additional peaks are visible at integer multiples of the period. In Figure 7, we plot the X-ray light curve folded on the 189 d period. Analytically estimating the significance of a signal in non-uniformly sampled data is non-trivial. Thus, in order to estimate the confidence of this detection, we perform a Monte Carlo simulation as follows. We take the existing data set and maintain the same sampling intervals throughout. For each Monte Carlo realization, we randomly reassign the observed flux values to the time samples, effectively scrambling the light curve. We plot the results of these simulations in Figure 9. In 30,000 trials, we do not achieve a peak power approaching the power of our original periodogram, implying that the 189-day period is not due to random noise with a confidence level greater than 99.997%.
The previous test accounts for white noise variability; however, red noise is a significant source of false peaks in X-ray power spectra of X-ray binaries (Titarchuk et al., 2007). Red noise is a flux variation in the power spectrum that can be parameterized with a frequency dependence . A white noise process will generate a flat power spectrum such that ; a value of describes random walk noise (Timmer & Koenig, 1995). A dependence has been identified in stellar-mass black hole candidates and may be strongly related to accretion physics in the system (Mineshige et al., 1994; Timmer & Koenig, 1995; Titarchuk et al., 2007). Following the method of Timmer & Koenig (1995), we test the possibility of red noise creating a false signal matching the strength of our periodogram. Simulating a number of red noise dominated light curves of varying power law slope, , we find that as increases, more noise gets shunted near the period frequency, and the significance of our detection decreases. We show the results of our tests in Figure 10. We find the significance of our period detection remains above for values of and above for , showing that the significance decreases slowly as red noise is increased.
3 Discussion
3.1 Infrared Variability
We test the IR spectra for variations on short timescales (hours to days). Due to limits of our spectral resolution, we cannot observe radial velocity variations if the orbital velocity is less than 70km/s. In Figure 4, we show several close-ups of the Brackett- region of CXOGC J174536.1-285638’s spectrum over the course of our three night IRTF run in 2006. To the left of the 2.164m marker, we see minor variances in the Helium contribution to the line. Because this line cannot be resolved from the larger Br- contribution, it is difficult to determine the significance of this change. The RMS spectral difference rarely reaches 5 between any two events which are separated by hour. The observed differences are primarily in the wings of the line (m or m). Higher resolution spectroscopy is required to determine whether the changes in the Helium contribution are intrinsic to CXOGC J174536.1-285638 rather than an artifact of the data analysis. The observed variations do not have any detectable periodicity. It should also be noted that this region is affected by the data reduction process, as described in §2. Our 2006 IR spectra were obtained about two days after the Chandra observations on Day 2402 in the X-ray light curve (see Fig. 7), where the object is transitioning from an apparent low-flux state to a high-flux state. Since we have no IR data consistent with the lowest X-ray flux events, it is impossible to determine from these IR data if the apparent Helium variability at m we observe is associated with this X-ray flux transition.
We also search for wind variations in the P Cygni profiles. In our initial discovery spectrum, we identified three HeII lines with P Cygni profiles: 2.0379 m, 2.1891 m, and 2.3464 m (Paper I). In our 2005 analysis, we estimated the P Cygni velocity at km/s. We repeat our analysis on the 2006 data to search for variations and find the approximate velocity of the wind is km/s. The error is dominated by the spectral resolution. We find no evidence of changes in the P Cygni profile or velocity over our three day observations. Also, the 2005 and 2006 spectra have consistent P Cygni profiles and velocities.
Unfortunately, it was not until after completion of our IR observation campaign that we discovered the 189 d X-ray periodicity in the source. Thus we were not able to schedule our IR observations to sample different X-ray phases; as a result, both our 2005 and 2006 observations sample the same phase (indicated in Figure 7). The lack of IR radial velocity variations is consistent with the observations being at the same phase of a long period system.
3.2 X-ray Variability
Long term Chandra observations of this source revealed repeated X-ray flux variations, prompting us to search for periodicity by combining XMM and Chandra data, and revealing a 189-d period. In Paper I, we argue that CXOGC J174536.1-285638 contains at least one massive star based on the presence of P Cygni profiles in the IR spectrum. Although we consider the possibility of both an isolated massive star or a massive star in a binary system in Paper I, here we favor a binary interpretation because X-ray variability similar to that seen in CXOGC J174536.1-285638 is not observed in isolated massive stars (Cohen, 2000). In comparing CXOGC J174536.1-285638 to other systems containing massive stars, we showed that the X-ray to IR luminosity ratio, , is consistent with both colliding wind binary (CWB) and high-mass X-ray binary (HMXB) systems (Paper I).
In the standard models for CWBs, X-ray emission arises from the shock front of colliding winds in two massive stars (see, e.g. Luo et al., 1990; Sana et al., 2004; De Becker et al., 2006). Observed variability is often attributed to phase-locked flux modulations due to the effect of variations in absorption along the line of sight and variations in X-ray emission as a function of orbital phase. In this situation, the X-ray periodicity reflects an orbital period. Alternatively, it is possible that stellar rotation or photospheric pulsation may also produce periodic X-ray modulations. Models of such behavior are often employed to explain the 84 d quasi-periodicity in Carinae (Davidson et al., 1998). In these situations, the modulation of the X-ray flux is correlated to recurrent behavior affecting the wind emission, but not related to the orbital period.
However, in HMXBs, periodic X-ray flux changes can be the result of either orbital or superorbital motion. A superorbital periodicity is defined as any periodicity apparent in the periodogram that is greater than the orbital period. The predominant model for superorbital periodicity is that of a precessing warped accretion disk; however, long period variations may also be due to the precession of a compact object (not applicable to black hole systems), periodic modulation of the mass accretion rate, or the influence of a third body (Paul et al., 2000; Ogilvie & Dubus, 2001; Clarkson et al., 2003). Superorbital variations divide into two broad observational classes. The first class is characterized by clear, stable X-ray variations of about 30 days, while the second class has longer, quasi-periodic variations ranging from days (Clarkson et al., 2003). The second class is considered quasi-periodic, because long term monitoring shows a broad power peak in the periodogram, often superposed on a red noise spectrum (e.g., Cyg X-2; Paul et al., 2000). Cen X-3, Cyg X-1, and Vela X-1 are all high-mass binary systems showing both orbital and superorbital periods. They range in X-ray luminosity from (Mikles et al., 2006, and references therein). The superorbital periods of these systems are 140 d, 142 d, and 93 d respectively and their orbital periods are 2.1 d, 5.6 d, and 8.9 d (Ogilvie & Dubus, 2001). Sood et al. (2007) interprets these superorbital periods as unstable. Of the 20 sources for which both the orbital and superorbital period are known, no definitive empirical trend defines the relationship (see Fig.1 of Sood et al., 2007).
The morphology of CXOGC J174536.1-285638’s X-ray light-curve is not inconsistent with that caused by a precessing accretion disk, in that the flux appears to vary uniformly in the hard and soft X-rays. However, there is presently no direct observational test to confirm that a period is superorbital rather than orbital. In order to verify the presence and physical cause of a superorbital period, additional physical parameters of the system are required, including the mass ratio of the system, the inclination of the disk with respect to the orbital plane, the orbital period, and the orbital separation (Clarkson et al., 2003). Thus, while we cannot rule out the possibility that this periodicity is superorbital, as yet, we do not have sufficient information to place meaningful constraints on the superorbital hypothesis. Thus for the remainder of this discussion, we restrict ourselves to exploring the possibility that the 189 d period is orbital rather than superorbital.
3.3 The Orbital Period Assumption
For both the CWB and HMXB cases, the X-ray periodicity can trace the orbital period. CWBs have periods of days to years while HMXBs have shorter periods ranging from hours to days (Vanbeveren et al., 1998; Lewin & van der Klis, 2006). In Paper I, we determine an absolute IR magnitude mag for CXOGC J174536.1-285638 using a distance of 8 kpc, reddening of , and a 2MASS magnitude of mag. Given that the source appears blended in 2MASS, we verify the magnitude using the UKIDSS Galactic Plane Survey where the source is clearly resolved (Lawrence et al., 2007; Lucas et al., 2007). The UKIDSS survey lists the magnitude as mag, which is consistent with 2MASS, given the photometric transform between the relevant filters in these two surveys is mag.
We can use CXOGC J174536.1-285638’s exceptional brightness and the X-ray period to place constraints on the nature of the system. For our purposes, the “primary” star (mass, ) will refer to the massive OB-star and the “secondary” star (mass, ) will refer to the companion whose nature has yet to be identified.
Using the mass function
where , we can generate a parameter space of orbital velocities and mass ratios for the system. Massive OB stars can range from and still emit strongly in the IR (see, e.g. Cox, 2000; Girardi et al., 2002). In Figure 11, we plot the mass ratio as a function of the inferred orbital velocity for a range of primary masses and note that the orbital velocity is less than our IR spectral resolution of for cases of mass ratio . Even for higher mass ratios, a radial velocity variation would have low signal-to-noise with our current observations. Thus, we require higher resolution spectroscopy in order to observe radial velocity variations in the IR associated with this periodicity.
In the next two sections we discuss the possibility that the modulations in X-ray flux are caused by (1) obscuration of the X-ray source by stellar wind; and (2) eclipse of the X-ray source.
3.3.1 Wind Obscuration Scenario
Wind obscuration resulting in variable column absorption may be responsible, in part, for the X-ray flux variations observed in CXOGC J174536.1-285638. This assumption would be most practically tested by analyzing the change in hardness, as softer X-ray photons are absorbed preferentially. Such analysis is hindered by the relative faintness of the X-ray source, i.e., the low count rate. For the spectra shown in Figure 6, the total integration time for each observation is 40 hours. For the higher flux observation on August 31, 2004, we observe a hardness ratio of , where the soft counts are summed from keV, the hard counts keV. The hardness ratio is and the error is estimated from Poisson noise. For the second spectrum at the lower flux stage, taken on March 30, 2004, the hardness ratio is . The errors of these two measurements make them consistent with no change in hardness. However, the low count rate makes it difficult to estimate the robustness of this result.
Energy-independent X-ray variations in the spectrum could result if electron scattering is an important source of absorption. By testing the possibility that an obscuring wind is solely responsible for the flux variations, we can find the upper limit of the mass loss rate of the massive star component of the system. If wind obscuration is only partially responsible for the flux variation, a lower mass-loss rate results. Thus, here, we are determining the most extreme wind-producing source required to produce the flux variations we observe.
CXOGC J174536.1-285638’s X-ray light-curve shows a maximum flux variation by a factor of 4 over the course of the 189 d period. Using this information, if we assume that the X-ray emitting source is being obscured by a windy counterpart, we can calculate the column density of the wind required to cause such absorption. Because there are insufficient counts in the low-flux state to fit the X-ray spectrum, we use the model fit from the high-flux state and create a dummy response with XSPEC to measure the amount of absorption required to decrease the flux by a factor of four. Given our initial (see Paper I), we find the column density from the obscuring wind must reach to cause the flux variation observed in CXOGC J174536.1-285638.
To estimate the absorption column caused by a dense stellar wind, we use the equation:
| (1) |
For a spherically symmetric shell, and a star with mass-loss rate and escape velocity ,
| (2) |
For an edge-on view of the system, , thus
| (3) |
Normalizing for typical values of and (see, e.g. Mokiem et al., 2007), this becomes
| (4) |
If we are not viewing the system edge-on, we must take into account the angle through which we are viewing the wind as an effect on the observed absorption column. We can parameterize this in terms of an impact factor such that . In this case, and
| (5) |
where . Larger impact values require windier stars to create the same absorption column, thus the values of estimated with Equation 4 should be considered a lower limit of the required to produce the absorption column that causes the flux change in CXOGC J174536.1-285638.
We estimate the mass loss for two special cases. In the first case, we postulate the IR light is dominated by a single bright source. In HMXBs, the star is expected to contribute more heavily to optical and IR emission than the accretion disk (Lewin et al., 1997). In certain CWB cases, especially of lower mass ratios, it is possible that a single source dominates emission (Lépine et al., 2001). Thus for CWB and HMXB scenarios in which a single star dominates the IR emission, we use CXOGC J174536.1-285638’s IR luminosity and estimate stellar characteristics based on the isochrones of Girardi et al. (2002) and find that a star with will likely have a radius valid for a range of masses . Using equation 4, we get a mass-loss rate of . In the second case, we consider a system that contains two massive stars, each contributing half of the IR luminosity which is only consistent for CWBs containing two stars of similar bolometric luminosity. These stars would have and . Typical massive O-stars are reported to have mass-loss rates of (Mokiem et al., 2007). Thus, even in the most extreme case, where the flux variation is caused entirely by absorption, a relatively windy star is necessary to produce the flux variations that we observe, but the mass-loss rate is not unreasonable.
3.3.2 The Eclipsing Binary Scenario
Assuming that the X-ray variability is caused by an eclipse has the greatest potential for constraining the nature of the system components, and also involves the most stringent physical constraints. We note that the X-ray light curve (Fig. 7) is atypical for a standard eclipsing source, both in the morphology of the dip and the phase duration of the low flux state. In a HMXB or CWB, the X-ray emitting region is small compared to the massive star. For a binary system in circular orbit, the eclipse of the X-ray region causes a decrease in X-ray emission that is relatively brief compared to the orbital period. For a binary system in an elliptical orbit, it is likely that the X-ray emitting region would experience periodic enhancement while the sources are in close approach. Our source spends approximately equal time at the high flux and low flux stage and transitions smoothly between the two. Despite this, we find it useful to explore the eclipsing assumption, as it allows us to define the limits of system in which the variation is caused by a combination of multiple effects (e.g., an eclipse plus wind obscurration).
By assuming that the low-flux portion of the dip is caused by an eclipse of the X-ray region, we estimate a transit time of d for the putative eclipse, limited by adjacent observations of the high-flux stage. We convert the transit time to a velocity by estimating . Combining this with the mass function, we get
| (6) |
where and are in units of solar masses and solar radii respectively. Assuming , we then solve the cubic equation for different scenarios. In Table 4, we list a series of mass ratios, , associated with varying fractions . As an example, we can examine the two cases as we did above. To complete this numerical exercise, we choose a median primary mass (while acknowledging that a wide range of masses is possible). If two massive stars each contribute half of the IR luminosity, then , , and the mass ratio is . This resulting mass ratio is inconsistent with our initial assumption of two massive stars contributing equally to the emission. If a single massive star dominates the IR emission, then , , and the mass ratio is . We find that adjusting the inclination does not significantly alter this result because “eclipsing” scenarios do not exist at low inclinations (; Terrell & Wilson, 2005).
In Figure 12, we plot the mass ratio as a function of transit time, to explore the possibility that only a fraction of the flux variation is caused by an eclipse of the X-ray source. We convert the transit time into an orbital velocity using the radii and as we did above to represent systems where two massive stars contribute to the IR luminosity and systems where a single source dominates the IR emission. We find that for transit times above 10 days (), the system is consistent with low mass ratios (). In systems where two stars are contributing equally to the IR luminosity (valid only for CWBs), the transit time would be days, corresponding to an orbital velocity days. Variability of this nature and on this timescale should have been apparent in our IR observations. Since we do not see those variations, we find eclipsing scenarios more likely for systems with lower mass ratios.
Thus if the system is a CWB, it would have to have a relatively low mass ratio with the IR emission dominated by a single source. This implies that the wind emission of one source overwhelms that of its companion (Luo et al., 1990). It is possible for CWBs to have lower mass ratios if the secondary is a Wolf-Rayet (WR) star. By the time a massive star reaches the WR stage, it may have a relatively small mass, but still have enormously powerful winds (Crowther, 2007). For example, is a WR+O star with a mass ratio (van der Hucht, 2001). In the case of , the WR star dominates the IR emission, so the source appears Helium rich (Crowther, 2007). It is possible that the Helium emission we observe in CXOGC J174536.1-285638 is evidence of an obscured WR companion. However, because Brackett series emission rather than Helium emission dominates the IR spectrum, we find this scenario less likely. In Table 5, we list line ratios of Br- to HeI 2.114m and Br- to HeII 2.189m for known CWBs and XRBs. In known WR+O binaries, the HeII 2.189m is notably stronger than Br-. Comparatively, CXOGC J174536.1-285638 has much stronger Br- emission, and hence a quite different Br-/ HeII line ratio from what is observed in WR+O systems. In fact, we note the Br-/HeI and Br-/HeII line ratios in CXOGC J174536.1-285638 are more consistent with HMXBs than either O+O or O+WR CWBs. Thus if CXOGC J174536.1-285638 is a WR+O CWB, it is very unusual. In the eclipsing binary scenario, CXOGC J174536.1-285638 would more likely be an HMXB.
3.3.3 CXOGC J174536.1-285638 as a Wind-Accreting HMXB
In Paper I, we showed that the X-ray luminosity of CXOGC J174536.1-285638 ( erg s-1) is consistent with HMXBs, within the observed range of X-ray luminosities between INTEGRAL sources identified as HMXBs ( erg s-1; Tomsick et al., 2006; Sidoli et al., 2006) and the canonically bright sources such as Cyg X-1 and Cen X-3 ( erg s-1; Nagase et al., 1992; Schulz et al., 2002). We explore the implications of the observed period for the case where CXOGC J174536.1-285638 is an accreting binary system with a compact object. Since the IR data suggest that CXOGC J174536.1-285638 contains a high-mass star, we focus on the case of wind-fed accretion.
Taking the standard accretion luminosity as
| (7) |
where is the efficiency of converting energy into X-ray light and is the accretion rate, we can rewrite this in terms of the mass loss rate of the donor star due to wind such that
| (8) |
We have normalized the mass loss rate of the primary due to wind and the accretion efficiency of the system with typical values found in Frank et al. (2002). Frank et al. (2002) estimate the accretion efficiency, , by comparing the mass flux within an accretion cylinder to the total mass loss of the donor star. The accretion cylinder is estimated from the gravitational potential of the compact object, giving
where , , and is the orbital separation. This gives us
| (9) |
Normalizing to standard values, and using our known values, we get
| (10) |
where and are normalized to solar radii and solar masses respectively. This form is useful for exploring the scenarios put forth in the previous sections. Because we are considering a wind-accreting HMXB, we use our previous estimate where a single massive star dominates the system, for mass between and radius .
The wind obscuration scenario gave an estimate of . We can then use Equation 10 and find that the mass ratio of the system is . This suggests a massive donor for a typical neutron star companion. By relaxing the estimate of the massive star radius, , we find that will increase and more compact object solutions exist over a wider range of primary masses. The estimate of is derived from the gravitational potential as estimated by Girardi et al. (2002). In Table 6, we list a series of solutions for Equation 10.
Because the eclipsing scenario case places firm constraints on the mass ratio of the system, we use Equation 10 to calculate the mass loss rates associated with various scenarios. We list those values in Table 4. For the case where the mass ratio is , the associated mass loss rate is low (), for an efficiency . This is not unreasonable for massive stars (Mokiem et al., 2007). Interestingly, in both the wind obscuration and the eclipsing binary scenario, the X-ray luminosity is consistent with a low mass ratio for the system.
4 Conclusions
We have searched for evidence of periodic variability in the IR spectra and long-term X-ray light-curve of the GC X-ray source CXOGC J174536.1-285638. We find no evidence of IR variability on short () timescales or between the 2005 and 2006 spectra. We compare the IR line ratios Br-/HeI and Br-/HeII in CXOGC J174536.1-285638 to known HMXBs and CWBs and find the relative emission line strengths to be more consistent with an HMXB. We have identified an apparent d period in the CXOGC J174536.1-285638 X-ray light curve. We find no evidence of periodic X-ray variability at timescales less than 189 d. Using a Monte Carlo simulation, we test the significance of the 189 d period detection; despite our fairly sparse time sampling, we find this period is significant with a confidence level greater than 99.997%. We explore several interpretations of the X-ray modulation.
It is plausible, if the source is a HMXB, that the periodic modulation is superorbital in nature and related to a precessing accretion disk, in which case, further observations are required to determine the orbital period of the system and thus the nature of the system components. If the source is a HMXB and the 189 d period is superorbital, then we expect to find a shorter orbital period. This putative orbital periodicity is not necessarily observable in the IR as in this scenario, the IR emission is dominated by a single bright source. If the orbital period is detectable in the X-ray, targeted observations with a sensitive detector over a time interval of weeks during the high flux stage are required to ensure sufficient counts to test for variability.
We also explore an orbital period interpretation and summarize scenarios for this in Table 7. If the observed period is orbital in nature, and the X-ray modulation is caused by obscuration of the X-ray source due to a dense wind, then CXOGC J174536.1-285638 is consistent with both CWB and HMXB interpretations. The further constraint of the X-ray luminosity is consistent with a massive () donor with a neutron star companion. If X-ray modulation is caused by an eclipse, the mass ratio is low and CXOGC J174536.1-285638 is more consistent with an HMXB interpretation. If the 189 d period is orbital, we may be able to identify the source nature by obtaining long term photometric observations in the IR. Also, targeted IR follow-up spectroscopy to cover multiple phases of the source period will allow us to search for a relationship between the X-ray and IR variability in this system. In the low flux phase, additional IR spectroscopic line features (e.g., absorption, P Cygni variation) may become apparent that can help us discern the nature of the stellar components.
Recently, Hyodo et al. (2008) reported the discovery of an early-type, Galactic Center source which appears to have many characteristics in common with CXOGC J174536.1-285638. The source, CXOGC J174645.3-281546, has an unusually strong FeXXV line (1 keV), shows X-ray variability of a factor of on a year timescale, and appears to have a high-mass star as its likely IR counterpart. As in CXOGC J174536.1-285638, its X-ray to IR luminosity ratio is . These intriguing similarities in X-ray spectral appearance, variability timescale, and luminosity lead us to suggest that it would be interesting in future observations to study this source in concert with CXOGC J174536.1-285638. Although there are only two sources with these properties known at present, it is possible that they could ultimately define a new (sub)class of early-type Galactic sources with strong FeXXV emission.
References
- Beckmann et al. (2005) Beckmann, V., et al. 2005, ApJ, 631, 506
- Benaglia et al. (2001) Benaglia, P., Cappa, C. E., & Koribalski, B. S. 2001, A&A, 372, 952
- Bodaghee et al. (2007) Bodaghee, A., et al. 2007, A&A, 467, 585
- Clark & Dolan (1999) Clark, L. L., & Dolan, J. F. 1999, A&A, 350, 1085
- Clark et al. (2003) Clark, J. S., Charles, P. A., Clarkson, W. I., & Coe, M. J. 2003, A&A, 400, 655
- Clarkson et al. (2003) Clarkson, W. I., Charles, P. A., Coe, M. J., Laycock, S., Tout, M. D., & Wilson, C. A. 2003, MNRAS, 339, 447
- Cohen (2000) Cohen, D. H. 2000, IAU Colloq. 175: The Be Phenomenon in Early-Type Stars, 214, 156
- Corbet (1986) Corbet, R. H. D. 1986, MNRAS, 220, 1047
- Cox (2000) Cox, A. N. 2000, Allen’s Astrophysical Quantities, 4th ed. Publisher: New York: AIP Press; Springer, 2000. Edited by Arthur N. Cox. ISBN: 0387987460
- Crowther (2007) Crowther, P. A. 2007, ARA&A, 45, 177
- Cushing et al. (2004) Cushing, M. C., Vacca, W. D., & Rayner, J. T. 2004, PASP, 116, 362
- Davidson et al. (1998) Davidson, K., Ishibashi, K., & Corcoran, M. F. 1998, New Astronomy, 3, 241
- De Becker et al. (2006) De Becker, M., Rauw, G., Sana, H., Pollock, A. M. T., Pittard, J. M., Blomme, R., Stevens, I. R., & van Loo, S. 2006, MNRAS, 371, 1280
- Eikenberry et al. (2001) Eikenberry, S. S., Cameron, P. B., Fierce, B. W., Kull, D. M., Dror, D. H., Houck, J. R., & Margon, B. 2001, ApJ, 561, 1027
- Fender et al. (2003) Fender, R., Migliari, S., & Méndez, M. 2003, New Astronomy Review, 47, 481
- Figer et al. (1997) Figer, D. F., McLean, I. S., & Najarro, F. 1997, ApJ, 486, 420
- Filliatre & Chaty (2004) Filliatre, P., & Chaty, S. 2004, ApJ, 616, 469
- Frank et al. (2002) Frank, J., King, A., & Raine, D. J. 2002, Accretion Power in Astrophysics, by Juhan Frank and Andrew King and Derek Raine, pp. 398. ISBN 0521620538. Cambridge, UK: Cambridge University Press, February 2002.
- Girardi et al. (2002) Girardi, L., Bertelli, G., Bressan, A., Chiosi, C., Groenewegen, M. A. T., Marigo, P., Salasnich, B., & Weiss, A. 2002, A&A, 391, 195
- Hanson et al. (1996) Hanson, M. M., Conti, P. S., & Rieke, M. J. 1996, ApJS, 107, 281
- Horne & Baliunas (1986) Horne, J. H., & Baliunas, S. L. 1986, ApJ, 302, 757
- Hyodo et al. (2008) Hyodo, Y., Tsujimoto, M., Koyama, K., Nishiyama, S., Nagata, T., Sakon, I., Murakami, H., & Matsumoto, H. 2008, PASJ, 60, 173
- Kirsch et al. (2005) Kirsch, M. G., et al. 2005, Proc. SPIE, 5898, 212
- Lawrence et al. (2007) Lawrence, A., et al. 2007, MNRAS, 379, 1599
- Lépine et al. (2001) Lépine, S., Wallace, D., Shara, M. M., Moffat, A. F. J., & Niemela, V. S. 2001, AJ, 122, 3407
- Lewin et al. (1997) Lewin, W. H. G., van Paradijs, J., & van den Heuvel, E. P. J. 1997, X-ray Binaries, Edited by Walter H. G. Lewin and Jan van Paradijs and Edward P. J. van den Heuvel, pp. 674. ISBN 0521599342. Cambridge, UK: Cambridge University Press, January 1997.
- Lewin & van der Klis (2006) Lewin, W. H. G., & van der Klis, M. 2006, Compact stellar X-ray sources.
- Liu et al. (2006) Liu, Q. Z., van Paradijs, J., & van den Heuvel, E. P. J. 2006, A&A, 455, 1165
- Lucas et al. (2007) Lucas, P. W., et al. 2007, ArXiv e-prints, 712, arXiv:0712.0100
- Luo et al. (1990) Luo, D., McCray, R., & Mac Low, M.-M. 1990, ApJ, 362, 267
- Mikles et al. (2006) Mikles, V. J., Eikenberry, S. S., Muno, M. P., Bandyopadhyay, R. M., & Patel, S 2006, ApJ, 651, 408
- Mineshige et al. (1994) Mineshige, S., Ouchi, N. B., & Nishimori, H. 1994, PASJ, 46, 97
- Mokiem et al. (2007) Mokiem, M. R., et al. 2007, A&A, 465, 1003
- Muno et al. (2003) Muno, M. P., et al. 2003, ApJ, 589, 225
- Muno et al. (2004a) Muno, M. P., et al. 2004a, ApJ, 613, 326
- Muno et al. (2004b) Muno, M. P., et al. 2004b, ApJ, 613, 1179
- Muno et al. (2006) Muno, M. P., Bauer, F. E., Bandyopadhyay, R. M., & Wang, Q. D. 2006, ApJS, 165, 173
- Muno et al. (2006) Muno, M. P., Bower, G. C., Burgasser, A. J., Baganoff, F. K., Morris, M. R., & Brandt, W. N. 2006, ApJ, 638, 183
- Nagase et al. (1992) Nagase, F., Corbet, R. H. D., Day, C. S. R., Inoue, H., Takeshima, T., Yoshida, K., & Mihara, T. 1992, ApJ, 396, 147
- Negueruela et al. (2005) Negueruela, I., Smith, D. M., Reig, P., Chaty, S., & Torrejón, J. M. 2006, The X-ray Universe 2005, 604, 165
- Negueruela & Schurch (2007) Negueruela, I., & Schurch, M. P. E. 2007, A&A, 461, 631
- Ogilvie & Dubus (2001) Ogilvie, G. I., & Dubus, G. 2001, MNRAS, 320, 485
- Paul et al. (2000) Paul, B., Kitamoto, S., & Makino, F. 2000, ApJ, 528, 410
- Predehl & Schmitt (1995) Predehl, P., & Schmitt, J. H. M. M. 1995, A&A, 293, 889
- Rayner et al. (2003) Rayner, J. T., Toomey, D. W., Onaka, P. M., Denault, A. J., Stahlberger, W. E., Vacca, W. D., Cushing, M. C., & Wang, S. 2003, PASP, 115, 362
- Sana et al. (2004) Sana, H., Stevens, I. R., Gosset, E., Rauw, G., & Vreux, J.-M. 2004, MNRAS, 350, 809
- Schulz et al. (2002) Schulz, N. S., Cui, W., Canizares, C. R., Marshall, H. L., Lee, J. C., Miller, J. M., & Lewin, W. H. G. 2002, ApJ, 565, 1141
- Sidoli et al. (2006) Sidoli, L., Mereghetti, S., Favata, F., Oosterbroek, T., & Parmar, A. N. 2006, A&A, 456, 287
- Sood et al. (2007) Sood, R., Farrell, S., O’Neill, P., & Dieters, S. 2007, Advances in Space Research, 40, 1528
- Terrell & Wilson (2005) Terrell, D., & Wilson, R. E. 2005, Ap&SS, 296, 221
- Timmer & Koenig (1995) Timmer, J., & Koenig, M. 1995, A&A, 300, 707
- Titarchuk et al. (2007) Titarchuk, L., Shaposhnikov, N., & Arefiev, V. 2007, ApJ, 660, 556
- Thaller (1997) Thaller, M. L. 1997, ApJ, 487, 380
- Tomsick et al. (2006) Tomsick, J. A., Chaty, S., Rodriguez, J., Foschini, L., Walter, R., & Kaaret, P. 2006, ApJ, 647, 1309
- Vacca et al. (2003) Vacca, W. D., Cushing, M. C., & Rayner, J. T. 2003, PASP, 115, 389
- Vanbeveren et al. (1998) Vanbeveren, D., de Donder, E., van Bever, J., van Rensbergen, W., & de Loore, C. 1998, New Astronomy, 3, 443
- van der Hucht (2001) van der Hucht, K. A. 2001, New Astronomy Review, 45, 135


| Obs ID | Date | Time (UT) | Exposure Time (min) |
|---|---|---|---|
| a | 2006-08-02 | 6:38 | 20 |
| b | 2006-08-02 | 7:05 | 20 |
| c | 2006-08-02 | 8:25 | 20 |
| d | 2006-08-02 | 8:55 | 16 |
| e | 2006-08-02 | 9:46 | 8 |
| f | 2006-08-03 | 5:27 | 16 |
| g | 2006-08-03 | 5:52 | 16 |
| h | 2006-08-03 | 6:37 | 20 |
| i | 2006-08-03 | 7:07 | 20 |
| j | 2006-08-03 | 7:49 | 20 |
| k | 2006-08-03 | 8:20 | 20 |
| l | 2006-08-03 | 9:02 | 20 |
| m | 2006-08-03 | 9:32 | 12 |
| n | 2006-08-04 | 5:51 | 20 |
| o | 2006-08-04 | 6:27 | 16 |
| p | 2006-08-04 | 6:46 | 16 |
| q | 2006-08-04 | 7:23 | 20 |
| r | 2006-08-04 | 7:58 | 16 |
| s | 2006-08-04 | 8:11 | 18 |
| t | 2006-08-04 | 8:47 | 20 |
| u | 2006-08-04 | 9:10 | 20 |
Note. — These observation IDs are associated with Figures 1 and 2. The days align with days 2404-2406 on our X-ray light curves.
| Date | Time | Obs. ID | Exp. Time | R.A. | Declination | Roll |
|---|---|---|---|---|---|---|
| (UT) | (ks) | (J2000) | (deg) | |||
| 2000-10-26 | 18:15:11 | 1561a | 35.7 | 266.41344 | -29.01281 | 264.7 |
| 2001-07-14 | 01:51:10 | 1561b | 13.5 | 266.41344 | -29.01281 | 264.7 |
| 2001-07-18 | 14:25:48 | 2284 | 10.6 | 266.40415 | -28.94090 | 283.8 |
| 2002-05-22 | 22:59:15 | 2943 | 34.7 | 266.41991 | -29.00407 | 75.5 |
| 2002-02-19 | 14:27:32 | 2951 | 12.4 | 266.41867 | -29.00335 | 91.5 |
| 2002-03-23 | 12:25:04 | 2952 | 11.9 | 266.41897 | -29.00343 | 88.2 |
| 2002-04-19 | 10:39:01 | 2953 | 11.7 | 266.41923 | -29.00349 | 85.2 |
| 2002-05-07 | 09:25:07 | 2954 | 12.5 | 266.41938 | -29.00374 | 82.1 |
| 2002-05-25 | 15:16:03 | 3392 | 165.8 | 266.41992 | -29.00408 | 75.5 |
| 2002-05-28 | 05:34:44 | 3393 | 157.1 | 266.41992 | -29.00407 | 75.5 |
| 2003-06-19 | 18:28:55 | 3549 | 24.8 | 266.42092 | -29.01052 | 346.8 |
| 2002-05-24 | 11:50:13 | 3663 | 38.0 | 266.41993 | -29.00407 | 75.5 |
| 2002-06-03 | 01:24:37 | 3665 | 89.9 | 266.41992 | -29.00407 | 75.5 |
| 2004-07-05 | 22:33:11 | 4683 | 49.5 | 266.41605 | -29.01238 | 286.2 |
| 2004-07-06 | 22:29:57 | 4684 | 49.5 | 266.41597 | -29.01236 | 285.4 |
| 2004-08-28 | 12:03:59 | 5360 | 5.1 | 266.41477 | -29.01211 | 271.0 |
| 2005-07-24 | 19:58:27 | 5950 | 48.5 | 266.41519 | -29.01222 | 276.7 |
| 2005-07-27 | 19:08:16 | 5951 | 44.6 | 266.41512 | -29.01219 | 276.0 |
| 2005-07-29 | 19:51:11 | 5952 | 43.1 | 266.41508 | -29.01219 | 275.5 |
| 2005-07-30 | 19:38:31 | 5953 | 45.4 | 266.41506 | -29.01218 | 275.3 |
| 2005-08-01 | 19:54:13 | 5954 | 18.1 | 266.41502 | -29.01215 | 274.9 |
| 2005-02-27 | 06:26:04 | 6113 | 4.9 | 266.41870 | -29.00353 | 90.6 |
| 2006-07-17 | 03:58:28 | 6363 | 29.8 | 266.41541 | -29.01228 | 279.5 |
| 2006-04-11 | 05:33:20 | 6639 | 4.5 | 266.41890 | -29.00369 | 86.2 |
| 2006-05-03 | 22:26:26 | 6640 | 5.1 | 266.41935 | -29.00383 | 82.8 |
| 2006-06-01 | 16:07:52 | 6641 | 5.1 | 266.42018 | -29.00440 | 69.7 |
| 2006-07-04 | 11:01:35 | 6642 | 5.1 | 266.41633 | -29.01237 | 288.4 |
| 2006-07-30 | 14:30:26 | 6643 | 5.0 | 266.41510 | -29.01218 | 275.4 |
| 2006-08-22 | 05:54:34 | 6644 | 5.0 | 266.41484 | -29.01202 | 271.7 |
| 2006-09-25 | 13:50:35 | 6645 | 5.1 | 266.41448 | -29.01195 | 268.3 |
| 2006-10-29 | 03:28:20 | 6646 | 5.1 | 266.41425 | -29.01178 | 264.4 |
| Observation ID | Date | Time (h) | Exposure Time (h) |
|---|---|---|---|
| 0112972101 | 2001-09-04 | 01:19:34 | 7.5 |
| 0111350101 | 2002-02-26 | 03:11:27 | 14 |
| 0111350301 | 2002-10-03 | 06:36:49 | 5 |
| 0202670501 | 2004-03-28 | 14:37:16 | 40 |
| 0202670601 | 2004-03-30 | 14:29:07 | 40 |
| 0202670701 | 2004-08-31 | 02:54:31 | 40 |
| 0202670801 | 2004-09-02 | 02:44:08 | 40 |
| 0.5 | ||
| 0.2 | ||
| 0.09 | ||
| 0.04 | ||
| 0.02 |
Note. — The mass ratio expected for a primary of the given mass to radius ratio in the eclipsing binary scenario. In Column 1, the ratios are in units of . Values of are more typical of brighter stars () and thus consistent with cases where a single massive star is dominating CXOGC J174536.1-285638’s IR emission. Values of are more consistent with stars such that CXOGC J174536.1-285638’s IR emission is composed of the flux from two bright stars. The estimation of is based on Equation 10, which is only valid for the HMXB case.
| Source | Equivalent Width () | Ref. | Br/HeI | Br/HeII | ||
|---|---|---|---|---|---|---|
| HeI | Br | HeII | ||||
| 2.114m | 2.166m | 2.189m | ||||
| CXOGC J174536.1-285638 | 13.8 | 36.6 | 2 | 1 | 2.65 | 18.3 |
| HMXB | ||||||
| Cir X-1 | 24.2 | 1.3 | 2 | 18.62 | ||
| IGR J16318-4848 (sgB[e]) | 5 | 45 | 5 | 9 | ||
| HD 34921 (B0I) | 1 | 6 | 6 | 6 | ||
| HD 24534 (O9III-Ve) | 2.7 | 14.5 | 2 | 5.37 | ||
| EXO2030+375 | 1.7 | 4 | 2 | 2.35 | ||
| V725Tau (O9.7IIe) | 13 | 6 | ||||
| O+O | ||||||
| HD 93205 (O3V) | 2 | 1.1 | 6 | 1.82 | ||
| HD 206267 (O6.5V) | 1.2 | 0.4 | 6 | 3 | ||
| HD 152248 (O7Ib) | 4 | 1.8 | 6 | 2.22 | ||
| HD 57060 (O7Ia) | 5 | 1.1 | 6 | 4.55 | ||
| HD 47129 (O8) | 7 | 6 | ||||
| HD 37043 (O9III) | 1.6 | 0.2 | 6 | 8 | ||
| HD 47129(O7.5I+O6I) | 7 | 6 | ||||
| HD 15558 (O5III) | 1.4 | 0.4 | 6 | 3.5 | ||
| HD 199579 (O6V) | 1.4 | 0.6 | 6 | 2.33 | ||
| O+WR | ||||||
| WR138 (WN5+O9) | 12 | 34 | 52 | 4 | 2.83 | 0.65 |
| WR139 (WN5+O6) | 15 | 28 | 66 | 4 | 1.87 | 0.42 |
| WR133 (WN4.5+O9.5) | 30 | 20 | 4 | 0.63 | ||
| WR127 (WN4+O9.5) | 16 | 41 | 77 | 4 | 2.56 | 0.53 |
| WR151 (WN4+O8) | 16 | 36 | 81 | 4 | 2.25 | 0.44 |
Note. — IR line ratios. We compare the relative strength of HeI and HeII lines to Br- in CXOGC J174536.1-285638 and a selection of HMXBs and CWBs. Note that the HeII 2.189m line in CXOGC J174536.1-285638 has a P Cygni profile. We group O+O and O+WR binaries separately, as the former systems are less likely to produce low mass ratios. In known WR+O systems, the Br-/HeII line ratio is significantly different than that observed in CXOGC J174536.1-285638. REFERENCES - (1) Paper 1; (2) Clark & Dolan (1999); (3) Clark et al. (2003); (4) Figer et al. (1997); (5) Filliatre & Chaty (2004); (6) Hanson et al. (1996).
| 80 | 20 | 0.010 | 0.2 |
| 80 | 60 | 0.011 | 0.6 |
| 80 | 100 | 0.016 | 1.6 |
| 50 | 20 | 0.015 | 0.3 |
| 50 | 60 | 0.022 | 1.3 |
| 50 | 100 | 0.026 | 2.6 |
| 20 | 20 | 0.03 | 0.6 |
| 20 | 60 | 0.06 | 3.6 |
| 20 | 100 | 0.07 | 7.0 |
Note. — The mass ratio and compact object mass expected for a primary of the given mass to radius ratio in the wind obscuration scenario, valid for the HMXB case. The estimation of is based on Equation 10. We use and assume an efficiency , and a mass loss rate . The value is most consistent with our observed IR luminosity (Girardi et al., 2002).
| WIND OBSCURATION SCENARIO | ECLIPSING BINARY SCENARIO |
|---|---|
| Two stars contributing equally to the IR luminosity (CWB) | |
| (Eq. 4) | (Eq. 6) |
| consistent | inconsistent with initial assumptions |
| One star dominating the IR luminosity (CWB) | |
| (Eq. 4) | (Eq. 6) |
| consistent | IR line ratios inconsistent with known WR+O systems |
| One star dominating the IR luminosity (HMXB) | |
| (Eq. 4) | (Eq. 6) |
| (Eq. 10) | (Eq. 10) |
| radius constraint suggests | consistent |
Note. — See details of more general cases and caveats in Section 3.3.3.