The spectroscopic variability of Teff and in the hot pulsating star Cephei
Abstract
Time resolved spectra of Cep yield the following average results: Teff =24000 250 K, = 3.91 0.05 and = 8.1 0.9 km s-1. N, O, Ne, Al, Si and S abundances are solar while C, Mg and Fe are slightly under-abundant. Pulsational amplitudes of Teff 700 K and 0.2 dex are found from H. The metal lines give similar amplitudes but centred on Teff 25000 K. An upper limit of 1.0 km s-1 to the variability of the microturbulence is derived from the Si iii triplet at 455 nm. The radial velocity amplitude derived from the core of H is 15 greater than that from the metal lines.
keywords:
Stars: individual: Cephei – Stars: early-type – Stars: oscillations – Stars: abundances1 Introduction
The capability of oscillations to probe the internal structure of stars is fully testified by solar studies. For this reason, pulsating stars, that are spread in the HR diagram, are expected to largely improve our knowledge of stellar evolution and physical assumptions in models.
Osaki (1971) has shown that both radial and non-radial modes of pulsating stars are observationally distinguishable via the analysis of line profile variation (LPV). From this pioneering work, there has been an increasing interest in LPV modeling driven by the improvement in resolution and efficiency of modern spectrographs: Lee & Saio (1990) included the influence of stellar rotation, Briquet et al. (2001) considered photospheric spots, Aerts et al. (1994) performed a mode identification via the moments of the line profile or Telting & Schrijvers (1997) via the Doppler imaging technique.
Dupret et al. (2002) noted that a pure kinematic approach is not enough for LPV modeling and that a realistic representation of the strength and broadening of spectral lines were necessary. They considered the atmosphere of a pulsating star as a perturbed status of the hydrostatic equilibrium and represented the temperature perturbation of atmospheric layers with a series expansion in terms of effective temperature and gravity.
This operative method does not clearly represent the physics of Cep stars, pulsation modes do not change the energy production and the very small (1%) stellar radius variation (Aerts et al., 1994) cannot modify neither the effective temperature nor the surface gravity in an observable way. However along a pulsation cycle, the compression and expansion of photospheric layers change the dependence of temperature and pressure on optical depth and let the effective temperature appear variable, with the pulsation period, if determined in a limited spectral interval. A phenomenon indeed observed in some Cephei stars by De Ridder et al. (2002) on the basis of a photometric approach. These authors derived a Teff variability up to 1000 K with the pulsation period, from Geneva colours.
With the density and temperature, the variation of atomic level populations should also result in apparent surface gravity variations. In fact, there is an equivalence between stellar surface gravity and electron pressure in the framework of spectral line formation (Gray, 1992).
A further contribution to the strength and profile of spectral lines comes from the microturbulence (), that in principle could be modified along compression and expansion phases.
In this paper we analyse a set of time resolved spectra of Cep (= HD 205021 = HR 8238), which is generally accepted to be the proto-type of a class of hot pulsating stars, with the aim of ascertaining the apparent variability of the effective temperature, gravity and microturbulence with the pulsation period. These variations would strongly constrain any LPV method, as the one proposed by Dupret and collaborators.
| HJD | Vrad | Teff | |
|---|---|---|---|
| (2554041.0+) | (km s-1) | (K) | |
| 0.2510 | 19.70 0.97 | 24500 310 | 3.95 0.04 |
| 0.2587 | 17.86 0.85 | 24150 240 | 3.87 0.05 |
| 0.2674 | 16.68 0.40 | 24300 240 | 3.89 0.05 |
| 0.2746 | 13.67 0.49 | 24250 220 | 3.90 0.05 |
| 0.2819 | 10.01 0.35 | 24150 220 | 3.88 0.05 |
| 0.2892 | 6.86 0.28 | 24050 210 | 3.88 0.05 |
| 0.2964 | 3.95 0.40 | 23800 200 | 3.81 0.05 |
| 0.3040 | 0.76 0.19 | 23700 160 | 3.78 0.04 |
| 0.3113 | 4.89 0.30 | 23750 170 | 3.78 0.04 |
| 0.3186 | 8.18 0.82 | 23700 160 | 3.77 0.04 |
| 0.3261 | 10.63 0.55 | 23850 210 | 3.81 0.05 |
| 0.3334 | 11.97 0.64 | 23850 210 | 3.85 0.06 |
| 0.3406 | 12.18 0.26 | 23850 220 | 3.84 0.06 |
| 0.3515 | 10.70 0.22 | 24150 210 | 3.88 0.05 |
| 0.3588 | 8.24 0.50 | 24400 220 | 3.92 0.04 |
| 0.3660 | 4.95 0.28 | 24200 210 | 3.89 0.05 |
| 0.3733 | 1.75 1.01 | 24300 240 | 3.90 0.05 |
| 0.3806 | 1.00 0.99 | 24400 260 | 3.92 0.04 |
| 0.3878 | 5.13 1.42 | 24250 250 | 3.89 0.06 |
| 0.3955 | 8.74 2.13 | 24200 250 | 3.86 0.06 |
| 0.4028 | 12.14 1.04 | 24200 250 | 3.89 0.06 |
| 0.4100 | 15.52 0.71 | 24350 250 | 3.91 0.06 |
| 0.4173 | 18.43 0.29 | 24350 240 | 3.90 0.05 |
| 0.4246 | 20.11 0.94 | 24350 210 | 3.92 0.04 |
| 0.4318 | 20.13 0.88 | 24300 210 | 3.90 0.05 |
| 0.4475 | 19.34 1.26 | 24050 210 | 3.87 0.05 |
| 0.4548 | 15.45 2.05 | 24050 230 | 3.87 0.05 |
| 0.4620 | 14.02 1.02 | 23850 210 | 3.83 0.05 |
| 0.4693 | 11.86 1.57 | 23900 210 | 3.84 0.05 |
| 0.4766 | 8.07 0.89 | 23800 190 | 3.81 0.05 |
| 0.4838 | 4.53 0.92 | 23800 190 | 3.81 0.05 |
2 Observations and data reduction
Spectroscopic observations of Cep have been carried out at the 91 cm telescope of the INAF - Osservatorio Astrofisico di Catania at R = 20 000 in the range 4300-6800 Å (Catanzaro, 2008).
Spectra were acquired during the night of November, the 1st 2006, starting at JD = 2454041.2510, for a total of 31 exposures. Taking into account the pulsational period P = 0.19048678 days (Chapellier, 1985), we set the exposure time to 10 minutes, 4 of the pulsational period, to avoid phase smearing effects. The stellar spectra, calibrated in wavelength and with the continuum normalised to a unity level, were obtained using standard data reduction procedures for spectroscopic observations within the NOAO/IRAF package (Catanzaro, 2008). The signal-to-noise ratio of our spectra always resulted above 200.
Instrumental systematic errors on radial velocities have been corrected observing stars with constant and well-known radial velocity taken from the list of standard stars published by Udry et al. (1999): HD 186791 and HD 206778.
3 Radial velocity variability
Radial velocities (Vrad) of Cep, as it is common for this class of pulsating stars, have been measured by means of the Siiii triplet at 4552, 4567 and 4574 Å. These are strong lines almost insensitive to temperature variations (De Ridder et al., 2002) and presenting no significative blending and.
Errors on Vrad have been computed assuming that the main source of error is the statistical noise in the observed spectrum. Velocities are reported in Tab. 1 together with the respective Heliocentric Julian Date and plotted in the bottom panel of Fig. 1. The parameters of the over-imposed sinusoidal fit have been computed adopting the pulsational period by Chapellier (1985). The results of fitting procedure were: an average value = 4.8 0.1 km s-1 and amplitude K = 16.3 0.2 km s-1.

4 Average stellar parameters
The first step to highlight the variability of effective temperature (Teff), surface gravity () and microturbulence () in Cep is the ascertainment of their average behaviour.
Leone & Manfrè (1997) have demonstrated that the effective temperature and gravity inferred from Balmer lines have to be determined simultaneously with abundances. These define the metal opacity and with it the dependence of the temperature on the optical depth (Leone & Manfrè, 1996). Moreover, the abundances define the Stark broadening of Balmer lines through the electron pressure. Similarly, the effective temperature and gravity of a star have to be determined simultaneously with the microturbulence. This velocity field defines the metal opacity through the line-blocking. This is an effect particularly important for a hot star whose flux is peaked in the ultraviolet where the largest concentration of atomic transitions appear. As to Cep, Morel et al. (2006) determined a rather high (63 km s-1) microturbulence certainly able to largely desaturate metal lines.
To establish the atmosphere parameters of Cep, we implemented the iterative procedure presented in Leone & Manfrè (1997) to include the microturbulence. In particular we compare the observed and theoretical profiles of H and H lines by minimising the residuals. Abundances are derived froma comparison between the observed average spectrum and SYNTHE spectra. Following Erspamer & North (2003), the observed spectrum has been divided to intervals of about 100 Å and abundances are given by the average values in different intervals. Errors represent the standard deviations. The microturbulence velocity is determined demanding that the abundances derived from 14 N ii and 17 O ii unblended lines are independent of equivalent widths. In this case, the abundances are derived by means of the WIDTH9 code (Kurucz & Avrett, 1981).
As regards the effective temperature and gravity we confirm the values found by Catanzaro (2008) (see Fig. 1 of that paper): Teff = 24000 250 K and = 3.91 0.05, while = 8.1 0.9 km s-1 and the abundances listed in Table 2.
As a general result, we derive abundances close to the solar values (Asplund et al., 2005), with the exception of carbon and iron for which a slight under-abundance has been inferred. The slight under-abundance of magnesium, here derived using only one line, has to be confirmed.
| This study | M06 | H94 N05 | |
|---|---|---|---|
| Teff (K) | 24000250 | 260001000 | 24550 24150350 |
| 3.910.05 | 3.700.15 | 3.772 3.69 | |
| (km s-1) | 8.10.9 | 63 | |
| El N | |||
| This study | M06 | A05 | |
| C 8 3.92 0.05 | 4.01 0.10 | 3.64 0.05 | |
| N 31 4.20 0.07 | 4.12 0.13 | 4.25 0.06 | |
| O 41 3.39 0.07 | 3.56 0.14 | 3.37 0.05 | |
| Ne 2 4.00 0.13 | 4.19 0.06 | ||
| Mg 1111Mgii 4481 Å 4.85 0.10 | 4.72 0.21 | 4.50 0.09 | |
| Al 5 5.80 0.30 | 6.02 0.16 | 5.66 0.06 | |
| Si 10 4.70 0.19 | 4.92 0.23 | 4.52 0.04 | |
| S 3 4.90 0.20 | 4.89 0.37 | 4.89 0.05 | |
| Fe 14 4.81 0.13 | 4.79 0.23 | 4.58 0.05 | |
5 Variability of atmosphere properties
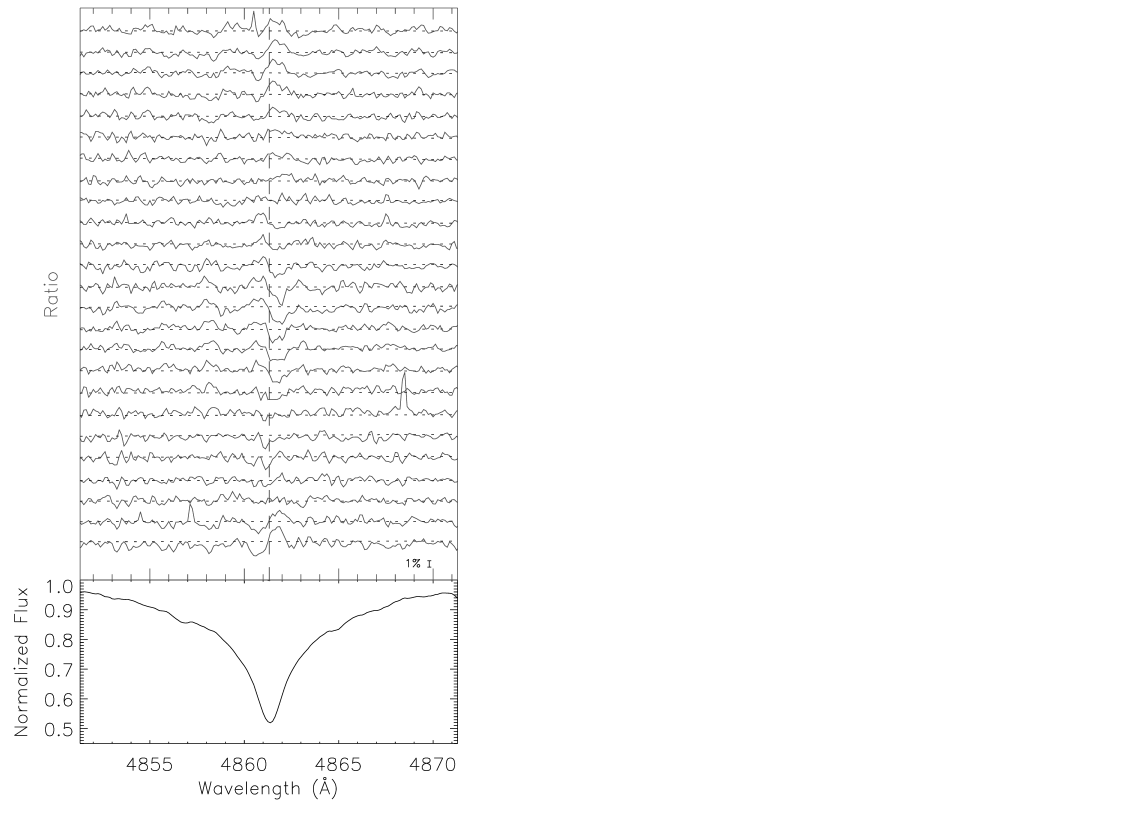
The spectral synthesis of the average spectrum of Cep shows the presence of strong oxygen lines in the wings of the H line. The equivalent width variability of oxygen lines with the pulsation period (Fig. 3) would complicate and false the result of any attempt to ascertain the variability of Teff and on the basis of this line. For this reason, we prefer to base this study on the H line only.
Before determining the effective temperature and gravity of any single spectrum, we check evidence for a variability in the H profile in addition to the radial velocity one: each spectrum has been Doppler corrected for the velocity determined by means of silicon lines and divided by the average H profile. These ratios are shown in the upper panel of Fig. 2. The usual spectral distortion due to pulsations characterises only the line core; this is here interpreted as evidence for a larger velocity presented by the outer layers. The variability of the radial velocity determined through the core of the H line presents an amplitude of 18.70.3 km s-1 and an average value of 0.2 km s-1.
5.1 Microturbulence
To point out any possible variability of stellar parameters with the pulsational period, we applied the previous iterative procedure to any single spectrum of Cep.
If we consider the effective temperature, gravity and microturbulence as free parameters, the microturbulence from nitrogen lines along the pulsation cycle results variable between 5.4 and 8.4 km s-1. Differently, the oxygen lines give a constant value equal to 8.10.9 km s-1.
Source functions of the considered 14 nitrogen and 17 oxygen lines are equally distributed in optical depth between and 2.06. These rule out any changing of the microturbulence with the atmospheric height.

| Wavelength (Å) | = 5.4 | 6.9 | 8.4 (km s-1) |
|---|---|---|---|
| 4552 | 160 | 183 | 206 |
| 4567 | 141 | 161 | 180 |
| 4574 | 104 | 118 | 131 |
The number and equivalent widths of the silicon lines in our spectra are not enough to measure the microturbulence. However, the Siiii triplet at 4552, 4567 and 4574 Å is very sensitive to this velocity field and rules out a microturbulence range larger than 1.0 km s-1. Table 3 shows that for the microturbulence variation deduced from nitrogen lines, the silicon triplet would present a 25% variability of equivalent widths much larger than the 7% observed (Fig. 3). We conclude that the microturbulence variability determined from nitrogen lines is a local minimum of the previous function and we assume a constant value for this velocity equal to the one we obtained from the average spectrum: = 8.1 km s-1.
5.2 Teff and variability
We find that the effective temperature and gravity of Cep are variable with the pulsation period (Tab. 1). Fig. 1 shows that Teff changes, almost sinusoidally from 23700 K to 24400 K, in phase with the variability from 3.76 to 3.93.
For a constant , the variability of equivalent widths with the pulsation period is also indicative of the temperature behaviour along a cycle. Fig. 3 shows that N ii and Si iii lines are in phase and that they change out of phase compared to O ii and Si iv. We have computed the expected equivalent widths of the representative lines of Fig. 3 for atmosphere models with 20000 30000 K, = 3.91, = 8.1 km s-1 and abundance listed in Table 2. It appears (Fig. 1) that the observed behaviour of these lines is due to a variation of the effective temperature between 25000 and 26000 K. That is a result in agreement with Morel et al. (2006) who derived an effective temperature of 26000 K from the ratio of Si iv and Si iii line strength. The top panel of Fig. 1 shows the N ii abundance computed along the pulsational phase, considering the corresponding values of Teff and and keeping constant the value of (8.1 km s-1). This reflects the variations of the ionisation state of nitrogen.
6 Conclusions
With the aim of determining the variations of the effective temperature, surface gravity and microturbulence velocity that occur in hot pulsating stars during the pulsational cycle, we performed time resolved R = 20000 spectroscopic observations of the prototype Cep along a complete period coverage.
As a first step, we confirm the Teff and found in a previous paper by Catanzaro (2008) and we measure = 8.1 0.9 km s-1, from a sample of single lines of Oii. With these values, the abundances resulted to be solar for nitrogen, oxygen, neon, aluminium, silicon and sulfur, while slight under-abundances have been inferred for carbon, magnesium and iron.
We find that along a pulsation cycle, after a correction for the pulsational Doppler shift, the H line profile changes are matched assuming a variability of the effective temperature in the range of 23700 to 24400 K and a variability of gravity in the range of 3.76 to 3.93. The amplitude of 0.08 dex measured in the gravity variation could lead the reader to the erroneous belief that it corresponds to a radius variation larger than the one computed by Aerts et al. (1994), via cinematic considerations. However, the variability of here determined for Cep is not a consequence of changes in the surface gravity because of expansions and compressions of the star as a whole. We ascribed the variability to a change of the electron pressure (Gray, 1992) induced by temperature, that modulates the ionisation state of metals. Thus, it should not be linked directly to the radius of the star.
Metal lines are characterised by equivalent widths variable with the pulsation cycle. These are explained by a variable effective temperature between 25000 and 26000 K as a consequence of the changed ionisation state. It could be that the most extended formation region of the H line is at the origin of the lower temperature, in agreement with the 15% larger amplitude presented by the radial velocity measured through the H core.

As to the possibility that the microturbulence depends on the compression and expansion of the atmospheric layers, we find that it is constant within a 1.0 km s-1.
We conclude that pulsations modify the dependence of the temperature and pressure on the optical depth in the atmosphere of Cep. This mimics a variability of the effective temperature and gravity when a small range of wavelengths is selected. We hope that this information can help in modeling the variability of spectral lines that is not only due to the pulsation velocity field (Dupret et al., 2002).
Along the expansion phase, the negative radial velocity is expected to increase up to a null value just in coincidence with the maximum of the stellar radius. At this phase of minimum compression, the photosphere is expected at the temperature minimum. Differently, we observe a delay in the temperature minimum about one tenth of the pulsation period. According to De Ridder et al. (2002), this extra-phase shift is due to the non-adiabatic condition that occurs in the pulsating layers.
Acknowledgments
The authors wish to thank Luigia Santagati for the english revision of the text.
References
- Aerts et al. (1994) Aerts C., Mathias P., Gillet D., Waelkens C., 1994, A&A, 286, 109
- Asplund et al. (2005) Asplund M., Grevesse N., Sauval A. J., 2005, in: Cosmic Abundances as Records of Stellar Evolution and Nucleosynthesis, ASP Conf. Ser., Vol. 336, eds.: Thomas G. Barnes III and Frank N. Bash
- Benz et al. (1982) Benz W., Mayor M., 1982, A&A, 111, 224
- Briquet et al. (2001) Briquet M., Aerts C., De Cat P., 2001, A&A, 366, 121
- Catanzaro (2008) Catanzaro G., 2008, MNRAS, 387, 759
- Chapellier (1985) Chapellier E., 1985, A&A, 147, 135
- Dupret et al. (2002) Dupret M.-A., De Ridder J., Neuforge C., Aerts C., Scuflaire R., 2002, A&A, 385, 563
- De Ridder et al. (2002) De Ridder J., Dupret M.-A., Neuforge C., Aerts C., 2002, A&A, 385, 572
- Erspamer & North (2003) Erspamer D., North P., 2003, A&A, 398, 1121
- Gray (1992) Gray D.F., 1992, The observation and analysis of stellar photospheres, Cambridge University Press.
- Hadrava & Harmanec (1996) Hadrava P., Harmanec P., 1996, A&A, 315, L401
- Heynderickx et al. (1994) Heynderickx D., Waelkens C., Smeyers P., 1994, A&AS, 105, 447
- Kunzli et al. (1997) Kunzli M., North P., et al., 1997, A&AS, 122, 51
- Kurucz (1993) Kurucz R.L., 1993, A new opacity-sampling model atmosphere program for arbitrary abundances. In: Peculiar versus normal phenomena in A-type and related stars, IAU Colloquium 138, M.M. Dworetsky, F. Castelli, R. Faraggiana (eds.), A.S.P Conferences Series Vol. 44, p.87
- Kurucz & Avrett (1981) Kurucz R.L., Avrett E.H., 1981, SAO Special Rep. 391
- Lee & Saio (1990) Lee U., Saio H., 1990, ApJ, 349, 570
- Leone & Manfrè (1996) Leone F., Manfrè M., 1996, A&A, 315, 926
- Leone & Manfrè (1997) Leone F., Manfrè M., 1997, A&A, 320, 257
- Morel et al. (2006) Morel T., Butler K., Aerts C., Neiner C., Briquet M., 2006, A&A, 457, 651
- Niecmzura & Daszyńska-Daszkiewwicz (2005) Niecmzura E., Daszyńska-Daszkiewwicz J., 2005, A&A, 433, 659
- Osaki (1971) Osaki Y., 1971, PASJ, 23, 485
- Pigulsky & Boratyn (1992) Pigulsky A., Boratyn D. A., 1992, A&A, 253, 178
- Sbordone et al. (2004) Sbordone L., Bonifacio P., Castelli F., Kurucz R., 2004, Mem. S.A.It. Suppl. Vol. 5, 93
- Telting & Schrijvers (1997) Telting J. H., Schrijvers C., 1997, A&A, 317, 723
- Udry et al. (1999) Udry S., Mayor M., Queloz D., 1999, Precise Stellar Radial Velocities, IAU Colloq. 170, ed. J. B. Heamshaw, & C. D. Scarfe, ASP Conf. Ser., 185, 367
- van Paradijs (1971) van Paradijs J. A., 1971, A&A, 11, 299