119–126
Galaxy And Mass Assembly (GAMA)
Abstract
The GAMA survey aims to deliver 250,000 optical spectra (3–7Å resolution) over 250 sq. degrees to spectroscopic limits of and mag. Complementary imaging will be provided by GALEX, VST, UKIRT, VISTA, HERSCHEL and ASKAP to comparable flux levels leading to a definitive multi-wavelength galaxy database. The data will be used to study all aspects of cosmic structures on 1kpc to 1Mpc scales spanning all environments and out to a redshift limit of . Key science drivers include the measurement of: the halo mass function via group velocity dispersions; the stellar, HI, and baryonic mass functions; galaxy component mass-size relations; the recent merger and star-formation rates by mass, types and environment. Detailed modeling of the spectra, broad SEDs, and spatial distributions should provide individual star formation histories, ages, bulge-disc decompositions and stellar bulge, stellar disc, dust disc, neutral HI gas and total dynamical masses for a significant subset of the sample (k) spanning both the giant and dwarf galaxy populations. The survey commenced March 2008 with 50k spectra obtained in 21 clear nights using the Anglo Australian Observatory’s new multi-fibre-fed bench-mounted dual-beam spectroscopic system (AA).
keywords:
galaxies:general, galaxies:structure, galaxies:formation, galaxies:evolution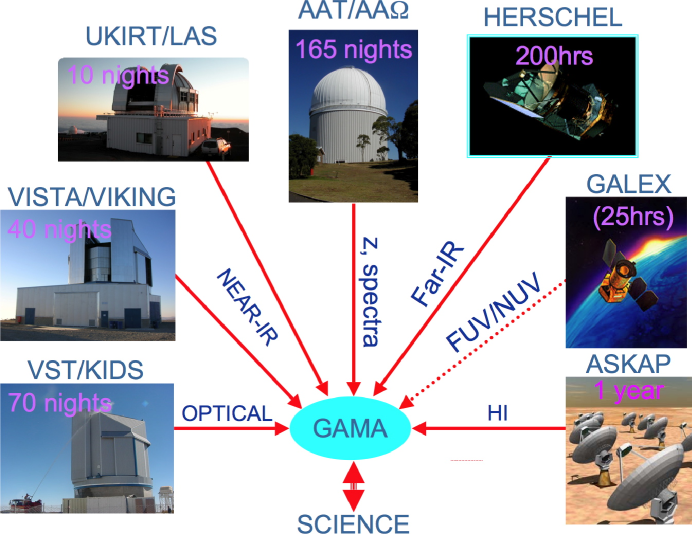
1 GAMA Motivation
Galaxy And Mass Assembly (GAMA) is a major expansion of the Millennium Galaxy Catalogue (MGC) survey (Liske et al 2003; Allen et al 2005; Driver et al 2005) and a natural extension of the extremely productive nearby “Legacy” surveys (e.g., SDSS, 2MASS, HIPASS etc). In comparison to the superb SDSS survey GAMA will only sample 250 sq degrees of sky but will extend to significantly fainter spectroscopic limits (12 the redshift density of SDSS main, 5 stripe 82), to higher spatial ( FWHM) and spectral (3—7Å) resolutions, as well as moving to a far broader wavelength coverage (UV to Radio). GAMA has come about by parallel technological developments leading to a suite of new facilities whose survey sensitivities, resolutions, and capabilities are reasonably well matched. Until now the study of galaxies has generally been restricted to either large samples of limited wavelength data or multi-wavelength studies of small (and often biased) samples. However galaxy systems are extremely complex and diverse, exhibiting strong environmental and mass dependencies and containing distinct but interlinked components (AGN, nucleus, bulge, pseudo-bulge, bar, disc etc) and constituents (SMBH, plasma, stars, gas, dust etc). It then follows that a clear understanding of galaxy formation and evolution may only come about via the construction of a comprehensive survey which simultaneously samples all of these facets. The GAMA team aims to provide this data. In addition to the provision of a generic galaxy database, the GAMA project also includes a number of more focussed science goals, in particular:
-
1. Measurement of the Halo Mass Function via virialised group velocity dispersions to directly test the numerical prediction from CDM (and WDM) simulations.
-
2. Measurement of the dynamic, baryonic, HI and stellar mass functions to LMC masses versus redshift, environment, type, and component (as well as higher order relations, e.g., mass-spin []).
-
3. Measurement of the recent merger rates and star formation rates versus type, mass and environment over a 3—4 Gyr baseline.
2 Facilities Contributing to GAMA
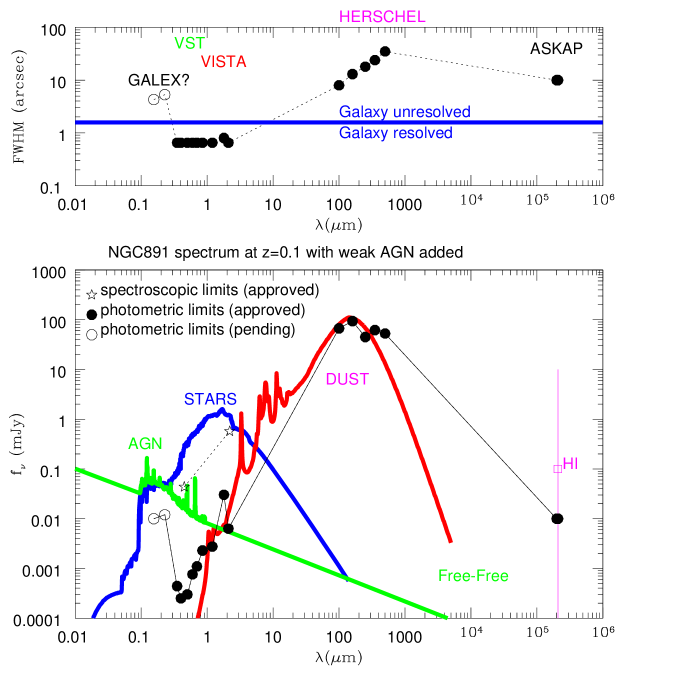
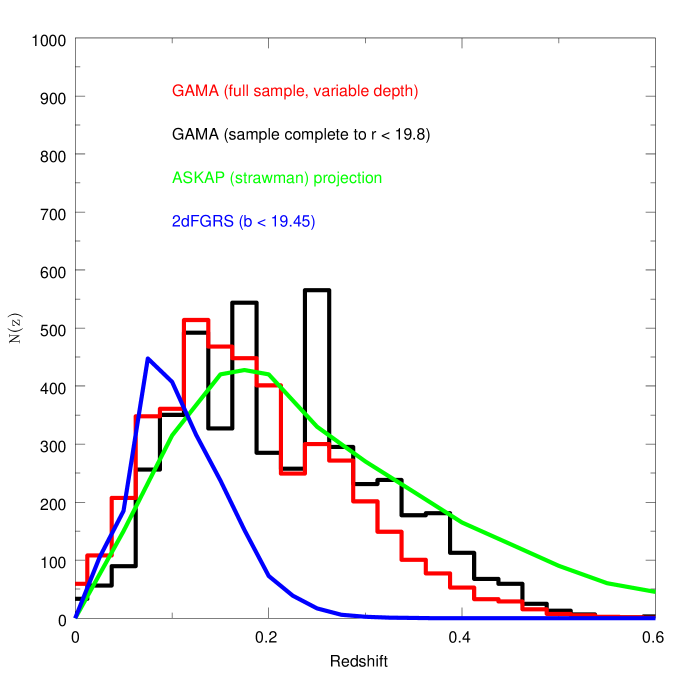
Fig. 1 shows the facilities currently contributing to the GAMA project along with the approximate time allocations within the GAMA sky regions (see Fig. 2 and Tables 1 & 2). The expected source resolution and detection sensitivities (5 point source) are shown in Fig. 3 (upper and lower) in arcseconds and milliJanskys. Overlaid on the lower panel is the modelled NGC891 spectra (Popescu et al., 2000) with a weak AGN added and transposed to . The UKIRT data is provided courtesy of the UKIDSS LAS Public Survey while the VST and VISTA data are provided via the KIDS and VIKING ESO Public Surveys (whose teams include GAMA members). The Herschel data is provided as part of the broader Herschel-ATLAS survey and a proposal is currently pending to complete GALEX medium depth observations of the GAMA regions (50% already covered with MIS). A major advancement over previous surveys will be the inclusion of radio data via ASKAP (Australian Square Kilometer Array Pathfinder, see Johnston et al. 2007) which should allow HI mass, dynamical mass and continuum measurements for all GAMA galaxies with high or normal neutral gas content. The deep ASKAP pointing (a single field of 1 year integration) is predicted to have an n(z) distribution comparable to that derived for GAMA (see Fig. 4). While the exact location of the ASKAP deep pointing has not been finalised it is highly likely, given the similarity in the n(z) distributions that one of the GAMA fields will be adopted (nominally the 12hr field).
| GAMA | Year 1 Regions | Extension 1 | Extension 2 | |||
|---|---|---|---|---|---|---|
| Field ID | RA(deg) | (deg) | RA(deg) | (deg) | RA(deg) | (deg) |
| G09 | 129.0 — 141.0 | -1 — +2 | 129.0 — 141.0 | -1 — +3 | 129.0 — 141.0 | -3 — +3 |
| G12 | 174.0 — 186.0 | -2 — +1 | 174.0 — 186.0 | -2 — +2 | 129.0 — 186.0 | -3 — +3 |
| G14 | 211.5 — 223.5 | -1 — +2 | 211.5 — 223.5 | -2 — +2 | 211.5 — 223.5 | -3 — +3 |
| G03 | — | — | 45.0 — 57.0 | -28 — -31 | — | — |
| G22 | — | — | 348.0 — 360.0 | -28 — -31 | — | — |
| Window | Facility | Collab.(Time) | Detection limits | Resol. | GAMA Fields | ||||
| UV | GALEX | MIS + | FUV | NUV | FUV/NUV | G09,G12,G15 | |||
| 25hrs pend. | 23.0 | 23.0 | 4—5′′ | ||||||
| Opt | SDSS | DR6 | u | g | r | i | z | u-z | G09,G12,G15 |
| 22.0 | 22.0 | 22.2 | 21.3 | 20.5 | 1.0′′-2.5′′ | ||||
| VST | KIDS (70n) | 24.8 | 25.4 | 25.2 | 24.2 | — | 0.6′′ — 1.0′′ | All | |
| Near-IR | UKIRT | LAS (10n) | Z | Y | J | H | K | Z-K | G09,G12,G15 |
| — | 20.9 | 20.6 | 20.3 | 20.1 | 0.6′′-1.0′′ | ||||
| VISTA | VIKING (40n) | 23.1 | 22.3 | 22.1 | 21.5 | 21.1 | 0.6′′—0.8′′ | All | |
| Far-IR | Herschel | ATLAS (200hrs) | 110m | 170m | 250m | 350m | 500m | 110—500m | |
| 67mJ | 94mJ | 45mJ | 62mJ | 53mJ | 8—35′′ | All | |||
| Radio | ASKAP | DEEP (1 year) | 0.7-1.8 GHz | 0.7-1.8GHz | G12? | ||||
| 10J | 10′′ | ||||||||
3 First Light
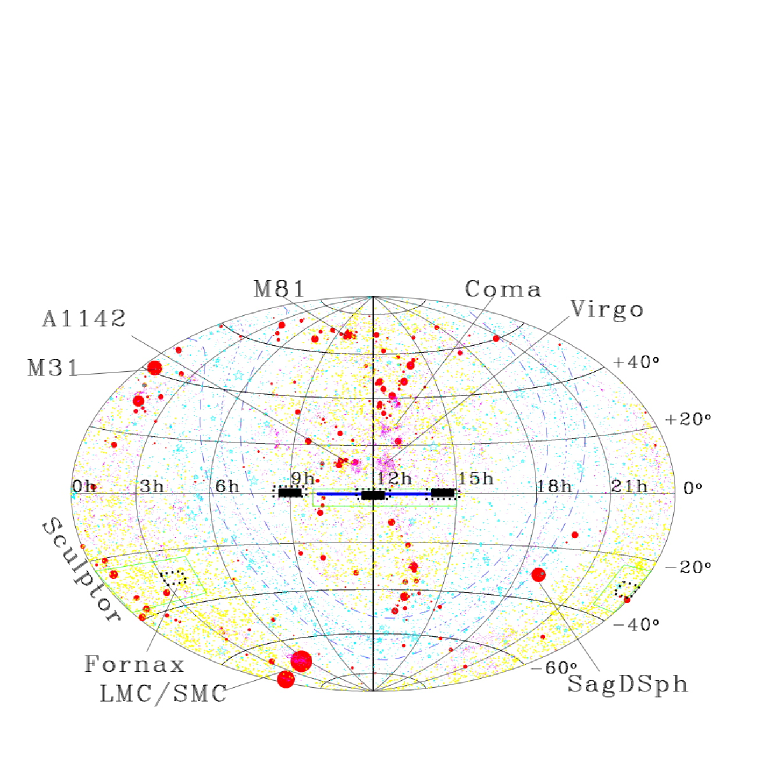
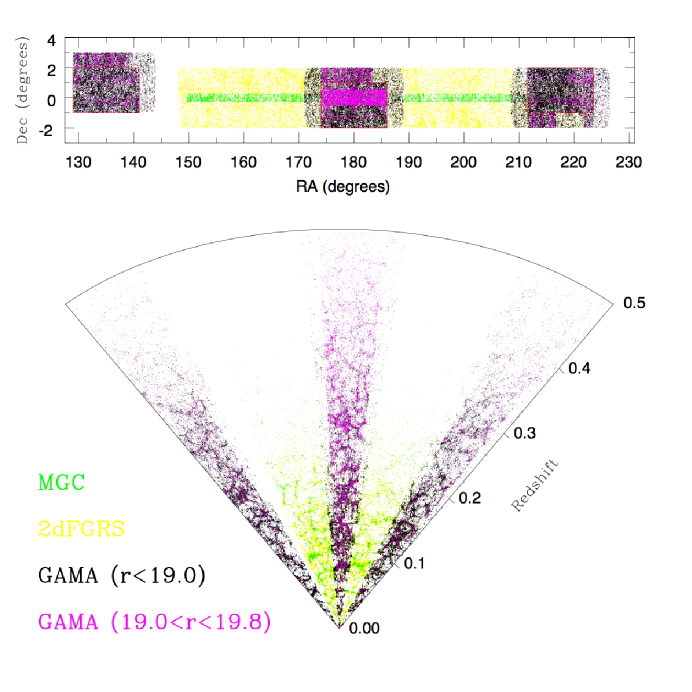
The survey commenced March 2008 with 50k spectra obtained in 21 clear nights using the Anglo Australian Observatory’s new multi-fibre-fed bench-mounted dual-beam spectroscopic system (AA). Fig. 5 shows the areas of sky surveyed (upper) and the resulting cone plot (lower). This includes the existing 25k redshifts within these regions from the MGC, SDSS and 2dFGRS. AA represents an upgrade of the pre-existing 2dF system using the same fibre positioner/tumbler but replacing the two telescope mounted spectrographs with a single bench-mounted, double-beam spectrograph (see Sharp et al. 2006 or the AAO website). The facility can be used for both multi-fibre and integral field spectroscopy and in multi-fibre mode is capable of obtaining 350—400 spectra in a single 2o diameter field. During an 8hr observation period the system is capable of obtaining 3000 spectra. Data are reduced in real-time and redshifts also obtained in real-time via cross-correlation with a template library. All data are later re-reduced and processed with GANDALF (see Schawinski et al 2007) to obtain line indices and velocity dispersion measurements. The GAMA survey at the AAT uses the 580V and 385R gratings yielding a resolution of 1300 or 3—7ÅFWHM.
4 Summary
The GAMA project has commenced with data flows imminent from a number of international facilities. The survey will allow for a comprehensive study of structure on 1kpc to 1Mpc scales as well as the subdivision of the galaxy population into its distinct components and constituents. Progress and data releases (1st data release forecast for Dec 2009) can be monitored via the GAMA website: http://www.eso.org/jliske/gama/ and anyone interested in further details should contact Simon Driver at spd3@st-and.ac.uk.
The GAMA team acknowledges all staff of the Anglo Australian Observatory for the provision of the superb AA facility and the continued smooth running of the Anglo Australian Telescope. SPD wishes to thank the IAU254 organisers for a most enjoyable meeting.
Allen P.D., et al., 2005, MNRAS, 371, 2 Driver S.P., et al., 2005, MNRAS, 360, 81 Driver S.P., et al., 2008, ApJL, 678, 101 Johnston S., et al., 2007, PASA, 24, 174 Liske J., et al., 2003, MNRAS, 344, 307 Popescu C.C., et al 2000, A&A, 362, 138 Sharp R., et al., 2006, SPIE, 6269, 14 Schawinski et al., 2007, MNRAS, 382, 1415