Comment on “Molybdenum at High Pressure and Temperature: Melting from Another Solid Phase”
pacs:
64.10.+h,64.70.D-,64.70.K-,71.15.PdThere has been a major controversy over the past seven years about the high-pressure melting curves of transition metals. Static compression (diamond-anvil cell: DAC) experiments up to the Mbar region give very low melting slopes , but shock-wave (SW) data reveal transitions indicating much larger values. Ab initio calculations support the correctness of the shock data. In a very recent Letter [belonoshko08, ] , Belonoshko et al. propose a simple and elegant resolution of this conflict for molybdenum. Using ab initio calculations based on density functional theory (DFT) , they show that the high-/high- phase diagram of Mo must be more complex than was hitherto thought. Their calculations give convincing evidence that there is a transition boundary between the normal bcc structure of Mo and a high- phase, which they suggest could be fcc. They propose that this transition was misinterpreted as melting in DAC experiments [errandonea01, ]. In confirmation, they note that their boundary also explains a transition seen in the SW data [hixson89, ]. We regard Belonoshko et al.’s Letter as extremely important, but we note that it raises some puzzling questions, and we believe that their proposed phase diagram cannot be completely correct. Since the neighbors of Mo in the series are the hcp-structured Tc and Ru, we would expect Mo to transform more readily to the hcp structure than to the fcc structure suggested by Belonoshko et al. Indeed, if their phase diagram were correct, it would imply that at Mbar, there are two separate stability fields of fcc, which would be highly unusual. Another puzzle is that in the DAC experiments [errandonea01, ] , the samples are reported to be in a liquid-like state on the high- side of the boundary where Belonoshko et al. propose that the material is crystalline.
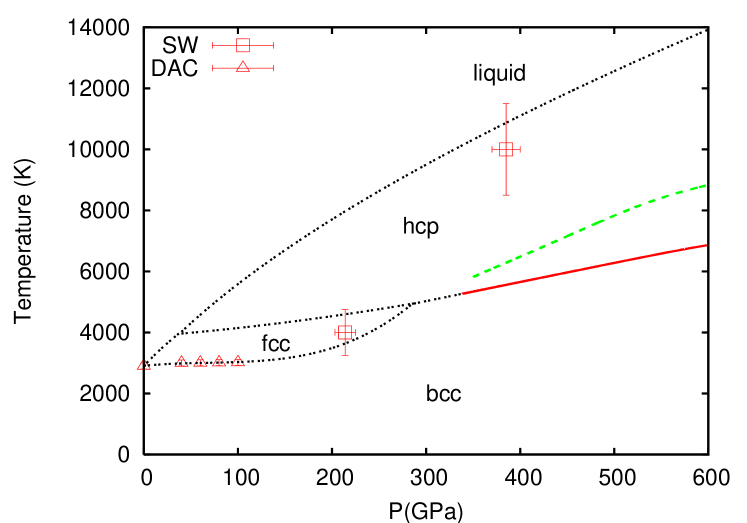
To check whether hcp, rather than fcc, could be the stable phase at high-/high- , we have calculated the Helmholtz and Gibbs free energies of the bcc, fcc and hcp phases of Mo, using essentially the same quasiharmonic methods as used by Belonoshko et al. The phonon frequencies in our calculations were obtained using the small-displacement method [kresse95, ] , with large supercells of 216 atoms and full inclusion of thermal electronic excitations. Our calculated bcc-fcc boundary for Mbar, where fcc is vibrationally stable, agrees very closely with that of Belonoshko et al. However, we find that hcp is noticeably more stable in this region and our bcc-hcp boundary is reported in Fig. 1 . Surprisingly, the bcc-fcc slope is higher than the bcc-hcp one, so that there must be a bcc-fcc-hcp triple point at Mbar and K. The resulting schematic phase diagram of Mo shown in Fig. 1 indicates that the transition seen in DAC experiments is indeed bcc-fcc. Concerning the possible liquid-like behaviour of the crystal above the bcc-fcc boundary, we comment on the harmonic vibrational instability of fcc below Mbar found by Belonoshko et al. Our calculations confirm this instability, and show that it is associated with a negative shear elastic constant. We find that hcp is also elastically unstable at K and Mbar. Above the bcc-fcc boundary, the crystal must therefore be highly anharmonic and stabilized by entropy. The implication is that above this boundary the fcc and hcp phases have almost exactly the same free energy and both are on the verge of elastic instability. It seems highly likely that these unusual features underly the controversial interpretation of the static compression measurements.
References
- (1) A. B. Belonoshko et al., Phys. Rev. Lett. 100, 135701 (2008).
- (2) D. Errandonea et al., Phys. Rev. B 63, 132104 (2001).
- (3) R. S. Hixson et al., Phys. Rev. Lett. 62, 637 (1989).
- (4) G. Kresse et al., Europhys. Lett. 32, 729 (1995); D. Alfè (1998), PHON program available at http://chianti.geol.ucl.ac.uk/dario .