Evolution of Star-forming Galaxies seen from Lyman Break Galaxies at
Abstract
Properties of Lyman Break Galaxies at are presented and are compared with those at LBGs to see evolution of LBGs from to . The LBGs at are tend to have smaller stellar masses, but they may show large star formation rates and specific star formation rates.
1. Introduction
We have been studying properties of Lyman Break Galaxies (LBGs) at , Gyr after the Big Bang and before . In this contribution, we present our recent results obtained for LBGs and possible evolution from LBGs to LBGs. Our sample at was made in a field including the Hubble Deep Field North (HDF-N) by using the Subaru SCam through -, -, and -filters. Since in and around the HDF-N field many spectroscopic data were available, the color criteria to select the LBGs can be reliably examined. A sample of LBGs was chosen from galaxies brighter than mag. A number of the sample is in an area of arcmin2.
2. Luminosity dependent evolution?
UV luminosity function is presented by Iwata et al. (2003, 2007, 2008 this volume). In their results, from to , a number of faint LBGs (fainter than ) is increasing with redshift, while in the brighter part the number does not change significantly. Although there is a controversy on this result, a luminosity dependent evolution of UV luminosity function is indicated.
Spectroscopic follow-up observations of a part of our LBG sample were made by Ando et al. (2004). They found that UV luminous LBGs (brighter than ) do not show large equivalent width of Ly emission line. Ando et al. (2006) showed this trend together with other LBGs as well as Ly emitters (LAEs). This may be due to the dusty environment or the presence of more massive HI gas in the luminous LBGs.
3. Stellar masses and star formation rates in LBGs
Using public IRAC data in the GOODS-N region and those obtained in the flanking fields, we constructed a LBG sample with IRAC photometry. From the sample of the LBGs mentioned above, we selected the LBGs those are free from the contamination by neighboring objects by eye inspection. The sample size is ; about half of them are detected both in IRAC channels 1 and 2. We derived the Spectral Energy Distributions (SEDs) for the sample, and made SED fitting. The spectral model adopted for the SED fitting we use is rather traditional, because we intend to compare with the results obtained in the previous studies at ; stellar synthesis code by Bruzual and Charlot (2003) with 0.2 , the Salpeter IMF () under constant star formation history, and Calzetti extinction curve (Calzetti et al. 2000). We include the H emission line calculated from the model intrinsic star formation rate and extinction. The SED fitting method is the essentially the same as that by Sawicki and Yee (1998). In the fitting, we fixed the redshift to be 4.8.
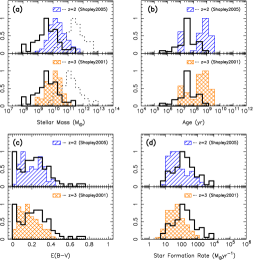
The resulting stellar masses, star formation ages, color excess, and star formation rates are presented in Figure 1 (left) overlayed with those obtained for LBGs (Shapley et al. 2001) and for LBGs (Shapley et al. 2005). The rest-frame UV luminosity and optical luminosity of these samples are mostly overlapped each other. The stellar masses of the LBGs are significantly smaller than those at , and ages are smaller on average. These suggest the premature nature of the LBGs. Stellar mass function and stellar mass density at are presented by Yabe et al. (2008, this volume).
4. LBGs with large SFRs?
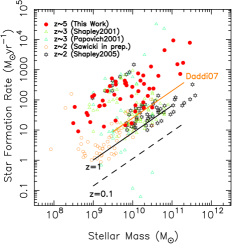
As seen from Figure 1 (left), the star formation rates (SFRs) are systematically larger than those in LBGs. Figure 1 (right) shows SFRs against their stellar masses for LBGs (filled circles). The SFRs are very high amounting to several hundreds yr-1. These values are significantly larger than those seen in LBGs shown as open symbols in Figure 1 (right). They are also larger compared with the results for star forming galaxies (e.g., Daddi et al. 2007). The specific star formation rates tend to decrease with decreasing redshift. It is suggested that the LBGs are in active star forming phase and have dusty environment. In fact, the color excesses obtained for the LBGs tend to be larger than those obtained for LBGs (Figure 1(left)). We may be witnessing an emergence of a population of active star forming galaxies at .
If the LBGs keep the high SFRs, they should have stellar masses more than at . The distributions of the expected stellar masses at are shown as dotted lines in Figure 1(left), suggesting that the LBGs are not the progenitor of the LBGs or the large SFRs should decline. If the SFRs decline exponentially with a time scale of yr, SFRs should be very much small at . Thus the star formation may be episodic if the LBGs are the progenitor of LBGs. Or they might be progenitor of passive massive galaxies at .
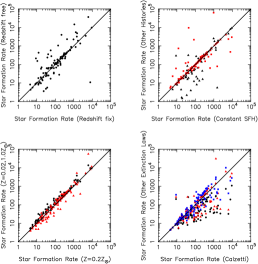
However, as known well, there may be an age-extinction degeneracy in the SED fitting. Because we do not have NIR photometric data, our SED fitting may suffer from the degeneracy. To examine this, we made SED fitting for LBGs at sampled by Stark et al. (2007) in which and photometry are available. We made SED fitting with and without and data. The resulting output parameters are shown in Figure 2 (left). The stellar masses are robust as seen from the figure. The SFRs are also rather robust (except for a few extraordinary cases), though the error bars are large. We also estimated the color excess using the method by Meurer et al. (1995), and found many of the objects have the color excesses consistent with the SED fitting. We also made various tests to see whether the large SFRs are due to some artificial causes. Figure 2 (right) shows output parameters of the SED fitting when we take redshift as a free parameter (upper left panel), other star formation history (upper right panel), metallicity (lower left panel), and other extinction curves (lower right panel). As seen from the panels, except for the adoption of other extinction curves, majority of estimated SFRs agree with those obtained in the fiducial model.
No LBGs with large SFRs coincide with SCUBA sources (Pope et al. 2005), X-ray sources (Alexander et al. 2003), and VLA sources (Richards 2000). The estimated upper limits on SFRs from these surveys are yr-1. It is worth noting that many of these LBGs with large SFRs do not reside in the SCUBA/Chandra surveys. Further observations are necessary to definitively conclude the presence of such population.

References
- Alexander et al. (2003) Alexander, D. M., et al. 2003, AJ, 126, 539
- Ando et al. (2004) Ando, M., et al. 2004, ApJ, 610, 635
- Ando et al. (2006) Ando, M., et al. 2006, ApJ, 645, L9
- Bruzual and Charlot (2003) Bruzual, A. G., & Charlot, S. 2003, MNRAS, 344, 1000
- Calzetti et al. (2000) Calzetti, D., et al. 2000, ApJ, 533, 682
- Daddi et al. (2007) Daddi, E., et al. 2007, ApJ, 670, 156
- Iwata et al. (2003) Iwata, I., et al. 2003, PASJ, 55, 415
- Iwata et al. (2007) Iwata, I., et al. 2007, MNRAS, 376, 1557
- Meurer et al. (1995) Meurer, G. R., Heckman, T. M., & Calzetti, D. 1995, ApJ 521, 64
- Pope et al. (2005) Pope, A., et al. 2005, MNRAS, 358, 149
- Richards (2000) Richards, E. A. 2000, ApJ, 533, 611
- Sawicki and Yee (1998) Sawicki, M., & Yee, H. K. C. 1998, AJ, 115, 1329
- Shaplaey et al. (2001) Shapley, A. E., et al. 2001, ApJ, 562, 95
- Shapley et al. (2005) Shapley, A. E., et al. 2005, ApJ, 626, 698
- Stark et al. (2007) Stark, D. P., et al. 2007, ApJ, 659, 84