New XMM-Newton analysis of three bright X-ray sources in M31 globular clusters, including a new black hole candidate
Abstract
We present detailed analysis of three globular cluster X-ray sources in the XMM-Newton extended survey of M31. The X-ray counterpart to the M31 globular cluster Bo 45 (XBo 45) was observed with XMM-Newton on 2006 December 26. Its combined pn+MOS 0.3–10 keV lightcurve was seen to vary by 10%, and its 0.3–7.0 keV emission spectrum was well described by an absorbed power law with photon index 1.440.12. Its variability and emission is characteristic of low mass X-ray binaries (LMXBs) in the low-hard state, whether the accretor is a neutron star or black hole. Such behaviour is typically observed at luminosities 10% Eddington. However, XBo 45 exhibited this behaviour at an unabsorbed, 0.3–10 keV luminosity of 2.50.2 erg s-1, or 140% Eddington for a 1.4 neutron star accreting hydrogen. Hence, we identify XBo 45 as a new candidate black hole LMXB. XBo 45 appears to have been consistently bright for 30 years, consistent with theoretical prediction for a globular cluster black hole binary formed via tidal capture. Bo 375 was observed in the 2007, January 2 XMM-Newton observation, and has a two-component spectrum that is typical for a bright neutron star LMXB. Bo 135 was observed in the same field as Bo 45, and could contain either a black hole or neutron star.
Subject headings:
X-rays: binaries — galaxies: individual: M31 — methods: data analysis1. Introduction
Of the 14 bright low mass X-ray binaries (LMXBs) associated with Galactic globular clusters (GCs), 13 are known to contain neutron stars, and the other one probably does as well (see e.g. White & Angelini, 2001; in’t Zand et al., 2004, and references within). However, black hole binaries have been seen in extragalactic GCs, proving that they form in such environments. For example, Maccarone et al. (2007) discovered the first GC black hole binary in the giant elliptical galaxy NGC 4472.
The lack of known GC black hole binaries has been a subject of great interest for theoretical modellers. Kalogera et al. (2004) show that black hole binaries formed through exchange interactions should have duty cycles of 0.001, consistent with the absence of GC black hole binaries at the time. They also predict that black hole binaries formed through tidal capture of a main sequence star would be bright, persistent X-ray sources, and infer from their absence that tidal capture probably disrupts the main sequence star. However, neither of these results preclude the discovery of new GC black hole binaries.
The bright X-ray sources of M31 have been studied for over 25 years, with Einstein (Trinchieri & Fabbiano, 1991), ROSAT (Supper et al., 1997, 2001), Chandra (see e.g. Di Stefano et al., 2002; Kaaret, 2002; Williams et al., 2004) and XMM-Newton (see e.g. Shirey et al., 2001; Trudolyubov et al., 2005; Pietsch et al., 2005; Shaw Greening et al., 2008).
Di Stefano et al. (2002) conducted a Chandra survey of selected regions of M31, and found that most of their bright X-ray sources were associated with GCs, with 10% of GC sources exhibiting 0.5–7 keV luminosities 1038 erg s-1. They also showed the M31 GC population to be significantly different from that of the Milky Way, as 30% of the M31 GC X-ray sources exhibited luminosities 1037 erg s-1, whereas only one out of 11 Galactic GC X-ray sources exceeded 1037 erg s-1 (Verbunt et al., 1995). These results contradict those of Supper et al. (2001), who concluded that the GC X-ray populations of the Milky Way and M31 were similar.
Di Stefano et al. (2002) also compared the optical properties of M31 GCs with and without X-ray sources, as well as M31 GCs and Milky Way GCs with X-ray sources. They compared optical colours and apparent magnitudes, radial velocities, metallicities and colour excesses, as well as core radii. They found the only possibly significant difference to be in their luminosities: the median luminosity of M31 GCs with X-ray sources was 0.55 magnitudes higher than that of M31 GCs without. Similarly, M31 X-ray GCs were slightly brighter in V than Milky Way X-ray GCs. Di Stefano et al. (2002) speculated that this might associate X-ray sources with higher GC masses.
We report on three bright X-ray sources in M31, all associated with populous, old globular clusters: Bo 45, Bo 135 and Bo 375. We will argue that Bo 45 contains a good black hole (BH) candidate, while Bo 375 is likely to contain a neutron star (NS). Bo 135 is more likely to contain a NS, but we cannot rule out a BH accretor.
We first review the emission and variability of LMXBs in their various states in Section 2, and then discuss known properties of our targets and their host clusters in Section 3. We describe the observation and analysis in Section 4, and our results in Section 5. We finally present our discussion and conclusions in Section 6.
2. Variability and emission spectra of LMXBs in different states
It was shown by van der Klis (1994) that NS and BH LMXBs accreting at low rates exhibit remarkably similar emission spectra and variability. In this low-hard state, the power density spectrum (PDS) may be characterised by a broken power law with spectral index changing from 0 to 1 at some break frequency; also, the r.m.s. variability is high (10–50%, van der Klis, 1994, 1995; McClintock & Remillard, 2006). However, at higher accretion rates, the PDS may be described by a simple power law with 1 and the r.m.s. variability is only a few percent (van der Klis, 1994, 1995; McClintock & Remillard, 2006).
This change in variability from low to high accretion rate is accompanied by a change in the emission spectra of LMXBs: low-state LMXBs have hard spectra that are characterised by power laws with photon index 1.4–1.7, regardless of the primary (van der Klis, 1994; McClintock & Remillard, 2006). Higher accretion rates lead to distinctive emission spectra, depending on the accretor. BH LMXBs exhibit a thermally dominated state (also known as the high/soft state) where a 0.7–2 keV disc blackbody contributes 90% of the 0.3–10 keV flux (McClintock & Remillard, 2006); they also exhibit a “steep power law” state, where an additional power law component is observed, with a photon index (McClintock & Remillard, 2006). Meanwhile, the emission spectra of high accretion rate NS LMXBs remain predominantly non-thermal, although a second, blackbody component becomes increasingly important at higher luminosities, contributing up to 50% of the flux (see e.g. White et al., 1988; Church & Bałucińska-Church, 1995, 2001; Barnard et al., 2003a, and references within).
Van der Klis (1994) proposed that LMXBs switched from low to high accretion rate behaviour at some constant fraction of the Eddington limit. Barnard et al. (2003b) realised that if this were true, then BH LMXBs would be capable of exhibiting low-state variability and spectra at higher luminosities than neutron star LMXBs, as the Eddington limit is proportional to the mass of the accretor. Barnard et al. (2004) found some empirical evidence for a transition at 10% Edddington. We would therefore expect a LMXB containing a 10 M⊙ BH to exhibit low-state characteristics at 10 times the highest luminosity of low-states observed in 1.4 M⊙ NS LMXBs.
Gladstone et al. (2007) have systematically analysed observations of 40 disc-accreting neutron stars (atoll class LMXBs and millisecond pulsars) from the RXTE database, in order to follow their spectral evolution as a function of luminosity. They excluded sources with high line-of-sight or intrinsic absorption (equivalent to 31022 H atom cm-2), as well as those sources which readily exceed the Eddington limit such as Sco X-1 (see e.g. Barnard et al., 2003a). They found two different types of hard/soft transition: those where the spectrum softens at all energies, leading to a diagonal track on a colour-colour diagram, and those where only the higher energy spectrum softens, giving a vertical track. The diagonal transitions were made at 10% Eddington, while vertical transitions occurred at 2% Eddington in the 0.01–1000 keV band.
Furthermore, GS 2023+338 (a.k.a. V404 Cygni) contains a BH primary with mass 12 M⊙ (Shahbaz et al., 1994); it has exhibited low-state PDS and emission spectra at 2–37 keV luminosities 31038 erg s-1 (Miyamoto et al., 1992; Oosterbroek et al., 1997). This corresponds to a luminosity of 1.20.41038 erg s-1 in the XMM-Newton pass band (0.3–10 keV), for power law emission with photon index 1.0–1.4, as found by Miyamoto et al. (1992). This translates as 8% Eddington for a 12 M⊙ black hole accretor, suggesting that spectral transitions in disc-accreting black holes may occur at similar fractions of the Eddington limit.
We note that the M31 BH candidates identified by Barnard et al. (2003b, 2004) were contaminated by artificial variability that was introduced when combining non-synchronised lightcurves from the different instruments on board XMM-Newton (Barnard et al., 2007b). The current work employs corrected techniques described in Barnard et al. (2007b).
3. Known properties of Bo 45, Bo 135 and Bo 375
3.1. X-ray properties
The X-ray counterpart to Bo 45, has not been previously observed by XMM-Newton or Chandra. However, it was observed by Einstein in 1979–1980 (Trinchieri & Fabbiano, 1991) and by ROSAT in the summers of 1991 and 1992 (Supper et al., 1997, 2001). Supper et al. (1997) designated the X-ray source as RX J0041.7+4134, and found its 0.2–4.0 keV flux to have increased by a factor of 2 with respect to the Einstein observation, from 8.71.1 to 14.40.5 erg cm-2 s-1; this equates to a change in 0.2–4.0 keV luminosity from 61037 to 1.01038 erg s-1 for a 780 kpc distance (Stanek & Garnavich, 1998). For this estimate, they assumed a 5 keV bremsstrahlung emission model, suffering absorption equivalent to 7 H atom cm-2, following Trinchieri & Fabbiano (1991). However, they reported no variability between ROSAT observations greater than 3. We shall refer to this source as XBo 45 for the remainder of the paper.
The X-ray source associated with Bo 135 has been observed by both XMM-Newton and Chandra before; Trudolyubov & Priedhorsky (2004) have analysed these data as part of a spectral survey of M31 GCs. They found the 0.3–10 keV luminosity of Bo 135 to vary over 3.3–4.11038 erg s-1, for power law spectra with photon indices varying over 1.48–1.66. We name this source XBo 135.
The X-ray source associated with Bo 375 has not been previously observed with XMM-Newton. However, it has been observed several times since 1979, with Einstein, ROSAT, ASCA and Chandra; Di Stefano et al. (2002) have analysed many of these observations. They obtained good fits with absorbed power law models for the ASCA and ROSAT spectra, but not the Chandra ACIS-S spectrum; they obtained 0.5–2.4 keV luminosities of 1.4–2.31038 erg s-1, assuming a distance of 780 kpc. Di Stefano et al. (2002) modeled the ACIS-S spectrum with a 0.80 keV blackbody and a power law with photon index, = 1.67, for a 0.3–7 keV luminosity of 4.21038 erg s-1. Trudolyubov & Priedhorsky (2004) re-analysed this Chandra observation, as well as an additional ACIS-S observation taken 4 months later. They modeled the 0.3–7 keV spectra with absorbed power laws, and found that the later observation was a factor 2 brighter. We name this source XBo 375.
3.2. Optical properties of the host clusters
Bo 45, Bo 135, and Bo 375, the host clusters, have been classified as certain globular clusters in the ”The Revised Bologna Catalogue (RBC) of M31 globular clusters and candidates”. They have been imaged with the HST and their nature has been firmly confirmed (RBC V.3.4, January 2008; Galleti et al., 2004, 2005, 2006, 2007).
The integrated magnitudes and colours of the clusters can be found in RBC V.3.4 and can be used to provide estimates of the ages and masses of the clusters, in conjunction with reddening and distance and metal abundance values. Bo 45 has = 15.78, = 1.27, while Bo 135 has = 16.04, = 1.22, and Bo 375 has = 17.61, = 1.02. We have adopted a distance modulus of (7841317 kpc, Stanek & Garnavich, 1998); the first uncertainty is statistical and the second uncertainty is systemmatic. We use a reddening of , which is the average of the reddenings of all M31 clusters in Rich et al. (2005). Actually, for Bo 45, there are specific reddening measurements that have been tabulated in Rich et al. (2005), yielding an average of , which is identical to the mean value we have adopted. Using these values, we have derived and for Bo 45, Bo 135 and Bo 375, respectively. The metal abundances of the three clusters are estimated to be =0.002, 0.0004 and 0.0012 respectively (Bellazzini et al., 1995). According to Sarajedini et al. (2007), the above values for , and suggest that Bo 45 and Bo 135 are at least as old as 1010 yr and at least as massive as M⊙, while the fainter optical luminosity and bluer color of Bo 375 allow it to be as young as 1.2 Gyr and to have a mass as low as 7104 M⊙.
In conclusion, both Bo 45 and Bo 135 seem to belong to the old massive globular cluster population of M31. This is not an unexpected result, since low mass X-ray binaries are found preferentially in luminous (massive) and red globular clusters (Kundu et al., 2008). However, Bo 375 appears to be considerably less massive, and younger, than the other two GCs.
4. Observations and data analysis
The 2006 December 26 and 2007 January 2 observations of M31 with XMM-Newton (Jansen et al., 2001) were conducted as part of the M31 extended survey program (PI W. Pietsch), which expands on the 2002 major axis survey to cover the entire optical D25 region of M31 (see Stiele et al., 2007). In this work, we used the data from the European Photon Imaging Cameras (EPIC): EPIC-pn (Strüder et al., 2001) and EPIC-MOS (Turner et al., 2001). We reconstructed the EPIC-pn and EPIC-MOS events files using the latest version of the XMM-Newton analysis package, SAS 7.1. A journal of observations for the three targets is presented in Table 1.
XMM-Newton observations are known to experience intervals of high background, so we screened these flares in the recommended manner. For the EPIC-pn, we created a 10–12 keV lightcurve with 100 s binning from the whole field of view, selecting only single events (PATTERN==0) from good pixels ( XMMEAEP); we rejected all intervals with 0.4 count s-1. Similarly, we created lightcurves for each EPIC-MOS detector, for all single events with energy 10 keV, with the equivalent EPIC-MOS filter (XMMEAEM). After checking that the flaring intervals were the same in the EPIC-MOS, we filtered the EPIC-pn and EPIC-MOS events files on the EPIC-pn flare filter; resultant good time exposures are provided in Table 1.
For each source, we created a source extraction region and corresponding background region that was at least as big as the source region, on the same CCD, at a similar off-axis angle and contained no point sources or extended emission. For the EPIC-pn events, we accepted PATTERN=4, and FLAG==0, while for EPIC-MOS events we accepted PATTERN=12 and XMMEAEM. We created 0.3–10 keV source and background spectra, along with the appropriate response files. We also created synchronised 0.3–10 keV lightcurves for the EPIC-pn, EPIC-MOS1 and EPIC-MOS2 detectors (see Barnard et al., 2007a, b). These lightcurves were then combined and their variability examined.
To obtain astrometrically-corrected positions we selected the optical sources from the USNO-B1, 2MASS and Local Group Survey (Massey et al., 2006) catalogues, and checked that only one optical source was in the error circle of the corresponding X-ray source. We only accepted sources correlating with globular clusters from the Revised Bologna Catalogue (V3.4) or with foreground stars, characterized by their optical to X-ray flux ratio (Maccacaro et al., 1988) and their hardness ratio (see Stiele et al., 2008). For sources selected from the USNO-B1 catalogue, we used proper-motion corrected positions. We then used the SAS-task eposcorr to derive the offset of the X-ray aspect solution.
5. Results
5.1. Lightcurve analysis
The background regions of XBo 45, XBo 135 and XBo 375 had radii of 30′′, 50′′ and 40′′ respectively, while the source regions had radii of 20′′, 20′′ and 40′′; these source regions were chosen to optimally balance encircled energy, background subtraction and source crowding. We therefore normalised the background lightcurves by the background to source area ratios. The flare-free, normalised background lightcurves were stable at 0.03 count s-1 for all sources.
We present the 0.3–10 keV lightcurves of XBo 45 and XBo 135 in Fig. 1, binned to 400 s. XBo 45 is clearly variable; the r.m.s. variability is 9.20.9%, while the best fit line of constant intensity has a /dof = 356/108. Such variability is expected for low-state LMXBs, with most of the power at frequencies 1 Hz; hence, the true variability of XBo 45 is expected to be higher than 10%. We analysed the power density spectrum of XBo 45, in search of the characteristic broken power law PDS observed in low-state LMXBs. However, no significant power was detected in the PDS. This is likely to be due to faintness of the source. We note that XBo 135 exhibited no detectable variability; the best fit line of constant intensity yielded /dof = 115/108, and its r.m.s. variability was found to be 1.81.8%. The EPIC-pn+EPIC-MOS 0.3–10 keV lightcurve of XBo 375 is shown in in Fig. 2. It is significantly less variable than XBo 45 (/dof = 153/86, 3.40.6% variability) despite having more than twice the intensity.
5.2. Spectral analysis
For each source we simultaneously fitted the EPIC-pn and EPIC-MOS spectra using XSPEC 11.3.21. Table 1 provides the number of net source counts in each detector from each source. For the models discussed below we assumed Solar abundances for our absorber (Anders & Grevesse, 1989). If we use the ISM abundances of Wilms et al. (2000), and the TBabs absorption model in XSPEC, then we obtain column densities 30% higher, but similar emission parameters and luminosities. However, the resulting fits are slightly worse.
5.2.1 Fitting a power law emission model
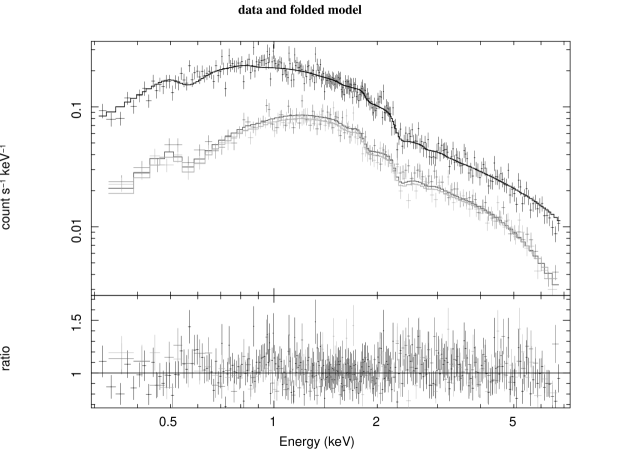
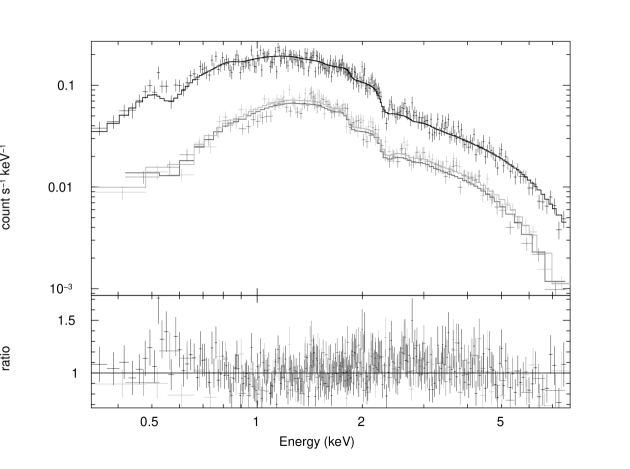
White et al. (1988) found the spectra of low luminosity (i.e. low state) LMXBs to be well described by inverse Compton scattering of cool photons on hot electrons in a corona, and a power law is a simplified representation of this model. Both XBo 45 and XBo 135 were well described by an absorbed, hard power law (see Table 2 for parameters). The best fit power law models to the pn and MOS spectra of XBo 45 and XBo 135 are presented in Fig. 3 and Fig. 4 respectively. The quoted uncertainties correspond to 90% confidence limits. However, the best fit absorbed power law model to the XBo 375 must be rejected.
We also modeled the spectra of XBo 45 and XBo 135 with the comptt spectral model (see Titarchuk, 1994). Our spectra could not sensibly constrain the temperature, favouring 50 keV.
We calculated the luminosities of XBo 45 and XBo 135 using the best fit power law emission models, and a distance of 784 kpc; uncertainties in the distance will be discussed below. The unabsorbed 0.3–10 keV luminosities of XBo 45 and XBo 135 were 2.460.091038 and 4.760.111038 erg s-1 respectively.
5.2.2 Adding a blackbody component
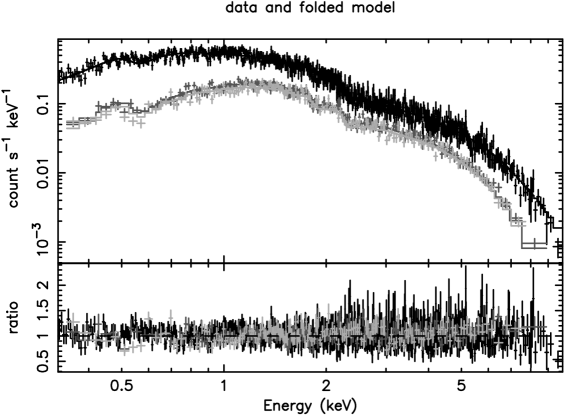
A power law emisssion model is rejected for XBo 375; however, adding a second, blackbody, component yields a good fit, shown in Table 2. The pn and MOS spectra of XBo 375, along with this best fit model, are presented in Fig. 5. The best fit, unabsorbed 0.3–10 keV luminosity for this source is 6.5 erg s-1. The blackbody component contributes 144%. We note that our values of k and are consistent with those found by Di Stefano et al. (2002) for the ACIS-S spectrum; however, our preferred absorption is a factor 2 lower. We note that Di Stefano et al. (2002) found the absorption to vary by a factor of 3 between ROSAT, and Chandra observations, so this is likely to be real.
For XBo 45, the fit is marginally improved by adding a blackbody component; however, the blackbody contribution to the flux could not be sensibly constrained. We infer from this that there is no significant blackbody contribution to the spectrum of XBo 45.
Adding a blackbody component to the XBo 135 emission spectrum improves the fit significantly. The best fit BB+PO model is shown in Table 2. The 0.3–10 keV luminosity for this model is 4.40.2 1038 erg s-1; the blackbody contributes 115%.
The spectra of XBo 375 had twice as many counts as the equivalent spectra of XBo 45 or XBo 135. Hence we created an EPIC-pn spectrum for XBo 375 with a similar number of source photons to the EPIC-pn spectra of XBo 45 and XBo 135, to see if the blackbody component was still necessary. The best fit power law yielded /dof = 324/251 (g.f.p = 0.0013); hence, a blackbody component was still required; the best fit BB+PO model yielded /dof = 265/249 (g.f.p. = 0.22). These results show that the emission of XBo 375 is significantly different from that of XBo 45, where no blackbody is required.
We then modeled the spectra of each source with absorbed blackbody and disc blackbody models, as might be expected for a BH LMXB in the high state. The best fit blackbody models yielded /dof 4 for each source. The disc blackbody models fared better, but still must be rejected, with good fit probabilities ranging from 0.02 for XBo 135 to 10-7 for XBo 375. Hence, we may securely reject thermally dominated emission for each source.
5.2.3 Fitting low-metallicity absorbers
Di Stefano et al. (2002) investigated the effect on modelling XBo 375 spectra of assuming a metallicity appropriate to XBo 375 (6% Solar) for the absorber. Using the vphabs model in XSPEC, they set the H and He abunances to cosmic values, and fixed the abundances of higher elements to 6% Solar. Their modelling of the Chandra data was improved (/dof = 1.29 for 206 dof, c.f. 1.53 for 209 dof for a standard absorber); however, neither fit was formally acceptable (good fit probability 0.003). Neither ROSAT nor ASCA spectra were improved by low metallicity fits.
We therefore modeled our XMM-Newton spectra of XBo 45, XBo 135 and XBo 375, using metallicities of 0.11, 0.02 and 0.06 respectively, as obtained by Bellazzini et al. (1995). We present the best fit models for each source in Table 3. We see that the fits are considerably worse in each case, with only the BB+PO fit to XBo 135 being a good fit. It is likely that the metallicites of the environs surrounding these sources were enhanced by the supernovae that produced the NS/BH accretors, and therefore the GC metallicities are inappropriate.
5.3. The spectral evolution of XBo 45
Of the three sources, only XBo 45 exhibited significant time variability. The observed intensity variation in XBo 45 could be due to one of two phenomena: variation in the emission spectrum or variation in the absorbing material. To test these scenarios, we obtained two additional EPIC-pn spectra: one from a low intensity interval, and another from an interval of high intensity, represented in Fig. 1 by a solid line and a dashed line respectively. We applied the same response and background files to these spectra as to the original XBo 45 spectrum. The low intensity spectrum contained 3000 source counts, for a mean intensity of 0.4240.008 count s-1, while the high intensity spectrum contained 4500 source counts, with a mean intensity of 0.5120.008 count s-1.
Simultaneously fitting the low and high intensity spectra with and normalisation linked but free to vary, and with the absorption () free to vary yielded an unacceptable best fit. We then linked and , varying only the normalisation; this produced an acceptable fit. Finally, we freely fitted each spectrum, and found that and were consistent within 90% confidence limits for the two spectra. The best fits for each of these models are presented in Table 4. It is clear that the variation is intrinsic to the X-ray source, rather than the absorber; such variation is characteristic of low state LMXBs (van der Klis, 1994).
5.4. Are the X-ray sources associated with the GCs?
Mass segregation is thought to concentrate binaries, which are amongst the heaviest objects in globular clusters, to the centre of the cluster (e.g. Meylan & Heggie, 1997). The X-ray sources are each located 1′′ from their respective GC positions, with positional errors of 1′′. Of the three GCs, only Bo 45 has sufficient quality data to measure its structure. Barmby et al. (2007) used HST observations of Bo 45 to model its spatial characteristics, and found a core radius of 0.3′′ and a half-mass radius of 1′′. It is therefore impossible to confirm whether the X-ray sources are located in the central regions of the GCs.
Following Maccarone et al. (2007), we first calculated the probability that the X-ray sources have GC associations purely through chance, and then calculated the probability that these sources are active galacic nuclei (AGN) that are coincident with the GCs.
Both XBo 45 and XBo 135 were observed in the NN1 region (Table 1). Assuming a circular field of view with 15′ radius, we searched the literature for GCs and GC candidates within the NN1 observation, finding 16 GCs and 51 GC candidates. Hence the GC spatial density 310-5 per square arcsec. We found 30 X-ray sources with 100 photons in the EPIC-pn camera; therefore the probability of finding a GC within 1′′ of a bright X-ray sources is 910-4, and the probability of two chance associations is 810-7.
XBo 375 was observed in the NS2 region (Table 1). We found 19 GCs and 39 GC candidates, giving a spatial density 210-5. There were 20 sources with 100 EPIC-pn counts, and the probability of a GC coinciding with one of these by chance is 410-4.
We estimated the probability that the X-ray sources were AGN by utilising the work of Moretti et al. (2003), who have modeled the AGN flux distributions in the 1–2 keV and 2–10 keV bands. We found 0.33 AGN per square degree with 1–2 keV fluxes as high as the 1–2 keV flux of XBo 45 (4.410-13 erg cm-2 s-1), and 0.08 AGN per square degree with 2–10 keV fluxes as high for XBo 45 (2.31012 erg cm-2 s-1). Even if we assume that none of these 2–10 keV sources are included in the 1–2 keV sources, and take the upper limits, then the spatial density of AGN as bright as XBo 45 is 710-8 per square arcsec; the probability of such an AGN coinciding with a GC is 510-6. Furthermore, XBo 135 and XBo 375 are more luminous than XBo 45, and they are even less likely to be AGN.
We also note that any AGN, or indeed foreground star, would be very likely to distort the optical colours of the cluster. We therefore conclude that the X-ray sources are very probably associated with the GCs.
6. Discussion and conclusions
We have examined the emission spectra and time variability of three X-ray sources associated with GCs in M31, using the 2006 December 26 and 2007 January 2 XMM-Newton observations. The emission of XBo 45 is well described by a pure power law with photon index 1.4, and is highly variable. This is consistent with a NS or BH LMXB in the low state (van der Klis, 1994), but is not consistent with a BH LMXB in the high state or steep power law state (McClintock & Remillard, 2006, and references within), or a NS LMXB emitting at 1038 erg s-1 (White et al., 1988; Church & Bałucińska-Church, 2001; Barnard et al., 2003a).
Stanek & Garnavich (1998) calculated a distance to M31 of 784 kpc, 13 kpc of statistical error, 17 kpc of systematic error. Combining these distance uncertainties adds further uncertainties in the source luminosities of 5%. Therefore, the 0.3–10 keV luminosity range for XBo 45 is 2.50.21038 erg s-1, or 14010% of the Eddington limit for a 1.4 M⊙ neutron star primary. However, several LMXBs have been found to contain neutron stars with mass as high as 2.1 M⊙ (see e.g. Nice et al., 2005; Özel, 2006); XBo 45 has a 0.3–10 keV luminosity of 80% Eddington for such systems. Since Gladstone et al. (2007) showed that transitions in neutron star LMXBs occur at 10% Eddington, we consider XBo 45 to exhibit low state behaviour at an apparent luminosity too high for a neutron star. We therefore identify the accretor in XBo 45 as a BH candidate. We note that XBo 45 has been observed several times by the Einstein and ROSAT observatories over the last years, varying in luminosity only by a factor of 2. This behaviour is consistent with that predicted for a GC BH binary formed by tidal capture (Kalogera et al., 2004).
In contrast to XBo 45, the observed two component emission of XBo 375 is consistent with a bright NS LMXB, but not a low state NS or BH LMXB, nor a BH in the high or steep power law states. Hence, we classify XBo 375 as a NS LMXB. Finally, the emission spectrum of XBo 135 is consistent with a pure power law with photon index 1.6, but the fit is significantly improved by adding a blackbody component. Hence, XBo 135 is consistent with a NS or BH LMXB, and deeper observation is required for further classification.
Of the thirteen bright X-ray sources in Galactic GCs, twelve have exhibited X-ray bursts, confiming their natures as NS LMXBs (see Verbunt & Lewin, 2006, for a review). Pietsch & Haberl (2005) conducted a survey of XMM-Newton observations of X-ray sources associated with M31 GCs, looking for X-ray bursts. They found simultaneous pn and MOS detections of bursts in two sources, and several burst candidates that were detected in the pn only. Such bursts would be identifiable in the lightcurves of our target sources. However, X-ray bursts are thought to be forbidden at luminosities 50% Eddington (Lewin et al., 1993), hence we do not expect bursts from XBo 135 or XBo 375.
XBo 45 exhibits low-state behaviour at luminosities 10 times higher than expected for 1.4 M⊙ NS LMXBs; XBo 135 may also. A composite of two or three bright X-ray sources would likely result in a different spectrum to that observed in XBo 45; hence, if XBo 45 were a composite, it would be more likely to be made from 10 NS LMXBs in the low state. Di Stefano et al. (2002) calculated the probability for a GC to contain multiple bright X-ray sources: they argue that if is the probability of finding one bright X-ray source in a GC, then Poisson statistics dictate that probability for two bright X-ray sources should be /2, while the probability for 3 bright X-ray sources should be /6. For a 0.1–0.2, Di Stefano et al. (2002) predict 3–5 GCs with 2 X-ray sources and less than 1 with 3 X-ray sources in M31. It is therefore very unlikely that XBo 45 combines the emission of 10 low-state neutron star LMXBs.
It is however possible that the emission from XBo 45 is anisotropic. It exhibits low-state spectra at luminosities 10–20 times higher than expected for neutron star LMXBs; hence it could simply be beamed by a factor of 10–20. In this case, the emission would be restricted to a small solid angle; one might expect to observe such beaming in 5–10% of randomly oriented systems. Trudolyubov & Priedhorsky (2004) modeled the spectra of 43 M31 GCs. If we loosely class a low-state spectrum as a power law with 1.7, then Trudolyubov & Priedhorsky (2004) found 20 GCs consistent with low-state spectra. Five of those, XBo 5, XBo 82, XBo 135, XBo 153 and XBo 386 exhibited apparent luminosities 1038 erg s-1. If we include XBo 45, then 6 out of 21 GC systems consistent with low-state spectra (including XBo 45), have measured luminosities 1038, i.e. 30%, a significantly larger fraction than expected from beaming.
We note that the host cluster Bo 45, which contains a BH LMXB candidate, is significantly larger than the cluster Bo 375 (see Section 3.2), which we think contains a NS LMXB. Di Stefano et al. (2002) describe Bo 375 as not at all unusual, with parameters close to the median of M31 GCs. This suggests that Bo 45 (and also Bo 135) are particularly massive, and may therefore be more prone to forming BH LMXBs. Therefore we conclude that, unlike the Milky Way, at least one GC in M31 is likely to contain a black hole binary.
References
- Anders & Grevesse (1989) Anders, E. & Grevesse, N. 1989, Geochim. Cosmochim. Acta, 53, 197
- Barmby et al. (2007) Barmby, P., McLaughlin, D. E., Harris, W. E., Harris, G. L. H., & Forbes, D. A. 2007, AJ, 133, 2764
- Barnard et al. (2003a) Barnard, R., Church, M. J., & Bałucińska-Church, M. 2003a, A&A, 405, 237
- Barnard et al. (2004) Barnard, R., Kolb, U., & Osborne, J. P. 2004, A&A, 423, 147
- Barnard et al. (2007a) Barnard, R., Kolb, U. C., & Osborne, J. P. 2007a, A&A, 469, 873
- Barnard et al. (2003b) Barnard, R., Osborne, J. P., Kolb, U., & Borozdin, K. N. 2003b, A&A, 405, 505
- Barnard et al. (2007b) Barnard, R., Trudolyubov, S., Kolb, U. C., et al. 2007b, A&A, 469, 875
- Bellazzini et al. (1995) Bellazzini, M., Pasquali, A., Federici, L., Ferraro, F. R., & Pecci, F. F. 1995, ApJ, 439, 687
- Church & Bałucińska-Church (2001) Church, M. J. & Bałucińska-Church, M. 2001, A&A, 369, 915
- Church & Bałucińska-Church (1995) Church, M. J. & Bałucińska-Church, M. 1995, A&A, 300, 441
- Di Stefano et al. (2002) Di Stefano, R., Kong, A. K. H., Garcia, M. R., et al. 2002, ApJ, 570, 618
- Galleti et al. (2007) Galleti, S., Bellazzini, M., Federici, L., Buzzoni, A., & Fusi Pecci, F. 2007, A&A, 471, 127
- Galleti et al. (2005) Galleti, S., Bellazzini, M., Federici, L., & Fusi Pecci, F. 2005, A&A, 436, 535
- Galleti et al. (2006) Galleti, S., Federici, L., Bellazzini, M., Buzzoni, A., & Fusi Pecci, F. 2006, A&A, 456, 985
- Galleti et al. (2004) Galleti, S., Federici, L., Bellazzini, M., Fusi Pecci, F., & Macrina, S. 2004, A&A, 416, 917
- Gladstone et al. (2007) Gladstone, J., Done, C., & Gierliński, M. 2007, MNRAS, 378, 13
- in’t Zand et al. (2004) in’t Zand, J., Verbunt, F., Heise, J., et al. 2004, To appear in ”The Restless High-Energy Universe” (2nd BeppoSAX Symposium), eds. E.P.J. van den Heuvel, J.J.M. in ’t Zand & R.A.M.J. Wijers, Nucl. Instrum. Meth. B Suppl. Ser, astro-ph/0403120
- Jansen et al. (2001) Jansen, F., Lumb, D., Altieri, B., et al. 2001, A&A, 365, L1
- Kaaret (2002) Kaaret, P. 2002, ApJ, 578, 114
- Kalogera et al. (2004) Kalogera, V., King, A. R., & Rasio, F. A. 2004, ApJL, 601, L171
- Kundu et al. (2008) Kundu, A., Zepf, S. E., & Maccarone, T. J. 2008, ArXiv e-prints, 801
- Lampton et al. (1976) Lampton, M., Margon, B., & Bowyer, S. 1976, ApJ, 208, 177
- Lewin et al. (1993) Lewin, W. H. G., van Paradijs, J., & Taam, R. E. 1993, Space Science Reviews, 62, 223
- Maccacaro et al. (1988) Maccacaro, T., Gioia, I. M., Wolter, A., Zamorani, G., & Stocke, J. T. 1988, ApJ, 326, 680
- Maccarone et al. (2007) Maccarone, T. J., Kundu, A., Zepf, S. E., & Rhode, K. L. 2007, Nature, 445, 183
- Massey et al. (2006) Massey, P., Olsen, K. A. G., Hodge, P. W., et al. 2006, AJ, 131, 2478
- McClintock & Remillard (2006) McClintock, J. E. & Remillard, R. A. 2006, Compact stellar X-ray sources, 157
- Meylan & Heggie (1997) Meylan, G. & Heggie, D. C. 1997, A&A Rev., 8, 1
- Miyamoto et al. (1992) Miyamoto, S., Kitamoto, S., Iga, S., Negoro, H., & Terada, K. 1992, ApJL, 391, L21
- Moretti et al. (2003) Moretti, A., Campana, S., Lazzati, D., & Tagliaferri, G. 2003, ApJ, 588, 696
- Nice et al. (2005) Nice, D. J., Splaver, E. M., Stairs, I. H., et al. 2005, ApJ, 634, 1242
- Oosterbroek et al. (1997) Oosterbroek, T., van der Klis, M., van Paradijs, J., et al. 1997, A&A, 321, 776
- Özel (2006) Özel, F. 2006, Nature, 441, 1115
- Pietsch et al. (2005) Pietsch, W., Freyberg, M., & Haberl, F. 2005, A&A, 434, 483
- Pietsch & Haberl (2005) Pietsch, W. & Haberl, F. 2005, A&A, 430, L45
- Rich et al. (2005) Rich, R. M., Corsi, C. E., Cacciari, C., et al. 2005, AJ, 129, 2670
- Sarajedini et al. (2007) Sarajedini, A., Barker, M. K., Geisler, D., Harding, P., & Schommer, R. 2007, AJ, 133, 290
- Shahbaz et al. (1994) Shahbaz, T., Ringwald, F. A., Bunn, J. C., et al. 1994, MNRAS, 271, L10
- Shaw Greening et al. (2008) Shaw Greening, L., Barnard, R., Kolb, U., Tonkin, C., & Osborne, J. P. 2008, ArXiv e-prints, ’A&A accepted’
- Shirey et al. (2001) Shirey, R., Soria, R., Borozdin, K., et al. 2001, A&A, 365, L195
- Stanek & Garnavich (1998) Stanek, K. Z. & Garnavich, P. M. 1998, ApJL, 503, L131+
- Stiele et al. (2007) Stiele, H., Pietsch, W., Haberl, F., & for the XMM-Newton M 31 large program collaboration. 2007, ArXiv e-prints, 711
- Stiele et al. (2008) Stiele, H., Pietsch, W., Haberl, F., & Freyberg, M. 2008, A&A, 480, 599
- Strüder et al. (2001) Strüder, L., Briel, U., Dennerl, K., et al. 2001, A&A, 365, L18
- Supper et al. (2001) Supper, R., Hasinger, G., Lewin, W. H. G., et al. 2001, A&A, 373, 63
- Supper et al. (1997) Supper, R., Hasinger, G., Pietsch, W., et al. 1997, A&A, 317, 328
- Titarchuk (1994) Titarchuk, L. 1994, ApJ, 434, 570
- Trinchieri & Fabbiano (1991) Trinchieri, G. & Fabbiano, G. 1991, ApJ, 382, 82
- Trudolyubov et al. (2005) Trudolyubov, S., Kotov, O., Priedhorsky, W., Cordova, F., & Mason, K. 2005, ApJ, 634, 314
- Trudolyubov & Priedhorsky (2004) Trudolyubov, S. & Priedhorsky, W. 2004, ApJ, 616, 821
- Turner et al. (2001) Turner, M. J. L., Abbey, A., Arnaud, M., et al. 2001, A&A, 365, L27
- van der Klis (1994) van der Klis, M. 1994, ApJs, 92, 511
- van der Klis (1995) —. 1995, X-ray Binaries (Cambridge University Press), 256–307
- Verbunt et al. (1995) Verbunt, F., Bunk, W., Hasinger, G., & Johnston, H. M. 1995, A&A, 300, 732
- Verbunt & Lewin (2006) Verbunt, F. & Lewin, W. H. G. 2006, Globular cluster X-ray sources (Compact stellar X-ray sources), 341–379
- White & Angelini (2001) White, N. E. & Angelini, L. 2001, ApJL, 561, L101
- White et al. (1988) White, N. E., Stella, L., & Parmar, A. N. 1988, ApJ, 324, 363
- Williams et al. (2004) Williams, B. F., Garcia, M. R., Kong, A. K. H., et al. 2004, ApJ, 609, 735
- Wilms et al. (2000) Wilms, J., Allen, A., & McCray, R. 2000, ApJ, 542, 914
| Source | X-ray Position | Observation | Date | Exp | pn cnt | MOS1 cnt | MOS2 cnt |
|---|---|---|---|---|---|---|---|
| XBo 45 | 00h41m 43.19s +41∘34′20.1′′ | NN1 (00h41m52.8s 36′36.0′′) | 2006-12-26 | 40 ks | 16894 | 7416 | 6953 |
| XBo 135 | 00h42m52.00s +41∘31′09.7′′ | NN1 | 2006-12-26 | 40 ks | 15104 | 5560 | 6090 |
| XBo 375 | 00h45m45.54s +41∘39′42.6′′ | NS2 (00h45m50.4s +41∘30′44.7′′) | 2007-01-02 | 32 ks | 31946 | 15686 | 13798 |
| Source | /1021 cm-2 | k/keV | /dof [gfp] | /10-12 erg cm-2 s-1 | |||
|---|---|---|---|---|---|---|---|
| XBo 45 PO | 1.41(11) | 1.45(4) | 1.06(4) | 1.03(4) | 517/487 [0.17] | 3.34(12) | |
| XBo 45 BB+PO | 1.46(19) | 1.23(19) | 1.57(6) | 1.06(3) | 1.03(2) | 501/485 [0.30] | 3.2(2) |
| XBo 135 PO | 2.76(12) | 1.56(3) | 1.12(3) | 1.06(3) | 467/435 [0.14] | 6.45(15) | |
| XBo 135 BB+PO | 2.3(3) | 0.8(2) | 1.54(14) | 1.12(3) | 1.06(3) | 413/433 [0.75] | 6.0(3) |
| XBo 375 PO | 1.52(6) | 1.64(2) | 1.15(2) | 1.07(2) | 1180/1032 [9E-4] | 9.17(17) | |
| XBo 375 BB+PO | 1.41(11) | 0.90(10) | 1.73(18) | 1.15(2) | 1.07(2) | 1110/1030 [0.19] | 8.8(3) |
| Source | /1021 cm-2 | k /keV | /dof [gfp] | ||||
|---|---|---|---|---|---|---|---|
| XBo 45 PO | 0.188(12) | 1.33(2) | 1.06(2) | 1.05(2) | 567/487 [7E-3] | ||
| XBo 135 PO | 0.58(4) | 1.39(2) | 1.13(3) | 1.06(3) | 740/435 [3E-18] | ||
| XBo 135 BB+PO | 0.24(4) | 0.69(2) | 1.05(5) | 1.13(3) | 1.07(3) | 436/433 [0.45] | |
| XBo 375 BB+PO | 0.131(14) | 0.69(4) | 1.42(3) | 1.15(2) | 1.07(2) | 1110/1030[0.04] |
| Variable absorption | Variable normalisation | Free fitting | |||||||
|---|---|---|---|---|---|---|---|---|---|
| /1021 cm-2 | /dof [gfp] | /1021 cm-2 | /dof [gfp] | /1021 | /dof [gfp] | ||||
| High | 1.4(2) | 1.51(8) | 193/129 [1.9e-4] | 1.5(2) | 1.50(8) | 140/129 [0.23] | 1.5(3) | 1.45(10) | 125/127 [0.54] |
| Low | 1.5(3) | 1.51(8) | 1.5(2) | 1.50(8) | 1.4(4) | 1.57(15) | |||


.
.
.